Exhibit 99.8
CORPORATE PROFILE
Lake Shore Gold Corp. is a mining company anchored in the century-old Timmins Gold Camp with a goal to build a new, mid-tier gold producer. The Company’s Timmins West Complex, including the Timmins Mine and Thunder Creek properties, is being developed by both shaft and ramp. Timmins Mine is on track for commercial production during the fourth quarter of 2010, with advanced exploration work continuing at Thunder Creek. The Bell Creek Mill, located on the east side of Timmins, is operational at a capacity of 1,500 tonnes per day with gold extracted using both the gravity and carbon-in-pulp methods. The Company is also progressing an underground advanced exploration program at its Bell Creek Complex properties. Lake Shore Gold continues to invest aggressively in exploration primarily in Timmins and in select other areas of Northern Ontario and Quebec as well as in Mexico. The Company’s common shares trade on the TSX under the symbol LSG.

TABLE OF CONTENTS
1 | | Performance Versus 2009 Objectives Objectives for 2010 |
2 | | Letter from the President & CEO |
4 | | Management’s Discussion & Analysis |
24 | | Auditors’ Report |
25 | | Consolidated Balance Sheets |
26 | | Consolidated Statements of Income (Loss) and Deficit |
26 | | Consolidated Statements of Comprehensive Income (Loss) |
27 | | Consolidated Statements of Cash Flows |
28 | | Notes to the Consolidated Financial Statements |
48 | | Corporate Information |
Photo Captions
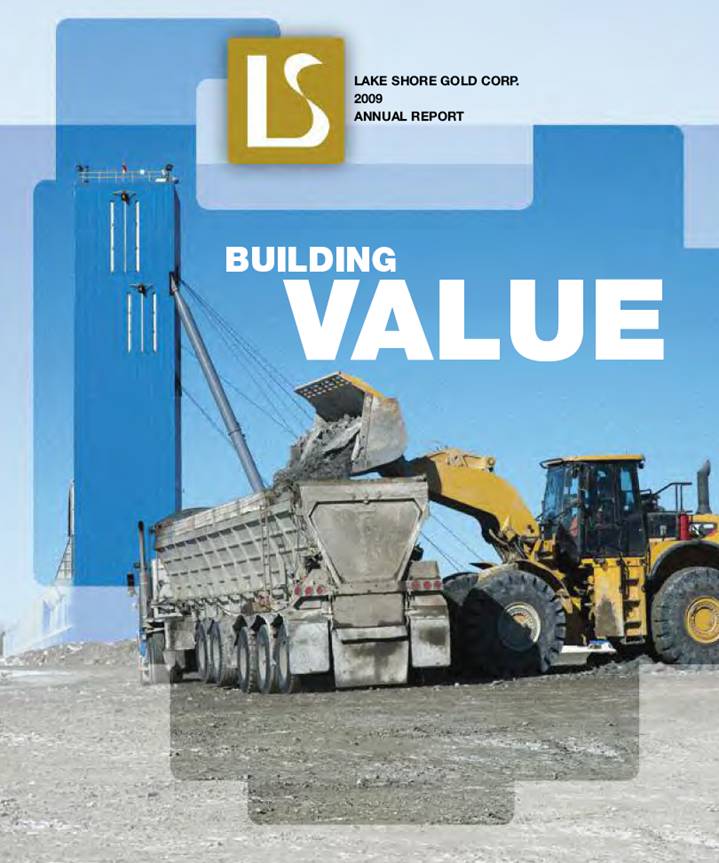
Cover: A 40-tonne truck being loaded at the Timmins Mine for delivery to the Bell Creek Mill. Inside front cover: (Left to right) Gold pouring at the Bell Creek Mill; A six-yard scoop operating on the 650 Level at Timmins Mine; Material being dumped on surface at Timmins Mine; A 20-tonne truck emerging from the ramp portal at the Bell Creek Mine; A gold bar poured at the Bell Creek Mill.
PERFORMANCE VERSUS 2009 OBJECTIVES
1. Commence processing development ore from Timmins Mine at Bell Creek Mill with 30,000 ounces of gold expected in 2009.
Exploration success at Thunder Creek in 2009 led the Company to acquire West Timmins Mining Inc. in November and re-direct resources from development at Timmins Mine to drifting from Timmins Mine to the consolidated Thunder Creek property as part of an advanced exploration program. Changing priorities, plus the grades encountered while mining the small vein zones in the top portion of the Timmins ramp, resulted in a revision to the Company’s production target to 7,500 ounces. A total of 7,700 ounces of gold was produced in 2009.
2. Achieve average rate of 500 tonnes per day from Timmins Mine by end of 2009.
A mining rate averaging approximately 500 tonnes per day was achieved in December 2009.
3. Complete the Timmins shaft to the 710 metre level, complete initial bulk sampling and conduct underground diamond drilling by year end.
The Timmins shaft was completed to 670 metres by May 2009 with underground diamond drilling, development and sampling being carried out throughout the balance of the year. In order to prioritize drifting from Timmins Mine to Thunder Creek, the Timmins shaft was not completed to the 710 metre level until early in 2010.
4. Increase Bell Creek Mill capacity to 1,500 tonnes per day by end of 2009.
The capacity of the Bell Creek Mill was increased to 1,500 tonnes per day by late in the third quarter of 2009.
5. Progress exploration programs at Timmins Mine, Bell Creek, Thunder Creek and Casa Berardi, with total exploration drilling at all properties of approximately 100,000 metres.
The Company completed a total of 128,016 metres of surface and underground drilling in 2009 and from this drilling reported new discoveries at Thunder Creek, Bell Creek and Casa Berardi.
6. Commence advanced exploration work at Bell Creek Complex, including de-watering the existing Bell Creek Mine shaft and developing a surface ramp to access mineralization at Bell Creek and Vogel.
An advanced exploration program commenced in May 2009. By early 2010, the Bell Creek shaft and mine workings had been de-watered to a depth of 255 metres, with the remaining 37 metres being used as a sump, and a ramp had been collared and advanced 1,200 metres (to a vertical depth of 180 metres) with another 220 metres of advance towards Vogel.
Through Exploration, Development, Operation and Growth
OBJECTIVES FOR 2010
1. Declare commercial production at Timmins Mine.
2. Produce 65,000 ounces of gold at Bell Creek Mill from pre-production and production activities at Timmins Mine and from advanced exploration work at Thunder Creek and Bell Creek Complex.
3. Report a National Instrument 43-101 resource and process initial material from the Bell Creek Mine.
4. Access mineralization underground at Thunder Creek and commence processing material from advanced exploration activities.
5. Increase exploration drilling with a focus on advancing the Company’s Timmins projects.
6. Continue to work towards zero harm in the areas of health, safety, environment and community.
LAKE SHORE GOLD CORP. ANNUAL REPORT 2009
1

TONY MAKUCH
President & CEO
Building Value through Exploration, Development, Operation and Growth
Lake Shore Gold’s goal is to build a new, mid-tier gold producer over the next three to five years through the successful exploration, development and operation of three wholly owned mines in Timmins, Ontario: Timmins Mine, Thunder Creek and the Bell Creek Complex.
During 2009, we completed advanced exploration work and transitioned to pre-production development at Timmins Mine; refurbished the Bell Creek Mill to a capacity of 1,500 tonnes per day; and commenced underground advanced exploration programs at both Bell Creek Complex and Thunder Creek. We also recorded excellent exploration success and added significant new land positions in Timmins through the acquisition of West Timmins Mining Inc. and 28 square kilometres surrounding the Bell Creek Complex from Goldcorp.
The acquisition of West Timmins was especially important. Through this transaction, we consolidated Thunder Creek and added an additional 120 square kilometres of highly prospective land along the western extension of the Timmins Camp, as well as attractive land holdings in Mexico.
2
At Timmins Mine, we have completed the shaft to 710 metres and are on track to declare commercial production during the fourth quarter of 2010. Underground drilling to date has shown that the widths and grades of mineralization in a 50-metre test block above the 650 Level reconcile well to the original resource estimate and that we have the potential to increase tonnes and ounces in the Ultramafic Zone at slightly lower grades.
At Thunder Creek, we are drifting from Timmins Mine to intersect high-grade mineralization at two levels. The 200 Level drift is expected to access Thunder Creek Rusk Zone mineralization by the end of June, with a drift off the 650 Level at Timmins Mine to access a high-grade core of mineralization in both the Rusk and Porphyry zones at Thunder Creek by the end of the third quarter of 2010.
Work to date at Bell Creek Complex has included de-watering the Bell Creek shaft and workings and driving a ramp from surface. During 2009, 7,700 ounces of gold were produced at the Bell Creek Mill. Production in 2010 is expected to grow to 65,000 ounces, with mill feed coming from Timmins Mine, Thunder Creek and Bell Creek. We expect to exit the year producing at a rate of 10,000 ounces per month from all sources, and to grow this level as 2011 progresses.
Our strategy is focused on building a strong base of reserves and resources and rapidly growing production. Critical to this strategy has been success with the drill bit. In 2009, we completed 128,016 metres of drilling and plan to increase exploration activity in 2010.
At Thunder Creek, during 2009 we announced one of the best intercepts ever reported in Timmins, 12.75 grams per tonne over 83.40 metres, and extended the mineralization to 1,125 metres at depth. We have continued to report excellent results this year and recently announced that the Thunder Creek Rusk Horizon has been intersected at a depth of 1,700 metres.
We have also reported very encouraging results at Bell Creek, including confirming the existence of a new high-grade gold system to a depth below 1,300 metres down plunge. Our priority at Bell Creek this year is establishing National Instrument 43-101 resources and completing initial scoping/pre-feasibility studies for extending the shaft and mine development to a depth of 1,500 metres.
Recent surface drilling at Timmins Mine has extended mineralization within a newly emerging fold nose by 130 metres down plunge and 100 metres to the west. These results highlight the significant potential to add new ounces at Timmins Mine.
Looking to the future, we have a strong base from which to grow. Organically, our project pipeline is well stocked. In Timmins, our total land package exceeds 160 square kilometers of prospective property. We also have extensive land holdings along the Casa Berardi Break in Northern Ontario and Quebec, as well as attractive land positions in Mexico.
Lake Shore Gold is on track to build a new mid-tier gold producer over the next three to five years. We are achieving our goal through successful exploration, effective development of assets, emerging production capacity and an excellent growth profile. Very importantly, we are also building a quality team of people with a capable workforce of 445 employees and contractors, a strong management team and an effective board. We are pleased with where we find ourselves and look forward to further success in the coming year.
/s/ Tony Makuch | |
TONY MAKUCH | |
President & CEO | |
3
LAKE SHORE GOLD CORP.
MANAGEMENT’S DISCUSSION & ANALYSIS
Fourth quarter and year ended December 31, 2009 and 2008
GENERAL
The information in this Management’s Discussion and Analysis, or MD&A, is intended to assist the reader in the understanding and assessment of the trends and significant changes in the results of operations and financial conditions of Lake Shore Gold Corp. (the “Company” or “Lake Shore Gold”). This MD&A should be read in conjunction with the audited consolidated financial statements of the Company, including the notes thereto, for the years ended December 31, 2009 and 2008 (the “financial statements”), which are prepared in accordance with Canadian generally accepted accounting principles. This MD&A has taken into account information available up to and including March 9, 2010. All dollar amounts in this MD&A are expressed in Canadian dollars unless otherwise stated.
Lake Shore Gold is a mining company with a goal to become a North American mid-tier gold producer through property acquisition, exploration, new mine development and construction, and production from its Timmins, Ontario properties. The Company is currently carrying out an underground advanced exploration program at its 100%-owned Timmins Mine project, where it has both a shaft and a ramp, and recently commenced advanced exploration work at the adjacent Thunder Creek property. The Bell Creek Mill, located on the east side of Timmins, has been refurbished to a capacity of 1,500 tonnes per day. The Company is also making progress with an underground advanced exploration program at its Bell Creek Complex, which is moving forward to become the Company’s second mining operation in the Timmins Camp. The Company continues to invest aggressively on exploration primarily in Timmins and in select other areas of Northern Ontario and Quebec, and owns a large land position in Mexico. Lake Shore Gold is well financed with $132.9 million of cash and cash equivalents as at December 31, 2009. The Company is a reporting issuer in British Columbia, Alberta, Manitoba, Ontario and Quebec, and trades on the Toronto Stock Exchange (“TSX”) under the symbol LSG.
This MD&A contains forward-looking statements. For example, statements in the “Strategy” and “Outlook” sections of this MD&A with respect to planned or expected development, production and exploration are all forward-looking statements. As well, statements about the sufficiency of the Company’s cash resources or the need for future financing are also forward-looking statements. All forward-looking statements, including forward-looking statements not specifically identified in this paragraph, are made subject to the cautionary language at the end of this document, and readers are directed to refer to that cautionary language when reading any forward-looking statements.
COMPANY STRATEGY
The Company’s goal is to build a new mid-tier gold company. Critical to achieving this goal is the successful exploration, development and operation of three wholly owned projects in the Timmins Camp, Timmins Mine, Thunder Creek and Bell Creek Complex. During 2009, the Company advanced the 100% owned Timmins Mine towards commercial production expected by the fourth quarter of 2010; refurbished the Bell Creek Mill to a capacity of 1,500 tonnes per day; and commenced underground advanced exploration programs at both the Bell Creek Complex and Thunder Creek property. The Company also completed 128,016 metres of underground and surface drilling and reported encouraging exploration results from Thunder Creek, Bell Creek and the Timmins Mine.
Significant new land positions were added in the Timmins Camp through two business transactions late in 2009, including the completion of the acquisition of West Timmins Mining Inc (“West Timmins”) in November and the acquisition of 28 square kilometres of prospective exploration property surrounding the Bell Creek Complex from Goldcorp Canada Ltd. and Goldcorp Inc. in December 2009.
HIGHLIGHTS
Acquisition of West Timmins Mining Inc.
On November 6, 2009, Lake Shore Gold acquired all the outstanding common shares of West Timmins with shareholders of West Timmins receiving 0.73 of a Lake Shore Gold common share for each common share of West Timmins they held. Lake Shore Gold issued approximately 104 million common shares pursuant to the transaction. As a result of the transaction, Lake Shore Gold acquired the 40% interest in Thunder Creek that it did not already own, an additional 120 square kilometres of highly prospective property along the western extension of the Timmins mining trend, and extensive land holdings in Mexico.
4
Advanced Exploration Program at Timmins Mine continues on schedule and on budget
During 2009, the Timmins Mine shaft was sunk to the 670 metre level, with the 650 Level shaft station being completed in June and initial development into the Ultramafic Zone mineralization commencing in September. Development on the 650 Level continued throughout the fourth quarter of 2009 and into 2010, in addition to ongoing diamond drilling, chip and muck sampling of development faces and geologic mapping. Results from this work have shown that the widths and grades of mineralization are consistent with previous surface drilling and suggest that the tonnes and ounces for the Ultramafic Zone resource can be expanded from the most recent 43-101 resource calculation at slightly lower grades.
The Company has completed sinking of the shaft to the 710 metre level and will complete installation of the loading pocket, bins and shaft conveyances in May 2010 with commercial production targeted in the fourth quarter.
The Timmins Mine ramp reached the 200 metre vertical level as of the end of 2009, in line with the Company’s target. Work in the ramp led the Company to conclude late in the year that the shallow, distinct vein systems in the ramp are weaker in continuity and have greater complexity than predicted in the original surface drilling, which resulted in a reduction in the reserve of approximately 14,000 ounces in the latest National Instrument (“NI”) 43-101 Technical Report for Timmins Mine (filed on October 6, 2009).
Thunder Creek advanced exploration program commenced during fourth quarter 2009
In November 2009, following the acquisition of the 40% of Thunder Creek not already owned by Lake Shore Gold, the Company commenced an advanced exploration program on the property. The program involves drifting across to high-grade mineralization at Thunder Creek from the 200 Level and 650 Level at the Timmins Mine to facilitate development of ore grade mineralization and to support an underground drilling program. As of March 9, 2010 the drift from the 200 Level at Timmins Mine had advanced approximately 560 metres (51% complete) towards Thunder Creek, while the 650 Level drift had progressed 280 metres (35% complete). The 200 Level drift is expected to reach mineralization at the 295 Level at Thunder Creek, around the location of Hole TC07-36 (24.61 gpt over 7.00 metres), by the end of June, with the 650 Level drift to access a high-grade core of mineralization, near Hole TC09-68b (12.75 gpt. over 83.40 metres), by the end of the third quarter of 2010.
Bell Creek Mill refurbished to 1,500 tonne per day capacity
The Bell Creek Mill was refurbished to a capacity of 800 tonnes per day as of the end of 2008, with initial processing of development material from Timmins Mine commencing near the end of March 2009. Processing activities were carried out sporadically in the initial months of operation. Work to refurbish the secondary ball circuit and perform other work required to increase the Mill’s capacity to 1,500 tonnes per day was completed near the end of the third quarter of 2009. The Mill continued to operate at approximately 800 tonnes per day in campaigns to the end of the year and into 2010 with plans to commission the secondary circuit and increase throughput to full capacity by the end of the third quarter of 2010.
During 2009, a total of 7,700 ounces of gold was produced, mainly from development and material from Timmins Mine. This production was in line with a revised target of 7,500 ounces for the year. The target was revised in November following the acquisition of West Timmins Mining Inc., reflecting the Company’s decision to prioritize drifting from the Timmins Mine to Thunder Creek, focusing work on the Timmins Mine 650 Level on drilling and on accessing and expanding resources, and due to the complexity and continuity of near-surface vein systems in the ramp.
Bell Creek Mine shaft and workings dewatered, ramp accesses mine workings, advances towards Vogel
In May 2009, the Company commenced an advanced exploration program at its 100% owned Bell Creek Complex. The program involves de-watering and rehabilitating the existing Bell Creek shaft and workings and collaring a ramp at Bell Creek to connect to the contiguous Schumacher and Vogel properties in order to access known mineralization at Vogel. As of March 9, 2010, the Bell Creek shaft and workings from previous mining had been de-watered to a depth of 255 metres with the remaining 37 metres to shaft bottom being used as a sump. The ramp at Bell Creek had advanced a total of 1,200 metres, to a vertical depth of 180 metres, and had accessed mine workings at Bell Creek at the 180 metre level. The ramp had also been driven an additional 220 metres toward the Schumacher and Vogel ore zones.
5
Acquisition of Bell Creek West block of properties from Goldcorp
On December 17, 2009, the Company acquired from Goldcorp Canada Ltd. and Goldcorp Inc. (together “Goldcorp”) approximately 28 square kilometres of prospective exploration property in the surrounding vicinity of the Company’s 100% owned Bell Creek property for $15 million cash and 1.59 million shares of Lake Shore Gold. The properties, which range from a project with historic resources, the Marlhill Mine, to early stage exploration targets, are all located along the New Mine Trend, host of the Porcupine Joint Venture’s (“JV”) Hoyle Pond Mine and Pamour operations.
Exploration success in support of future production growth, value creation
Exploration success in 2009 was an important driver of growth and value creation. During the year, the Company announced results for a total of 124 drill holes, including wedge and extension holes, for a total of 58,388 metres of drilling, with encouraging results reported for the Company’s Timmins Mine project, the Thunder Creek property and the Bell Creek Complex.
At Thunder Creek, the most encouraging results were released on June 24, 2009 and included Hole TC09-68b, which intersected 12.75 gpt over 83.40 metres. Results released on August 25, 2009 included 12.17 gpt over 9.00 metres in TC09-68d with TC09-73 successfully extending the main porphyry structure, with gold mineralization, to a 1,125 metre vertical depth with potential existing for additional highgrade zones at this depth and below.
Subsequent to year end, additional drill results were released for Thunder Creek on January 26 and February 18, 2010, which both extended the mineralization at depth and down plunge and confirmed the presence of a high—grade core to the mineralization near the 650 Level. On February 18, 2010, the Company announced that Hole TM08-178f had intersected the Thunder Creek Rusk Horizon on the Timmins Mine property at a depth of 1,700 metres below surface, 700 metres below the previous deepest intercept, highlighting the potential to significantly extend the Thunder Creek mineralization at depth.
Encouraging exploration results were also reported from the Company’s 100% owned Bell Creek Complex (including the Bell Creek, Vogel and Schumacher properties) in 2009, including confirmation of a new gold system at depth and the significant potential along strike. Among results during the year were 5.13 gpt over 26.40 metres on November 5, 2009; 12.67 gpt over 14.5 metres, including 16.73 gpt over 10.00 metres on October 1, 2009; and 12.63 gpt over 11.65 metres on July 21, 2009. On January 18, 2010, new intersections were reported which expanded the large new gold system at Bell Creek to a depth below 1,300 metres down plunge and by 70 metres to the west.
Also important to the Company’s 2009 drilling program was the completion of 31,053 metres of underground drilling at the Timmins Mine. Results of 5,323 metres from this drilling on the 650 Level were released on August 24, 2009 and October 29, 2009 and confirmed previous drilling, identified high-grade lenses outside the existing resource, and indicated that the overall size and shape of the main Ultramafic Zone at Timmins Mine is similar to the existing resource model, with potential existing to add tonnes and ounces. On February 17, 2010 an additional 5,555 metres of results were released and recent modelling and estimation of indicated resources near the 650 Level using results of all diamond drill holes assayed to date shows an updated indicated resource for the Ultramafic and Upper Footwall zones in the test block area of 335,005 tonnes grading 8.07 gpt (86,969 ounces) compared to the original resource of 263,136 tonnes grading 9.30 gpt (78,710 ounces).
On February 18, 2010, results from surface drilling at Timmins Mine extended mineralization within a newly emerging fold nose by 130 metres down plunge and 100 metres to the west of previous limit for drilling on the property, suggesting significant potential exists to add new resources at Timmins Mine.
Building a balance sheet to fund the Company’s growth plans
In 2009 the Company raised gross proceeds of $153.8 million through private placements and a public offering. A total of $93.0 million of this amount was raised in the fourth quarter of 2009. Of this amount, $85.0 million was raised through a private placement transaction with Hochschild Mining Holdings Ltd. (“Hochschild”), involving the sale of 19.2 million shares at a price of $4.43 per share. An additional $8.0 million was raised through the sale of 1.4 million structured flow-through shares, representing the first tranche of a structured flow-through financing involving the issuance of approximately 2.7 million shares for gross proceeds of $15.6 million. The second tranche, for gross proceeds of $7.6 million closed on February 16, 2010.
6
Project spending in 2009, including exploration expenditures of $18.7 million, was $95.2 million (net of $6.1 million gold sales in 2009 and $2.8 million gold sales in 2010 related to 2009 mining activity, and excluding non-cash charges and changes in working capital), compared to the budget of $89.0 million. The increase over budget was due to a decision to increase exploration spending ($4.0 million), the impact of commencing advanced exploration work at Thunder Creek ($1.0 million), and the impact of the Company’s revised production profile on fixed milling costs ($1.2 million). Due to encouraging drill results at the Bell Creek Complex and Thunder Creek property as well as assuming 100% ownership on Thunder Creek, the Company increased its drilling activity during the fourth quarter spending a total of $6.8 million ($11.7 million in the first nine months of the year).
At December 31, 2009, Lake Shore Gold had cash and cash equivalents of $132.9 million excluding $4.8 million posted in letters of credit.
OUTLOOK
In 2010, Lake Shore Gold will continue to carry out advanced exploration programs at the Company’s 100% owned Timmins Mine, Thunder Creek and Bell Creek Complex properties, with plans to achieve commercial production at the Timmins Mine during the fourth quarter and to access mineralization underground at the Thunder Creek and Bell Creek projects in the second quarter.
The Company now expects to produce approximately 50,000 ounces at the Timmins Mine, with an additional 15,000 ounces expected to come from the Thunder Creek and Bell Creek advanced exploration projects. The Company anticipates ending 2010 at a monthly production rate of 10,000 ounces with further production growth throughout 2011.
The revised 2010 estimate for ounces derived from underground advanced exploration reflects a change in priorities emphasizing increased underground waste development, diamond drilling and infrastructure plans necessary to support the preparation of 43-101 compliant resource estimates at both Thunder Creek and Bell Creek. At Bell Creek, the Company confirmed the presence of a large new gold system at depth and will undertake an evaluation of the project to define the resources and design a mine plan to reflect the larger scale project including the potential to develop a new shaft to depth. The additional development and infrastructure work will position the Company to maximize and sustain annual gold production at both Thunder Creek and Bell Creek.
Gold production during 2010 will be weighted to the second half of the year as work at Timmins Mine is currently focused on drifting to Thunder Creek and completing the shaft change over. Work at Thunder Creek continues to advance on schedule with high-grade mineralization at the 295 Level expected to be intersected by the end of June 2010 and mineralization at the 680 Level expected to be reached by the end of the third quarter of 2010. Refurbishing of the Bell Creek mine workings will be completed and the ramp driven to the 400 metre level by year end, with exploration development along the main “North A” vein planned in the fourth quarter. The Company has achieved considerable exploration success at Bell Creek, which is resulting in a re-evaluation of the project to potentially become a larger—scale operation from that previously envisioned.
Exploration spending in 2010 is now expected to total $31.0 million, involving more than 250,000 metres of surface and underground drilling and an additional program for Mexican exploration. Project spending in 2010, excluding exploration, is forecasted at $115.0 million (before net proceeds from anticipated gold sales). The capital program has been reduced from $134 million as the Company undertakes a staged increase in milling capacity at Bell Creek to 2,000 tonnes per day and reducing capital at Vogel to focus on maximizing production at Bell Creek.
7
PROPERTY DEVELOPMENTS
| | Year ended | |
Project and Exploration Spending ($’000) | | December 31, 2009* | |
| | | |
Resources property and deferred exploration | | | |
Timmins Mine | | $ | 53,888 | |
Bell Creek Mill | | 11,634 | |
Bell Creek mine and exploration properties | | 22,355 | |
Thunder Creek (including advanced exploration) | | 4,501 | |
Casa Berardi net | | 1,049 | |
Other projects | | 354 | |
| | $ | 93,781 | |
Property, plant and equipment | | | |
Timmins Mine | | $ | 6,017 | |
Bell Creek Mill | | 1,220 | |
Bell Creek mine | | 3,086 | |
| | $ | 10,323 | |
Project and Exploration Spending | | $ | 104,104 | |
2009 gold sales | | $ | (6,095 | ) |
2010 gold sales, related to 2009 mining activities | | (2,813 | ) |
Net Project and Exploration Spending | | $ | 95,196 | |
* Net Project and Exploration Spending reported exclude values allocated to resource properties on acquisition of West Timmins ($563.6 million) and Bell Creek West properties ($21.9 million), noncash charges of $4.1 million for resource property and deferred exploration and net $7.1 million for property, plant and equipment and changes in working capital.
DEFERRED EXPLORATION EXPENDITURES
Exploration spending for the year ended December 31, 2009 totalled $18.7 million (representing 128,016 metres of drilling) and included $5.7 million at the Timmins Mine project, $3.5 million at Thunder Creek, $8.1 million at the Bell Creek Complex, and $1.0 million at Casa Berardi, with the remainder at other projects.
BELL CREEK MILL
The Bell Creek Mill, acquired in 2007 together with the Bell Creek Mine, was made operational in December 2008 at a capacity of 800 tonnes per day and expanded to 1,500 tonnes per day in the third quarter of 2009. Processing of low-grade material from development and advanced exploration work in the Timmins Mine ramp commenced at the Bell Creek Mill near the end of the first quarter of 2009. The Mill was initially operated in campaigns by processing development material as stockpiles were established. The Mill is now operating on a more continuous basis as deliveries from the Timmins Mine increase, both from the ramp and shaft. In addition, work to refurbish the secondary ball mill circuit at the Bell Creek Mill was completed near the end of the third quarter of 2009 which increased the Mill’s capacity to 1,500 tonnes per day. To date, the Mill has continued to operate in campaigns at approximately 800 tonnes per day with the secondary circuit expected to come on stream as production volumes increase.
Spending at the Bell Creek Mill in the year ended December 31, 2009 totalled $12.9 million (including $1.2 million on property, plant and equipment) including capitalized processing costs as well as new surface buildings, the construction of a cyanide destruction plant and other mill improvements and repairs.
8
TIMMINS MINE PROJECT
During the year ended December 31, 2009, the Company spent $53.8 million (net of $6.1 million gold sales in 2009) on the Timmins Mine project (including advanced exploration, ramp and ore development and exploration drilling expenditures as well as $6.0 million on property, plant and equipment) or $51.0 million factoring in 2010 gold sales related to 2009 mining activities.
ADVANCED EXPLORATION PROGRAM
The Company is carrying out an advanced exploration program for delineation of bulk sampling of the Footwall, Ultramafic and Main Zones of the property, along with supporting an underground diamond drilling program to both expand the currently identified probable reserve and identify new resources. During 2009 the Company’s net spending on advanced exploration at Timmins Mine totalled $22.6 million (including $3.5 million for property, plant and equipment).
Work on the Timmins Mine 650 Level at the end of 2009 included ramp development to the 630 Level, drifting to Thunder Creek, definition diamond drilling, chip and muck sampling of development faces and geologic mapping. Results from diamond drilling, sampling, mapping and development are still ongoing, but suggest that the overall trend for grades and widths of the mineralization in this area is similar to that predicted by the Resource and Reserve model that supports the most recent National Instrument 43-101 report.
In addition, recent modelling and estimation of indicated resources near the 650 Level using results of all diamond drill holes assayed to date shows an updated indicated resource for the Ultramafic and Upper Footwall zones in the test block area of 335,005 tonnes grading 8.07 gpt (86,969 ounces) compared to the original resource of 263,136 tonnes grading 9.30 gpt (78,710 ounces). The new estimation was conducted using inverse distance block modelling with application of a 95 gpt capping factor, which represents the 99th percentile of all gold assays in the zone. The increased tonnage and ounces for the new estimation is the result of using more rigorous estimation methods, reducing cutoff grades and assuming more of a bulk approach for mining of the Ultramafic Zone compared to the estimates in the latest National Instrument 43-101 report (October 2009).
SURFACE RAMP TO THE 400 LEVEL
As at December 31, 2009, the ramp reached the targeted 200 Level; as at March 9, 2009, the ramp has advanced approximately 1,600 metres to a vertical depth of 230 metres. Work in the ramp during 2009 focused on stope development and advanced exploration work to define and expose the vein systems in the vein zones. Net project spending related to the ramp during 2009 was $22.7 million (including $2.5 million for property, plant and equipment).
EXPLORATION
During 2009, a total of 40,544 metres (31,053 metres of underground drilling and 9,491 metres of surface drilling) of diamond drilling was completed. Gold mineralization at the Timmins Mine project has now been delineated to a depth of 1,330 metres below surface, with alteration, veining and mineralization within the Footwall Deposit and Ultramafic Deposit remaining open at depth. This is highlighted by deep drill intercepts including 65.65 grams per tonne gold over 4.0 metres within the Ultramafic Zone and 7.62 grams per tonne gold over 5.8 metres on the Footwall Zone from previous drilling and new intercepts announced on February 18, 2010. The most significant results from the surface drilling (6,382 metres) were from TG08-178f which intersected 8.11 gpt over 6.00 metres, including 15.92 gpt over 2.50 metres, approximately 130 metres down plunge and 100 metres to the west of the previously defined Timmins Mine mineralization at a 1,330 metre vertical depth (1,485 metres down plunge). The intersection occurs in strongly deformed mafic volcanic rocks containing ankerite-albite alyeration and 2—5% sulphides (Footwall style mineralization). TG08-178f is interpreted to have passed through the top of a newly emerging fold nose located to the north of the main or South ultramafic fold nose which controls the bulk of mineralization at the Timmins Mine, including that which is currently being drilled and developed on the 650 level. Both fold structures remain open down plunge.
BELL CREEK MINE AND VOGEL/SCHUMACHER
The Company’s project spending at the 100% owned Bell Creek Mine and contiguous Vogel and Schumacher properties for 2009 were $25.4 million, of which $17.3 million related to the Bell Creek Complex advanced exploration program (including $3.1 million for property, plant and equipment) and $8.1 million to exploration.
9
In May 2009, the Company commenced an advanced exploration program at the Bell Creek Complex following approval of the Closure Plan and the signing of an Exploration Agreement with four First Nations. The program involves de-watering and rehabilitating the existing Bell Creek shaft and workings and collaring a ramp at Bell Creek to connect to the contiguous Schumacher and Vogel properties in order to access known mineralization at Vogel. As of March 9, 2010, the Bell Creek shaft and workings from previous mining had been de-watered to a depth of 255 metres with the remaining 37 metres to shaft bottom being used as a sump. The ramp at Bell Creek had advanced a total of 1,200 metres, to a vertical depth of 180 metres, and had accessed mine workings at Bell Creek at the 180 metre level. The ramp had also been driven an additional 220 metres toward the Schumacher and Vogel ore zones.
During 2009, results for 59 holes, 18 wedge holes and 1 hole extension totalling 34,463 metres at Bell Creek Complex were announced, through which the Company was able to confirm the presence of a continuous, high-grade gold system extending to 1,250 metres down plunge. Among key intercepts announced during the year were: 5.13 gpt over 26.40 metres, including higher grade zones of 9.75 gpt over 5.60 metres on November 5, 2009; 12.67 gpt over 14.50 metres, including 16.73 gpt 10.00 metres on October 1, 2009; and 12.63 gpt over 11.65 metres on July 21, 2009.
On January 18, 2010, several significant new intersections were reported which continued to define and expand the large new gold system at Bell Creek with mineralization being extended to below 1,300 metres down plunge. Among the results were 8.99 gpt over 7.0 metres, 14.63 gpt over 1.30 metres and 7.71 gpt over 1.0 metres in BC09-53b, 21.43 gpt over 4.90 metres and 15.65 gpt over 1.50 metres in BC-09- 72, and 9.35 gpt over 5.5 metres in BC-09-71A.
THUNDER CREEK
In November 2009, following the acquisition of the 40% of Thunder Creek not already owned by Lake Shore Gold, the Company commenced an advanced exploration program on the property. The program involves drifting across to high-grade mineralization at Thunder Creek from the 200 Level and 650 Level at the Timmins Mine to facilitate development on ore grade mineralization and to support an underground drilling program. As at December 31, 2009, the Company had spent $1.0 million on advanced exploration.
As of March 9, 2010 the drift from the 200 Level at Timmins Mine had advanced approximately 560 metres (51% complete) towards Thunder Creek, while the 650 Level drift had progressed 280 metres (35% complete). The 200 Level drift is expected to reach mineralization at the 295 Level at Thunder Creek, around the location of Hole TC07-36 (24.61 gpt over 7.00 metres), by the end of June, with the 650 Level drift to access a high-grade core of mineralization, near Hole TC09-68b (12.75 gpt. over 83.40 metres), by the end of the third quarter of 2010.
The Company spent $6.1 million for exploration and advanced exploration on the property in 2009 (gross of $1.6 million recovered from West Timmins for their share of expenditures to November 6, 2009). During 2009, the Company announced results for 23 holes and 14 wedge holes totalling 26,475 metres on the property (refer to the press releases dated March 31, May 5, June 24 and August 25, 2009 and January 26, 2010 on the Company’s website at www.lsgold.com). The drilling is part of the Company’s ongoing diamond drill program commenced in August 2008.
The most encouraging results were released on June 24, 2009 and included Hole TC09-68b, which intersected 12.75 gpt over 83.40 metres. Results released on August 25, 2009 included 12.17 gpt over 9.00 metres in TC09-68d with TC09-73 successfully extending the main porphyry structure, with gold mineralization, to a 1,125 metre vertical depth with potential existing for additional high-grade zones at this depth and below.
Subsequent to year end, additional drill results were released for Thunder Creek on January 26, 2010 which both extended the mineralization at depth and down plunge and confirmed the presence of a high-grade core to the mineralization near the 650 Level, an area being targeted by development advancing from Timmins Mine. Among key intercepts were 13.45 gpt over 6.40 metres, including 64.69 gpt over 1.20 metres, in TC09-80 and 11.24 gpt over 18.35 metres, including 17.17 gpt over 10.50 metres, in TC09-69b.
On February 18, 2010, the Company announced that Hole TM08-178f had intersected the Thunder Creek Rusk Horizon on the Timmins Mine property at a depth of 1,700 metres below surface, 700 metres below the previous deepest intercept, highlighting the potential to significantly extend the Thunder Creek mineralization at depth and the fact that the two deposits may be converging at depth.
10
One drill is now active on the property, with plans to start underground drilling once the drift to Thunder Creek reach the 295 Level.
BLAKELOCK
All results have now been received for the drill program completed near Porphyry Creek portion of the property just before the end of 2008. The drilling was designed to test for expansion potential of anomalous gold assays obtained from past programs on the north side of the Casa Berardi trend. The drilling indicated a broad zone of biotite alteration surrounding granitic on the north side of the Casa Berardi Trend but mostly low grade assay values. Future plans for exploration on the property are still being reviewed.
CASA BERARDI
The Company has a 50% earn-in right on the Casa Berardi property, as provided in an agreement with Aurizon Mines Ltd. (“Aurizon”), entered into during the third quarter of 2007. The Company can earn its 50% interest by spending $5.0 million over five years. At December 31, 2008, the Company had fulfilled the earn-in expenditure commitments to the end of 2009. The Company is the operator during the earn-in period.
Lake Shore Gold has spent a total of $3.5 million on the Casa Berardi property as at December 31, 2009, of which $1.7 million were spent during 2009. Exploration expenditures in Quebec result in a 40% refundable tax credit to the Company and to date, the total amount of the Company’s eligible Quebec refundable tax credits is $1.4 million, including $0.7 million in 2009.
Work completed in the twelve months ended December 31, 2009 included drilling 6,893 metres in 16 holes. Of the 16 holes, 10 holes (3,656 metres) were completed on the east block approximately 6.0 kilometres (“kms”) east of the Casa Berardi mining operations and along the east extension of the Casa Berardi fault zone. The remaining six holes and 3,237 metres were drilled on the west extension of the Casa Berardi Fault at distances between 600 metres and 1.3 kms west of the boundary with the Casa Berardi Mine.
Significant results from the East Block included CE-09-12, drilled 280 below surface to test the east portion of the “G-Zone”), which confirmed the continuity of the structure in the previously reported “new discovery” hole CW-08-03, which intersected 8.58 gpt over 10.40 metres (see press release dated October 23, 2008). CE-09-18 was drilled 400 metres west of CE-09-12 to test an intersection of 6.84 gpt over 3.10 metres in the previously released CE-08-11. This hole returned 3.04 gpt over 6.30 metres and extended mineralization in this area to a vertical depth of 290 metres within a strike length of 500 metres.
Drilling on the West Block of claims focused on exploring a 1.0 km strike length of untested stratigraphy along the Casa Berardi Fault. CW-09-23 returned 3.44 gpt over 3.91 metres, at a vertical depth of 375 metres below surface. This new intersection is the most significant result from the limited drilling west of the Casa Berardi Mine Claim boundary and highlights the exploration potential for new discoveries along the Casa Berardi Fault trend.
The 2010 drill program will include approximately 10,700 metres of diamond drilling on both the East and West blocks and includes both summer and winter drilling. Expenditures related to the 2010 program are expected to allow the Company to earn its 50% interest in the Casa Berardi operation property before the end of 2010. The winter program started by the end of February 2010 and will include a total of approximately 6,000 metres in 23 holes designed to illustrate continuity and expand mineralization in the G Zone.
TI-PA-HAA-KAA-NING
Lake Shore Gold has a 50% interest in the Ti-pa-haa-kaa-ning project in Northwestern Ontario, with the other 50% owned by Northern Superior Resources Inc. (“Northern Superior”), a related party to the Company by virtue of certain common directors. Northern Superior is the operator of the project.
Work in 2009 included completion of an airborne magnetic survey over the southeast portion of the property, planning for a winter drill program, re-logging and sampling of selected drill core from past drilling and advancing a new NI 43-101 report.
11
RESULTS OF OPERATIONS
Year ended December 31, | | | | | |
(in $’000) | | 2009 | | 2008 | |
| | | | | |
Corporate costs | | $ | 6,886 | | $ | 5,830 | |
Consulting fees | | 362 | | 1,094 | |
General exploration | | 699 | | 830 | |
Shareholder information | | 512 | | 579 | |
Travel | | 541 | | 685 | |
Legal and accounting | | 496 | | 434 | |
Write-off of resource properties and deferred exploration | | 210 | | — | |
Depreciation of property, plant and equipment | | 249 | | 144 | |
Accretion of asset retirement obligations | | 146 | | 124 | |
Unrealized loss on investment | | — | | 32 | |
Loss before interest and other income and income taxes | | $ | (10,101 | ) | $ | (9,752 | ) |
Interest and other income, net | | 407 | | 2,220 | |
Recovery of income taxes | | 11,829 | | 2,031 | |
Net income (loss) for the period | | $ | 2,135 | | $ | (5,501 | ) |
| | | | | | | |
Net income (loss) per share — basic and diluted | | $ | 0.01 | | $ | (0.04 | ) |
The Company recorded net income of $2.1 million in 2009 compared to a net loss of $5.5 million in 2008. The net income in 2009 is due to the recovery of income taxes of $11.8 million (2008 — $2.0 million), mainly due to the reduction of substantively enacted tax rates in the fourth quarter of 2009. Excluding recovery of income taxes, 2009 loss is $9.7 million compared to $7.5 million in 2008. The higher loss in 2009 resulted mainly from increased corporate costs in support of capital programs and growth plans, lower interest income, higher depreciation and accretion expense and the write off of certain non-core projects (none in 2008). These factors were partially offset by decreased consulting fees, general exploration and shareholder information costs.
The Company reports stock-based compensation by expensing the amount on the consolidated statements of loss and deficit (allocating it to (i) corporate costs for corporate employees, (ii) consulting fees, (iii) general exploration for individuals involved in work of a general reconnaissance nature), or capitalizing the amount in resource properties and deferred exploration for individuals involved in specific projects.
The Company capitalized $0.8 million of stock-based compensation in 2009 (2008 — $0.5 million). The allocation on the consolidated statements of loss and deficit for year ended December 31, 2009 and 2008 was as follows ($’000):
Year ended December 31, | | 2009 | | 2008 | |
| | | | | |
Corporate costs | | $ | 1,506 | | $ | 1,187 | |
Consulting fees | | 172 | | 299 | |
General exploration | | 14 | | 119 | |
Total stock-based compensation | | $ | 1,692 | | $ | 1,605 | |
Stock-based compensation was determined using the Black-Scholes option pricing model. A weighted average grant-date fair value of $1.90 (2008 — $0.58) for options granted was estimated using the following assumptions: no dividends are to be paid; volatility of 69% (2008 — 62.5% to 66%); risk free interest rate of 1.63% to 2.44 % (2008 — 2.39% to 3.35%) and expected life of 3.5 years (2008 —3.5 years).
Stock-based compensation expense for the year 2009 is comparable to 2008.
12
Corporate costs in 2009 increased by $1.0 million compared to 2008 (or $0.7 million, excluding the impact of stock-based compensation expense). The increase is due mainly to increased costs in support of capital programs and growth plans initiated mid 2008 supporting the Company’s transition from an exploration company to a gold producer. The increase in corporate costs is partially offset by a decrease in consulting fees ($0.6 million decrease excluding the impact of stock-based compensation expense).
General exploration expenditures, which include expenditures of a general reconnaissance nature that are not project specific or do not result in the acquisition of resource properties, are comparable to 2008 (excluding the impact of stock-based compensation expenses).
Shareholder information costs, travel expenses and legal and accounting fees in 2009 changed by nominal amounts compared to 2008.
During 2009, the Company wrote off $0.2 million (2008 — $Nil) of its resource properties and deferred exploration, representing the carrying value of certain non core properties.
Recovery of future income taxes in 2009 increased by $9.8 million compared to 2008. The increase is due to the change in substantively enacted tax rates in mid November 2009 as well as the revaluation with the new tax rates at December 31, 2009 relating to the future tax liability of $148.4 million recorded on the acquisition of West Timmins (November 6, 2009).
SELECTED ANNUAL FINANCIAL INFORMATION
The following selected financial data has been prepared in accordance with Canadian generally accepted accounting principles and should be read in conjunction with the Company’s audited financial statements.
Year ended December 31, | | | | | |
(in $’000s except for loss per share | | | | | |
and number of shares issued and outstanding) | | 2009 | | 2008 | |
| | | | | |
Financial Results: | | | | | |
Interest and other income, net | | $ | 407 | | $ | 2,220 | |
Net Income (Loss) | | 2,135 | | (5,500 | ) |
Net Income (Loss) per share* — basic and diluted | | 0.01 | | (0.04 | ) |
Financial Position: | | | | | |
Cash and cash equivalents | | 132,920 | | 85,319 | |
Working capital | | 114,259 | | 71,423 | |
Property, plant and equipment (net of accumulated amortization) | | 28,723 | | 13,703 | |
Resource properties and deferred exploration | | 849,193 | | 172,108 | |
Total Assets | | 1,020,557 | | 279,922 | |
Long term capital lease obligations | | 5,764 | | 719 | |
Future tax liabilities | | 152,975 | | 17,381 | |
Asset retirement obligations | | 1,728 | | 1,461 | |
Share capital | | 827,795 | | 252,872 | |
Contributed surplus | | 25,940 | | 7,982 | |
Accumulated other comprehensive income | | 26 | | | |
Deficit | | (16,142 | ) | (18,277 | ) |
Number of shares issued and outstanding (000s) | | 345,295 | | 175,355 | |
| | | | | | | |
* Income (Loss) per share is calculated based on the weighted average number of shares outstanding.
13
SUMMARY OF QUARTERLY RESULTS
The following selected financial data has been prepared in accordance with Canadian generally accepted accounting principles and should be read in conjunction with the Company’s interim consolidated financial statements ($000’s, other than “per share” amounts):
| | December 31, | | September 30, | | June 30, | | March 31, | |
Fiscal quarter ended | | 2009 | | 2009 | | 2009 | | 2009 | |
| | | | | | | | | |
Interest and other income, net | | $ | 169 | | $ | 56 | | $ | 50 | | $ | 132 | |
Net income (loss) | | $ | 7,201 | | $ | (1,886 | ) | $ | (1,449 | ) | $ | (1,731 | ) |
Net income (loss) per share* – basic and diluted | | $ | 0.01 | | $ | (0.01 | ) | $ | (0.01 | ) | $ | (0.01 | ) |
| | December 31, | | September 30, | | June 30, | | March 31, | |
Fiscal quarter ended | | 2008 | | 2008 | | 2008 | | 2008 | |
| | | | | | | | | |
Interest and other income, net | | $ | 600 | | $ | 892 | | $ | 412 | | $ | 316 | |
Net income (loss) | | $ | (2,297 | ) | $ | (1,078 | ) | $ | (1,579 | ) | $ | (546 | ) |
Net income (loss) per share* – basic and diluted | | $ | (0.01 | ) | $ | (0.01 | ) | $ | (0.01 | ) | $ | (0.00 | ) |
*Net income (loss) per share is calculated based on the weighted average number of shares outstanding.
The Company recorded net income of $7.2 million in the fourth quarter of 2009 due to the recovery of income taxes of $10.2 million (same quarter in 2008 — $0.6 million), mainly due to the reduction of substantively enacted tax rates in the quarter in 2009 (as explained under “Results of Operations” on this MDA). Company’s operating expenses increased starting in the second quarter of 2008 mainly due to higher corporate and other costs in support of capital programs and growth plans as the Company transitions from an exploration company to a gold producer.
ACQUISITIONS
On November 6, 2009, Lake Shore Gold acquired all of the issued and outstanding common shares of West Timmins by issuing 104 million common shares of the Company. The outstanding West Timmins stock options and warrants were exchanged into 4.4 million options and 4.2 million warrants of Lake Shore Gold. The acquisition is accounted for as an asset acquisition under Canadian GAAP. The Lake Shore Gold shares issued were valued at $399.2 million and the options and warrants at $24.7 million. The Company incurred related transaction costs of $4.5 million.
On December 17, 2009, the Company acquired from Goldcorp the Bell Creek West properties for $15 million in cash and 1.6 million Lake Shore Gold common shares, valued at $6.6 million at closing. The Company incurred related transaction costs of $0.2 million. The PJV has obtained a 2% net smelter royalty relating to any future production from the acquired properties.
FINANCIAL CONDITION, LIQUIDITY AND CAPITAL RESOURCES
Lake Shore Gold is not in commercial production and to the end of the third quarter of 2009 did not generate cash from operations. The Company generated pre-production revenue of $6.1 million in the fourth quarter of 2009. Financing for the Company has come from raising capital through equity issues. At December 31, 2009, the Company had cash and cash equivalents of $132.9 million. Subsequent to year end, on February 16, 2010, the Company received gross proceeds of $7.6 million (second tranche of the structured flow through financing arranged at end of 2009).
Cash used in operating activities during 2009 increased to $7.6 million as compared to $4.3 million in 2008 due mainly to higher operating losses and movements in working capital. Changes in non-cash working capital items, recovery of income taxes and stock-based compensation expense make up the principal amounts that reconcile the consolidated statements of loss to the consolidated statements of cash flows from operating activities.
Exploration advances and other receivables of $3.8 million in 2009 are comparable to 2008 ($3.9 million). The increase in accounts payable and accrued liabilities ($19.4 million at December 31, 2009, compared to $17.1 million at December 31, 2008) is mainly due to the timing of payments.
Cash used in investing activities in 2009, totalled $100.3 million compared to $66.5 million in 2008. The Company’s principal investing activity is the acquisition, exploration and advanced exploration of its resource properties. During 2009, the Company incurred the majority of its resource property expenditures (including changes in working capital related to resource properties and deferred exploration at December 31,
14
2009) on advanced exploration and field equipment for the Timmins mine, advanced exploration and field equipment for the Bell Creek Mine, refurbishing work on the Bell Creek Mill, and drilling at its various exploration properties (for details, refer to the “Property Developments” section of this MD&A). Included in investing activities in 2009 are $15.2 million cash expenditures for the acquisition of Bell Creek West properties; the Company received net cash of $8.4 million from the acquisition of West Timmins Mining. The Company also spent $0.9 million for the acquisition of 6.0 million units on RT Minerals Corp. (“RT Minerals”) each unit consisting of one common share and one common share purchase warrants on RT Minerals. Subsequent to year end, on January 6, 2010, the Company acquired another 1.5 million units of RT Minerals for $0.3 million, bringing the Company’s investment in RT Minerals to 26.26% of the outstanding common shares.
On December 4, 2009, the Company completed a private placement with Hochschild Mining plc. (“Hochschild”), raising gross proceeds of $85 million through the issuance of 19.2 million shares. On November 19, 2009, the Company announced a non-brokered structured flow-through financing for the issuance of approximately 2.7 million shares for gross proceeds of $15.6 million, of which $8 million were issued as at December 31, 2009, and the remaining subsequent to year end.
On March 5, 2009, the Company completed a bought deal financing and received gross proceeds of $60.7 million.
The Company received $4.6 million from the exercise of 4.3 million options and $5.2 million from the exercise of 2.3 million warrants.
Based on its December 31, 2009 cash position of $132.9 million and the proceeds from planned gold sales in 2010, Lake Shore Gold is positioned to finance its planned expenditures in 2010. Longer term, the Company may pursue opportunities to raise additional capital through equity and/or debt markets as it progresses with its projects and properties. Management is of the opinion that additional financing is available and may be sourced in time to allow the Company to continue its planned activities in the normal course. However, there is no assurance it will be able to raise funds in the future.
CONTRACTUAL OBLIGATIONS
In addition to commitments and contractual obligations related to the Casa Berardi property (refer to discussion under “Casa Berardi” in this MD&A), the Company is required to make nominal cash payments (advanced royalty payments) to maintain its 100% interest on the Vogel property, and yearly nominal payments in 2010 to 2015 as required under the Schumacher agreement. The Company is required to make property tax payments for all Mexican properties as well as annual payments of Mexican pesos of 800 ($66) for land rights on one of its Mexican properties.
The Company has also office rent obligations, capital lease obligations and asset retirement obligations for the Bell Creek Mine and Mill and Timmins project advanced exploration as at December 31, 2009 as follows (in $’000s):
| | | | | | | | | | | | 2015 and | | | |
| | 2010 | | 2011 | | 2012 | | 2013 | | 2014 | | thereafter | | Total | |
| | | | | | | | | | | | | | | |
Office rent | | $ | 455 | | $ | 431 | | $ | 433 | | $ | 429 | | $ | 179 | | $ | 0 | | $ | 1,927 | |
Asset retirement obligations | | — | | — | | — | | — | | — | | 5,811 | | 5,811 | |
Capital leases and other | | 3,880 | | 3,006 | | 2,764 | | 1,266 | | 252 | | 1,260 | | 12,428 | |
| | $ | 4,335 | | $ | 3,437 | | $ | 3,197 | | $ | 1,695 | | $ | 432 | | $ | 7,072 | | $ | 20,166 | |
OUTSTANDING SHARE CAPITAL
As at March 9, 2010, there were 347,473,925 common shares issued and outstanding, as well as the following options and warrants:
OPTIONS:
Number of Options Outstanding | | Exercise Price Range | |
| | | |
4,082,546 | | $0.00–$0.99 | |
4,066,548 | | $1.00–$1.99 | |
874,590 | | $2.00–$2.99 | |
396,500 | | $3.00–$3.99 | |
2,524,500 | | $4.00–$5.00 | |
11,944,684 | | | |
15
WARRANTS:
Date issued | | Number of warrants | | Exercise price | | Expiry date | |
| | | | | | | |
November, 2009 | | 1,674,881 | | $ | 0.89 | | July 30, 2010 | |
November, 2009 | | 282,705 | | $ | 0.89 | | August 5, 2010 | |
November, 2009 | | 1,906,733 | | $ | 1.30 | | December 4, 2010 | |
| | 3,864,319 | | | | | |
The above warrants were transferred to Lake Shore Gold upon completion of the business combination transaction with West Timmins Mining.
CRITICAL ACCOUNTING POLICIES AND ESTIMATES
The Company’s accounting policies are discussed in Note 2 to the consolidated financial statements for the year ended December 31, 2009. Management considers the following policies to be most critical in understanding the judgments that are involved in producing the Company’s consolidated financial statements and the estimates made that could impact results of operations:
Resource Properties and Deferred Exploration
Acquisition costs of resource properties together with direct exploration and development expenditures are capitalized. When production is attained, these costs will be amortized. When capitalized expenditures on individual producing properties exceed the estimated net realizable value, the properties are written down to the estimated value. Costs relating to properties that are abandoned are written off when the decision to abandon is made. The recoverability of the amounts shown for resource properties and deferred exploration is dependent on the existence of economically recoverable reserves, the ability to obtain financing to complete the development of such reserves and meet its obligations under various agreements, and the success of future operations or dispositions.
Future Taxes
The Company accounts for income taxes using the asset and liability method. Under this method, future income taxes are recorded for the temporary differences between the financial reporting basis and tax basis of the Company’s assets and liabilities. Significant estimates include the timing of the reversal of the Company’s book to tax differences.
Stock Options and Warrants
The Company uses a Black-Scholes model to determine the fair value of options and warrants. The Black-Scholes Option Pricing Model utilizes subjective assumptions such as expected price volatility and expected life of the option. Changes in these input assumptions can significantly affect the fair value estimate.
Asset Retirement Obligations
Estimates of asset retirement obligations are the costs associated with the closure and site restoration costs for the Bell Creek Mine and Mill and Timmins project advanced exploration. These amounts are estimates of expenditures that are not due until future years. The discounted amount of changes in these estimates will be included in the respective asset with an offsetting amount accrued as asset retirement obligations.
Financial Instruments and Other Instruments
The Company’s financial instruments consist of cash and cash equivalents, exploration advances and other receivables, restricted cash, investment and accounts payable and accrued charges. It is management’s opinion that the Company is not exposed to significant interest, currency or credit risk arising from these financial instruments.
RECENT ACCOUNTING PRONOUNCEMENTS
MINING EXPLORATION COSTS
On March 27, 2009, the Canadian Institute of Chartered Accountants approved EIC 174, “Mining Exploration Costs”. The EIC provides guidance on capitalization of exploration costs related to mining properties in particular and on impairment of long-lived assets in general. The Company has applied this new abstract at the date of issuance resulting in no impact on its consolidated financial statements.
16
AMENDMENTS TO SECTION 3862, FINANCIAL INSTRUMENTS — DISCLOSURES
In July, 2009, the CICA approved amendments to Section 3862, Financial Instruments — Disclosures. The amendments require additional fair value disclosure for financial instruments and liquidity risk disclosures. These amendments require a three-level hierarchy that reflects the significance of the inputs used in making fair value assessments, as follows:
Level 1 fair value measurements are those derived from quoted prices (unadjusted) in active markets for identical assets or liabilities;
Level 2 fair value measurements are those derived from inputs other than quoted prices included within Level 1 that are observable for the asset or liability either directly (i.e., as prices) or indirectly (i.e., derived from prices);
Level 3 fair value measurements are those derived from valuation techniques that include inputs for the asset or liability that are not based on observable market data (unobservable inputs).
The Company adopted the requirements of amendments to Section 3862 on its December 31, 2009 consolidated financial statements
(note 5).
INTERNATIONAL FINANCIAL REPORTING STANDARDS
In February 2008, the Accounting Standards Board confirmed that International Financial Reporting Standards (IFRS) will replace Canadian GAAP for publicly accountable enterprises for financial periods beginning on and after January 1, 2011. The Company’s first mandatory filing under IFRS, which will be the first quarter of 2011, will contain IFRS-compliant information on a comparative basis, as well as reconciliations for that quarter and as at January 1, 2010 transition date. Although IFRS uses a conceptual framework similar to Canadian GAAP, there are significant differences in recognition, measurement and disclosure.
The Company has developed a detailed plan for IFRS convergence comprised of three related phases:
· phase 1 review and assessment, which involved a detailed review of all relevant IFRS standards to identify differences with our current accounting policies and practices; the separate consideration of one-time accounting policy alternatives that must be addressed at the changeover date (IFRS 1 considerations), and those accounting policy choices that will be applied on an ongoing basis in periods subsequent to the changeover to IFRS; the prioritization of those differences that could have a significant impact on our financial statements, business processes and IT;
· phase 2, design, which includes the evaluation of accounting policy alternatives and the investigation, development and documentation of solutions to resolve differences identified in phase 1, reflecting changes to existing accounting policies and practices, business processes, IT and internal controls;
· phase 3, implementation, which involves implementing the changes to affected accounting policies and practices, business processes, systems and internal controls. The changes will be tested prior to the formal reporting requirements under IFRS to ensure all significant differences are properly addressed in time for the changeover.
The Company is into the second phase of its conversion plan and has completed a detailed analysis of the standards, identifying a number of accounting differences and policy alternatives, including one-time accounting alternatives under IFRS. There are a number of IFRS standards in the process of being amended by the International Accounting Standards Board and are expected to continue until the transition date of January 1, 2011. The Company is actively monitoring proposed changes.
The following areas have been identified as having the highest potential impact on the Company’s financial reporting: methodology for impairment testing, future taxes, property, plant and equipment, accounting for stock compensation, disclosure and presentation and the provisions related to the initial adoption of IFRS under IFRS 1, First Time Adoption. A summary of progress in the review of areas originally identified to have the highest potential impact is as follows:
17
Impairment of Long Lived Assets
Impairment testing of long-term assets is based on a two-step approach under current Canadian GAAP, first comparing asset carrying values with undiscounted future cash flows to determine whether impairment exists, and then measuring any impairment by comparing asset carrying values with fair values. IAS 36 Impairment of Assets (“IAS 36”) uses a one-step approach testing for and measurement of impairment, with asset carrying values compared directly with the higher of fair value less costs to sell and value in use (which uses discounted future cash flows). This may potentially result in more write-down where carrying values of assets were previously supported under Canadian GAAP on an undiscounted cash flow basis, but could not be supported on a discounted cash flow basis. However, the extent of any new write-down may be partially offset by the requirement under IAS 36 to reverse any previous impairment losses where circumstances have changed such that the impairments have been reduced. Canadian GAAP prohibits reversal of impairment losses.
The Company will adopt IAS 36 requirement on transition to IFRS.
Future Income Taxes
Like Canadian GAAP, deferred income taxes under IFRS are determined using the liability method for temporary differences at the balance sheet date between the tax bases of assets and liabilities and their carrying amounts for financial reporting purposes, and by generally applying tax rates applicable to the Company to such temporary differences. Deferred income taxes relating to temporary differences that are in equity are recognized in equity and under IFRS subsequent adjustments thereto are backward traced to equity.
IFRS prohibits recognition where deferred income taxes arise from the initial recognition of an asset or liability in a transaction that is not a business combination and, at the time of the transaction, affects neither accounting nor taxable net earnings. The Company expects the impact of implementing IAS 12, Income Taxes to be material impacting the resource properties and deferred exploration and future income tax balances.
Share Based Payments — Stock Compensation
The guidance provided by IFRS 2, “Share Based Payments”, is largely consistent with Canadian GAAP and requires estimates of the fair value of stock options to be made at the date of the grant and recognition of the related expense in income as the options vest. The use of the Black-Scholes model is an acceptable method to estimate the fair value of the options at the date of grant, and is consistent with the Company’s current practice. For share options that vest in installments, IFRS 2 requires the use of the attribution method, which requires that the Company treat each installment as a separate share option grant with a different fair value. Unlike Canadian GAAP, IFRS 2 does not include the straight line method as an alternative to the attribution method for awards with a service condition and graded-vesting features. The Company will need to account for its awards using the attribution method. Currently the Company records forfeitures as they occur, however upon transition to IFRS, the Company will be required to make an estimate of the forfeiture rates for use in the determination of the total share based compensation expense. These changes will result in a difference in valuation of the stock based awards and timing differences for the recognition of compensation expenses. IFRS 2 is applicable for stock compensation expense issued on or after January 1, 2005; earlier adoption is permitted. The Company expects to recognize under IFRS 2 all share-based awards that were recognized under Canadian GAAP.
IFRS 1, First Time Adoption, allows the prospective application of IFRS 2 for options granted on or after November 7, 2002, or for grants after November 7, 2002 that vested before the later of: i. the date of transition to IFRSs; and ii. January 1, 2005. Although not expected to be significant, the Company is still in the process of assessing the application of this first time adoption option.
Property, Plant and Equipment
IAS 16 Property, plant and equipment (“IAS 16”) reinforces the requirement under Canadian GAAP that requires that each part of property, plant and equipment that has a cost that is significant in relation to the overall cost of the item should be depreciated separately. IAS 16 also provides guidance that would require major overhauls be treated as separate components of plant and equipment, with the overhaul cost capitalized and depreciated over the period to the next major overhaul.
Upon adoption of IFRS, the Company must make an accounting policy choice in how to account for fixed assets (a) upon transition to IFRS (see below discussion for IFRS 1) and (b) on a continuing basis. The Company expects to apply requirements of IAS 16 on a retroactive basis on transition for the majority of its property, plant and equipment and use the cost method on a continuing basis. The Company is in the process of identifying the impact of the noted differences on the property, plant and equipment balance.
18
IFRS 1: First-Time Adoption of IFRS — IFRS 1 provides the framework for the first-time adoption of IFRS and specifies that an entity shall apply the principles under IFRS retrospectively. Certain optional exemptions and mandatory exceptions to retrospective application are provided under IFRS. For the Company the material exemptions relate primarily to the restatement of prior business combinations, asset retirement obligations, deemed cost for the property, plant and equipment and stock based compensation expense.
The Company has not fully analyzed and concluded on IFRS 1, but has made tentative conclusions on some items. The Company expects not to restate business combinations executed prior to January 1, 2010 and not to restate asset retirement obligations incurred prior to January 1, 2010; the Company also expects to utilize the exemption related to stock based compensation expense (see above under “Shared Based Payments”). The Company has not yet determined whether to revalue any of its property, plant and equipment. If any assets are revalued, there will be a related effect on depreciation expense.
IFRS 1 allows for certain other optional exemptions; however, the Company does not expect such exemptions to be significant to the Company’s adoption of IFRS.
Resource Properties and Deferred Exploration Expenditures
Similar to Canadian GAAP, IFRS allows the choice of capitalizing or expensing exploration costs; the Company’s policy under Canadian GAAP has been to capitalize all exploration expenditures; the Company expects to follow the same accounting policy under IFRS.
Different from Canadian GAAP, IFRS does not allow the capitalization of expenditures incurred prior to obtaining the exploration license. The Company is in the process of identifying any such costs capitalized; costs identified will be recorded in the opening deficit on transition.
IFRS only provides guidance up to the point that technical feasibility and commercial viability of extracting a resource is demonstrated, the exploration and evaluation phase. Apart from the difference identified above, IFRS is in line with Canadian GAAP for the accounting for the accounting for this phase but expenditures beyond this phase must be considered with the capitalization criteria for property, plant and equipment (PP&E) and/or Intangible assets. The Company’s initial assessment indicates that our resource property expenditures beyond the exploration and evaluation phase meet the recognition criteria in relation to property, plant and equipment and no material impact on the adoption of IFRS is expected.
Decommissioning Liabilities — Asset Retirement Obligations (“AROs”)
Canadian GAAP includes specific guidance with respect to asset retirement obligations whereas under IFRS asset retirement obligations are included under IAS 37 “Provisions, Contingent Liabilities and Contingent Assets”. IFRS requires the use of the current market-based discount rate to be applied to the liability at each reporting date rather than the historical rate used when the liability was initially set-up. IFRS requires ARO to be determined based on best estimate for the most likely outcome. This is slightly different from Canadian GAAP which requires ARO to be fair value using third-party market assumptions. We do not expect that either of these impacts will be material.
The Company will apply the standard prospectively (using IFRS 1 exemption).
Flow Through Commons Shares
The Company is also evaluating the impact of IFRS on its accounting for flow through shares and expects to identify differences in this regard.
As the review of accounting policies is completed, appropriate changes to ensure the integrity of internal control over financial reporting and disclosure controls and procedures will be made, including changes in controls or procedures to address reporting of first time adoption and opening balances under IFRS.
The Company is also working on implementing changes to its financial information systems and processes to enable it to maintain data required to report its 2010 financial information under IFRS for comparative purposes.
The Company has conducted initial training sessions targeted to various levels of the organization. Additionally, the Company will also continue to provide training to other key employees and will monitor the impacts on its business processes and information systems, and will develop a broader external communication plan. The Company’s transition plans are on schedule and further updates on the status of key activities for this project will be provided in the Company’s 2010 interim Management’s Discussion and Analysis.
19
RELATED PARTY TRANSACTIONS
The following are related party transactions for the years ended December 31, 2009 and 2008:
No fees were paid during 2009 (2008 — $0.6 million) on account of consulting and management services provided by directors. The fees paid in 2008 included $0.5 million paid to a director as finder fees related to the Hochschild equity transactions and have been recorded as share issue costs.
In 2009, the Company charged $0.1 million (2008 — $0.1 million) to Northern Superior. The charges were for certain corporate governance, finance, investor relations and accounting and administrative services the Company provided to Northern Superior under an administrative service agreement entered into in June 2008 and terminated on April 30, 2009.
During the year ended December 31, 2009, Northern Superior, the joint venture operator for the Ti-pa-haa-kaa-ning property, charged the Company $0.2 million (2008 — $4.0 million), for the Company’s share for the property expenditures. As at December 31, 2009, there is net amount of $0.1 million (2008 — $0.8 million) due to Northern Superior, of which $0.1 million is included in accounts payable (2008 — $1.1 million) and $Nil in exploration advances and other receivable (2008 — $0.3 million).
Related party transactions are measured at the exchange amount which is the consideration agreed to between the parties.
RISKS AND UNCERTAINTIES
The most significant risks and uncertainties faced by the Company are: the inherent risk associated with mineral exploration and development activities; the uncertainty of mineral resources and their development into mineable reserves; the uncertainty as to potential project delays from circumstances beyond the Company’s control; and the timing of production; as well as title risks, risks associated with joint venture agreements and the possible failure to obtain mining licenses.
For a detailed description of Risks and Uncertainties refer to the Company’s Annual Information Form for the year ended December 31, 2009.
CORPORATE GOVERNANCE
The Company’s Board of Directors follows widely accepted corporate governance guidelines for public companies to ensure transparency and accountability to shareholders.
The Audit Committee of the Company fulfills its role of ensuring the integrity of the reported information through its review of the interim and audited annual financial statements prior to their submission to the Board of Directors for approval. The Audit Committee, comprised of three independent directors, meets with management and the external auditors of the Company on a quarterly basis to review the financial statements, including the MD&A, and to discuss other financial, operating and internal control matters. The Company has also adopted the practice of engaging its external auditors to perform quarterly reviews of its interim financial statements.
CONTROLS AND PROCEDURES
In accordance with the requirements of National Instrument 52-109 Certification of Disclosure in Issuer’s Annual and Interim Filings, the Company’s management, including the Chief Executive Officer (CEO) and Chief Financial Officer (CFO), have evaluated the operating effectiveness of the Company’s internal control over financial reporting. Management of the Company is responsible for establishing and maintaining adequate internal control over financial reporting. Internal control over financial reporting is a process designed by, or under the supervision of, the CEO and CFO and effected by management and other personnel to provide reasonable assurance regarding the reliability of financial reporting and the preparation of financial statements for external purposes in accordance with generally accepted accounting principles. Management assessed the effectiveness of the Company’s internal control over financial reporting as of December 31, 2009. Based on this assessment, management believes that, as of December 31, 2009, the Company’s internal control over financial reporting is operating effectively. Management determined that there were no material weaknesses in the Company’s internal control over financial reporting as of December 31, 2009.
20
Disclosure controls and procedures are designed to provide reasonable assurance that all relevant information is gathered and reported to senior management, including the CEO and CFO, on a timely basis so that appropriate decisions can be made regarding annual and interim financial statement disclosure. An evaluation of the effectiveness of the design and operation of disclosure controls and procedures was conducted as of December 31, 2009, by the Company’s management, including the CEO and CFO. Based on this evaluation, the CEO and CFO have concluded that the Company’s disclosure controls and procedures as defined in National Instrument 52-109, Certification of Disclosure in Issuers’ Annual and Interim Filings, are effective.
FORWARD-LOOKING STATEMENTS
All statements, other than statements of historical fact, contained or incorporated by reference in this MD&A including, but not limited to, any information as to the future financial or operating performance of Lake Shore Gold Corp., constitute “forward-looking information” or “forward-looking statements” within the meaning of certain securities laws, including the provisions of the Securities Act (Ontario) and the provisions for “safe harbour” under the United States Private Securities Litigation Reform Act of 1995, and are based on expectations, estimates and projections as of the date of this MD&A or, in the case of documents incorporated by reference herein, as of the date of such documents. Forward-looking statements are provided for the purpose of providing information about management’s expectations and plans relating to the future. All of the forward-looking statements made in this MD&A are qualified by these cautionary statements and those made in our other filings with the securities regulators of Canada.
Other than as specifically required by law, the Company does not intend, and does not assume any obligation, to explain any material difference between subsequent actual events and such forward-looking statements, or to update any forward-looking statement to reflect events or circumstances after the date on which such statement is made or to reflect the occurrence of unanticipated events, whether as a result of new information, future events or results or otherwise. These forward-looking statements represent management’s best judgment based on facts and assumptions that management considers reasonable, including that: there are no significant disruptions affecting operations, whether due to labour disruptions, supply disruptions, power disruptions, damage to equipment or otherwise; permitting, development, operations, expansion and acquisitions at the Timmins Gold Complex continue on a basis consistent with the Company’s current expectations; permitting, development and operations at the Bell Creek Complex continue on a basis consistent with the Company’s current expectations; the exchange rate between the Canadian dollar and the U.S. dollar stays approximately consistent with current levels; certain price assumptions for gold and silver hold true; prices for fuel, electricity and other key supplies remains consistent with current levels; production and cost of sales forecasts meet expectations; the accuracy of the Company’s current mineral reserve and mineral resource estimates hold true; and labour and materials costs increase on a basis consistent with the Company’s current expectations. The Company makes no representation that reasonable business people in possession of the same information would reach the same conclusions.
Forward-looking statements include, but are not limited to, possible events, statements with respect to possible events, statements with respect to the future price of gold and other metals, the estimation of mineral resources and reserves, the realization of mineral reserve and resource estimates, the timing and amount of estimated future production, costs of production, expected capital expenditures, costs and timing of the development of new deposits, success of exploration and development activities, permitting time lines, currency fluctuations, requirements for additional capital, government regulation of exploration and mining operations, environmental risks, unanticipated reclamation expenses, title disputes or claims, completion of acquisitions and their potential impact on the Company and its operations, limitations on insurance coverage and the timing and possible outcome of pending litigation. In certain cases, forward-looking statements can be identified by the use of words such as “plans”, “expects” or “does not expect”, “is expected”, “budget”, “scheduled”, “estimates”, “forecasts”, “intends”, “anticipates” or “does not anticipate”, or “believes”, or variations of such words and phrases or statements that certain actions, events or results “may”, “could”, “would”, “might” or “will be taken”, “occur” or “be achieved”.
21
Forward-looking statements involve known and unknown risks, uncertainties and other factors which may cause the actual results, performance or achievements of the Company to be materially different from any future results, performance or achievements expressed or implied by the forward-looking statements. As well as those factors discussed in the section entitled “Risk Factors” in this MD&A and the Company’s most recently filed AIF, known and unknown risks which could cause actual results to differ materially from projections in forward-looking statements include, among others: fluctuations in the currency markets; fluctuations in the spot and forward price of gold or certain other commodities (such as diesel fuel and electricity); changes in interest rates; changes in national and local government legislation, taxation, controls, regulations and political or economic developments in Canada and Mexico or other countries in which the Company may carry on business in the future; business opportunities that may be presented to, or pursued by, the Company; the Company’s ability to successfully integrate acquisitions; operating or technical difficulties in connection with mining or development activities; employee relations; the speculative nature of gold exploration and development, including the risks of obtaining necessary licenses and permits; diminishing quantities or grades of reserves; and contests over title to properties, particularly title to undeveloped properties. In addition, there are risks and hazards associated with the business of gold exploration, development and mining, including environmental hazards, industrial accidents, unusual or unexpected formations, pressures, cave-ins, flooding and gold bullion losses (and the risk of inadequate insurance, or the inability to obtain insurance, to cover these risks).
Although the Company has attempted to identify important factors (which it believes are reasonable) that could cause actual actions, events or results to differ materially from those described in forward-looking statements, there may be other factors that cause actions, events or results not to be as anticipated, estimated or intended. There can be no assurance that forward-looking statements will prove to be accurate, as actual results and future events could differ materially from those anticipated in such statements. Accordingly, readers should not place undue reliance on forward-looking statements.
QUALITY CONTROL
Lake Shore Gold has a quality control program to ensure best practices in the sampling and analysis of drill core. Routine assays have been completed using a standard fire assay with a 30-gram aliquot. For samples that return a value greater than three grams per tonne gold, another pulp is taken and fire assayed with a gravimetric finish. Zones with visible gold are typically tested by pulp metallic analysis. NQ size drill core is saw cut and half the drill core is sampled in standard intervals. The remaining half of the core is stored in a secure location. The drill core is transported in security-sealed bags for preparation at ALS Chemex Prep Lab located in Timmins, Ontario, and the pulps shipped to ALS Chemex Assay Laboratory in Vancouver, B.C. ALS Chemex is an ISO 9001-2000 registered laboratory preparing for ISO 17025 certification.
QUALIFIED PERSON
The Company’s Qualified Persons (“QPs”) (as defined in National Instrument 43-101, “Standards of Disclosure for Mineral Projects”) for diamond drilling projects at the Timmins Mine surface and Thunder Creek properties; Bell Creek, Schumacher and Vogel properties; and Casa Berardi optioned property are Jacques Samson, P.Geo., Pat Pope P.Geo., Richard Labine, P.Geo., Stephen Conquer, P.Geo., and Don Boucher, P.Geo., respectively. Heather Miree, P.Geo. and Stephen Conquer, P.Geo. are the QPs for the Timmins Mine underground drilling project, Pat Pope, P.Geo. is the QP for surface drilling for the Timmins Mine project, and Bob Kusins, P.Geo. is the QP for resource estimation at all of the Company’s properties. As QPs, Messrs. Samson, Labine, Conquer, Boucher, Pope and Kusins and Ms. Miree have prepared or supervised the preparation of the scientific or technical information for their respective properties as reviewed in this MD&A.
ADDITIONAL INFORMATION
Additional information relating to the Company is provided in the Company’s audited consolidated financial statements for the year ended December 31, 2009, its Annual Information Form for the year ended December 31, 2009, and its most recently filed Information Circular. These and other documents relating to the Company are available on SEDAR at www.sedar.com.
22
LAKE SHORE GOLD CORP.
CONSOLIDATED FINANCIAL STATEMENTS
(As of December 31, 2009 and 2008)
24 | Auditors’ Report | |
| | |
25 | Consolidated Balance Sheets | |
| | |
26 | Consolidated Statements of Income (Loss) and Deficit | |
| | |
26 | Consolidated Statements of Comprehensive Income (Loss) | |
| | |
27 | Consolidated Statements of Cash Flows | |
| | |
28 | NOTES TO THE CONSOLIDATED FINANCIAL STATEMENTS | |
AUDITORS’ REPORT
To the Shareholders of Lake Shore Gold Corp.
We have audited the consolidated balance sheets of Lake Shore Gold Corp. as at December 31, 2009 and 2008 and the consolidated statements of income (loss) and deficit, comprehensive income (loss) and cash flows for the years then ended. These consolidated financial statements are the responsibility of the Company’s management. Our responsibility is to express an opinion on these consolidated financial statements based on our audits.
We conducted our audits in accordance with Canadian generally accepted auditing standards. Those standards require that we plan and perform an audit to obtain reasonable assurance whether the financial statements are free of material misstatement. An audit includes examining, on a test basis, evidence supporting the amounts and disclosures in the financial statements. An audit also includes assessing the accounting principles used and significant estimates made by management as well as evaluating the overall financial statement presentation.
In our opinion, these consolidated financial statements present fairly, in all material respects, the financial position of the Company as at December 31, 2009 and 2008 and the results of its operations and its cash flows for the years then ended in accordance with Canadian generally accepted accounting principles

CHARTERED ACCOUNTANTS
LICENSED PUBLIC ACCOUNTANTS
Toronto, Ontario
March 9, 2010
24
CONSOLIDATED BALANCE SHEETS
(in thousands of dollars)
As at December 31, | | 2009 | | 2008 | |
ASSETS | | | | | |
Current | | | | | |
Cash and cash equivalents | | $ | 132,920 | | $ | 85,319 | |
Exploration advances and other receivables | | 3,810 | | 3,888 | |
| | 136,730 | | 89,207 | |
Investments notes 5 and 6 | | 1,145 | | 3 | |
Restricted cash note 7 | | 4,766 | | 4,901 | |
Property, plant and equipment (net of accumulated amortization) note 9 | | 28,723 | | 13,703 | |
Resource properties and deferred exploration note 10 | | 849,193 | | 172,108 | |
| | $ | 1,020,557 | | $ | 279,922 | |
LIABILITIES | | | | | |
Current | | | | | |
Accounts payable and accrued liabilities | | $ | 19,352 | | $ | 17,113 | |
Current portion of capital lease obligations note 11 | | 3,119 | | 671 | |
| | 22,471 | | 17,784 | |
Capital lease obligations note 11 | | 5,764 | | 719 | |
Asset retirement obligations note 13 | | 1,728 | | 1,461 | |
Future income tax liabilities note 15 | | 152,975 | | 17,381 | |
| | 160,467 | | 19,561 | |
SHAREHOLDERS’ EQUITY | | | | | |
Share capital note 12(b) | | 827,795 | | 252,872 | |
Contributed surplus note 12(f) | | 25,940 | | 7,982 | |
Accumulated other comprehensive income note 12(g) | | 26 | | 0 | |
Deficit | | (16,142 | ) | (18,277 | ) |
| | (16,116 | ) | (18,277 | ) |
| | 837,619 | | 242,577 | |
| | $ | 1,020,557 | | $ | 279,922 | |
Commitments and contingencies notes 10 and 17
Subsequent events notes 6, 10 and 12
See accompanying notes to consolidated financial statements
Approved by the Board
/s/ Alan C. Moon | | /s/ Arnold Klassen |
| | |
| | |
ALAN C. MOON | | ARNOLD KLASSEN |
Director | | Director |
25
CONSOLIDATED STATEMENTS OF INCOME (LOSS) AND DEFICIT
(in thousands of dollars)
For the year ended December 31, | | 2009 | | 2008 | |
Expenses | | | | | |
Corporate costs note 12(d) | | $ | 6,886 | | $ | 5,830 | |
Consulting fees notes 12(d) and 14 | | 362 | | 1,094 | |
General exploration note 12(d) | | 699 | | 830 | |
Shareholder information | | 512 | | 579 | |
Legal and accounting | | 496 | | 434 | |
Unrealized loss on investment | | — | | 32 | |
Write-off of resource properties and deferred exploration | | 210 | | — | |
Depreciation of property, plant and equipment | | 249 | | 144 | |
Accretion of asset retirement obligations note 13 | | 146 | | 124 | |
Travel | | 541 | | 685 | |
Loss before the undernoted | | (10,101 | ) | (9,752 | ) |
Interest expense | | (70 | ) | (184 | ) |
Interest and other income | | 477 | | 2,404 | |
Loss before income taxes | | (9,694 | ) | (7,532 | ) |
Recovery of income taxes note 15 | | 11,829 | | 2,031 | |
Net income (loss) for the year | | $ | 2,135 | | $ | (5,501 | ) |
Deficit, beginning of year | | $ | (18,277 | ) | $ | (12,776 | ) |
Deficit, end of year | | $ | (16,142 | ) | $ | (18,277 | ) |
Net income (loss) per share — basic and diluted note 12(h) | | $ | 0.01 | | $ | (0.04 | ) |
Basic weighted-average number of shares outstanding (000s) | | 224,278 | | 155,797 | |
Diluted weighted-average number of shares outstanding (000s) | | 229,753 | | 155,797 | |
CONSOLIDATED STATEMENTS OF COMPREHENSIVE INCOME (LOSS)
(in thousands of dollars)
For the year ended December 31, | | 2009 | | 2008 | |
Net income (loss) for the year | | $ | 2,135 | | $ | (5,501 | ) |
Other comprehensive income (net of tax) | | 26 | | 6 | |
Comprehensive income (loss) for the year | | $ | 2,161 | | $ | (5,495 | ) |
See accompanying notes to consolidated financial statements
26
CONSOLIDATED STATEMENTS OF CASH FLOWS
(in thousands of dollars)
For the year ended December 31, | | 2009 | | 2008 | |
OPERATING ACTIVITIES | | | | | |
Net income (loss) for the year | | $ | 2,135 | | $ | (5,501 | ) |
Recovery of future income taxes | | (11,829 | ) | (2,031 | ) |
Stock-based compensation note 12(d) | | 1,692 | | 1,605 | |
Unrealized loss on investment | | — | | 32 | |
Write-off of resource properties and deferred exploration | | 210 | | — | |
Depreciation | | 249 | | 144 | |
Accretion of asset retirement obligations note 13 | | 146 | | 124 | |
| | (7,397 | ) | (5,628 | ) |
Change in non-cash operating working capital items: | | | | | |
Decrease in exploration advances and other receivables | | 897 | | 115 | |
(Decrease) increase in accounts payable and accrued liabilities | | (1,118 | ) | 1,249 | |
Cash used in operating activities | | (7,618 | ) | (4,263 | ) |
INVESTING ACTIVITIES | | | | | |
Restricted cash | | 135 | | (1,121 | ) |
Net cash on acquisition of West Timmins Mining Inc. | | 8,386 | | — | |
Acquisition of Bell Creek West properties note 10 | | (15,183 | ) | — | |
Investment note 6 | | (900 | ) | — | |
Additions to property, plant and equipment | | (7,486 | ) | (11,295 | ) |
Resource properties and deferred exploration expenditures (net of pre-production revenue) | | (85,221 | ) | (54,097 | ) |
Cash used in investing activities | | (100,269 | ) | (66,513 | ) |
FINANCING ACTIVITIES | | | | | |
Proceeds from private placements/public offerings (net of share issue costs) | | 149,104 | | 143,346 | |
Exercise of stock options and warrants | | 9,757 | | 1,095 | |
Payment of capital lease obligations | | (3,373 | ) | (260 | ) |
Cash provided by financing activities | | 155,488 | | 144,180 | |
Increase in cash during the year | | 47,601 | | 73,404 | |
Cash and cash equivalents at beginning of year | | 85,319 | | 11,915 | |
Cash and cash equivalents at end of year | | $ | 132,920 | | $ | 85,319 | |
Supplemental cash flow information note 16
See accompanying notes to consolidated financial statements
27
LAKE SHORE GOLD CORP.
NOTES TO THE CONSOLIDATED FINANCIAL STATEMENTS
FOR THE YEARS ENDED DECEMBER 31, 2009 AND 2008
(in thousands of dollars, except as the per share amounts)
1. DESCRIPTION OF BUSINESS
Lake Shore Gold Corp. (“Lake Shore Gold” or the “Company”) is engaged in the exploration and development of gold properties in Northern Ontario and Quebec. The Company has identified economically recoverable reserves on one of its properties and has not determined whether the other exploration properties contain mineral reserves that are economically recoverable. The recoverability of the amount shown for resource properties and deferred exploration is dependent upon the discovery of economically recoverable reserves on the other exploration properties and on attaining future profitable production from its advanced exploration property.
The Company believes it has sufficient funds to finance its current operating, development and exploration expenditures. Longer term, the Company may pursue opportunities to raise additional capital through equity and/or debt markets as it progresses with its projects and properties. Management is of the opinion that additional financing is available and may be sourced in time to allow the Company to continue its planned activities in the normal course. However, there is no assurance it will be able to raise funds in the future.
2. SIGNIFICANT ACCOUNTING POLICIES
These financial statements have been prepared in accordance with Canadian generally accepted accounting principles (“Canadian GAAP”) and reflect the following policies:
a) Basis of Consolidation
The consolidated financial statements include all the accounts of the Company and its wholly-owned subsidiaries. On November 6, 2009, the Company acquired all of the shares of West Timmins Mining Inc. (“West Timmins”, note 8), and West Timmins and its wholly-owned Mexican subsidiary became wholly-owned subsidiaries of Lake Shore Gold. All intercompany balances and transactions have been eliminated upon consolidation.
The Company participates in unincorporated joint ventures which are not variable interest entities. The Company proportionately consolidates its interest in these unincorporated joint ventures.
b) Financial Instruments
The Company classifies all financial instruments as either held-to-maturity, available-for-sale, held-for-trading, loans and receivables or other financial liabilities. Items held-to-maturity, loans and receivables and other financial liabilities are measured at amortized cost. Available-for-sale instruments are measured at fair value with unrealized gains and losses recognized in other comprehensive income (loss). Instruments classified as held-for-trading are measured at fair value with unrealized gains and losses recognized on the statement of income (loss) and deficit.
The Company has designated its cash and cash equivalents as held-for-trading, which are measured at fair value. Exploration advances and other receivables are classified as loans and receivable and are measured at amortized cost. Accounts payable and accrued liabilities are classified as other financial liabilities and are measured at amortized cost. The Company has classified its investments in certain public companies (note 5) as available-for-sale and therefore carries them at fair market value, with the unrealized gain or loss recorded in shareholders’ equity as a component of accumulated other comprehensive income (loss). These amounts will be reclassified from shareholders’ equity to net income (loss) when the investments are sold or when the investments are impaired and the impairment is considered less than temporary. The Company has not classified any financial assets as held-to-maturity.
c) Cash and Cash Equivalents
Cash and cash equivalents includes those short-term money market instruments which, on acquisition, have a term to maturity of three months or less.
d) Property, Plant and Equipment
Property, plant and equipment are recorded at cost and include assets of a capital nature that are currently used and amortized. Property, plant and equipment are amortized on a straight-line basis over the asset’s useful life.
28
NOTES TO THE CONSOLIDATED FINANCIAL STATEMENTS
FOR THE YEARS ENDED DECEMBER 31, 2009 AND 2008
(in thousands of dollars, except as the per share amounts)
Depreciation rates for each class of asset are as follows:
Office equipment | | 20% |
Computer equipment | | 30% |
Mining and milling equipment | | 3–10 years |
e) Resource Properties and Deferred Exploration
Resource properties and related exploration and development costs are recorded at cost on a property-by-property basis.
The Company considers its exploration and evaluation costs to have the characteristics of property, plant and equipment. As such, the Company defers all exploration and evaluation costs, including acquisition costs, field exploration and field supervisory costs relating to specific properties, until those properties are brought into production, at which time, they will be amortized on a unit-of-production basis, or until the properties are abandoned, sold or considered to be impaired in value, at which time, an appropriate charge will be made. Costs incurred for general exploration, including expenditures of a general reconnaissance nature, that are not project specific or do not result in the acquisition of resource properties are charged to operations.
Property, plant and equipment currently not in use are recorded as resource properties and deferred exploration until those properties are brought into commercial production, at which time they will be reclassified in property, plant and equipment and amortized over the life of the mine on a unit-of-production basis, except where the life of the asset is less than the life of the mine, in which case depreciation will be recorded on a straight-line basis over its useful life, or until the properties are abandoned, sold or considered to be impaired in value, at which time, an appropriate charge will be made.
Long-lived assets, including resource properties and deferred exploration, are reviewed for impairment whenever events or changes in circumstances indicate that the carrying amount of an asset may not be recoverable. Recoverability of assets is measured by a comparison of the carrying amount of an asset to estimated undiscounted future cash flows expected to be generated by the asset, whenever the future cash flows to be generated by the asset can be estimated. If the carrying amount of an asset exceeds its estimated future cash flows, an impairment charge is recognized by the amount by which the carrying amount of the asset exceeds the fair value of the asset. For resource properties for which the Company has not established mineral reserves, and therefore does not have a basis to prepare cash flow projections to support the carrying amount of these properties, other factors such as gold prices, the ability of the Company to finance the projects and exploration results to date, are considered in determining whether a write down is required.
f) Future Income Taxes
The Company uses the asset and liability method in accounting for income taxes. Under this method of tax allocation, future income tax assets and liabilities are determined based on differences between the financial statement carrying values and their respective income tax basis (temporary differences). Future income tax assets and liabilities are measured using the substantively enacted tax rates expected to be in effect when the temporary differences are likely to reverse. The effect on future income tax assets and liabilities of a change in tax rates is included in income in the year in which the change is enacted or substantively enacted. The amount of future income tax assets recognized is limited to the amount that is more likely than not to be realized.
g) Asset Retirement Obligations
Asset retirement obligations consist of legal obligations associated with the retirement of tangible, long-lived assets that result from the acquisition, construction, development or operation of the assets. The retirement of a long-lived asset is its permanent removal from service, sale, abandonment or disposal.
Asset retirement obligations are recognized as they are incurred and recorded as liabilities at fair value.
29
NOTES TO THE CONSOLIDATED FINANCIAL STATEMENTS
FOR THE YEARS ENDED DECEMBER 31, 2009 AND 2008
(in thousands of dollars, except as the per share amounts)
The liability is accreted over time through periodic charges to income. Actual expenditures incurred are charged against the accumulated obligation. The asset retirement cost is capitalized as part of the related asset’s carrying value and depreciated over the asset’s useful life.
h) Comprehensive Income (Loss)
Comprehensive income (loss) comprises the Company’s net income (loss) and other comprehensive income (loss). Other comprehensive income (loss) includes unrealized gains and losses on financial assets classified as available-for-sale, net of income taxes. The components of the comprehensive income (loss) are disclosed on the consolidated statements of comprehensive income (loss).
i) Stock-based Compensation
The Company has a stock-based compensation plan which is described in note 12 (c).
The stock-based compensation cost is based on the estimated fair value of new options granted to employees, consultants, officers and directors. The fair value of each stock option granted is estimated on the date of the grant using the Black-Scholes option-pricing model and is expensed over the vesting period. The stock-based compensation cost is recognized as an expense on the consolidated statements of loss and deficit or capitalized on resource properties and deferred exploration (options granted to individuals involved on specific projects).
j) Basic and Diluted Income (Loss) per Share
Basic income (loss) per share is computed by dividing net income (loss) by the weighted average number of outstanding common shares for the period. In computing diluted earnings per share, an adjustment is made for the dilutive effect of the exercise of stock options and warrants using the treasury stock method. In periods where a net loss is reported, all outstanding options and warrants are excluded from the calculation of diluted loss per share, as they are anti-dilutive.
Measurement Uncertainty
The preparation of financial statements in conformity with Canadian generally accepted accounting principles (“GAAP”) requires management to make estimates and assumptions that affect the reported amounts of assets and liabilities, disclosure of contingent assets and liabilities at the date of the financial statements, and the reported amounts of expenses during the reporting periods. Significant estimates where management’s judgment is applied include asset valuations, asset retirement obligations, income taxes, stock-based compensation and ability to continue as a going concern. Actual results may differ from those estimates.
k) Defined Contribution Pension Plan
The Company has a defined contribution pension plan which covers all the Company’s employees. Under the plan provisions, the Company contributes a fixed percentage of the employees’ salary to the pension plan. The employees are able to direct the contributions into a variety of investment funds offered by the plan. Pension costs associated with the Company’s required contributions under the plan are recognized as incurred and charged to the consolidated statements of loss and deficit or capitalized on resource properties and deferred exploration for employees involved in the specific projects.
m) Foreign Currency Translation
The Company’s Mexican subsidiary is an integrated foreign operation and is translated into Canadian dollars using the temporal method. Monetary items are translated at the exchange rate at in effect at the balance sheet date and non-monetary items are translated at the historical exchange rate. Income and expenses items are translated at rates approximating those in effect at the time of the transaction. Translation gains and losses are reflected in the income (loss) for the year.
30
NOTES TO THE CONSOLIDATED FINANCIAL STATEMENTS
FOR THE YEARS ENDED DECEMBER 31, 2009 AND 2008
(in thousands of dollars, except as the per share amounts)
3. CHANGES IN ACCOUNTING POLICIES AND RECENT ACCOUNTING PRONOUNCEMENTS
A. CHANGES IN ACCOUNTING POLICIES
Mining exploration costs
On March 27, 2009, the Canadian Institute of Chartered Accountants (“CICA”) approved EIC 174, “Mining Exploration Costs”. The EIC provides guidance on capitalization of exploration costs related to mining properties in particular and on impairment of long-lived assets in general. The Company has applied this new abstract at the date of issuance resulting in no impact on its consolidated financial statements.
Amendments to Section 3862, Financial Instruments — Disclosures
In July, 2009, the CICA approved amendments to Section 3862, Financial Instruments — Disclosures. The amendments require additional fair value disclosure for financial instruments and liquidity risk disclosures. These amendments require a three-level hierarchy that reflects the significance of the inputs used in making fair value assessments, as follows:
Level 1 fair value measurements are those derived from quoted prices (unadjusted) in active markets for identical assets or liabilities;
Level 2 fair value measurements are those derived from inputs other than quoted prices included within Level 1 that are observable for the asset or liability either directly (i.e. as prices) or indirectly (i.e. derived from prices);
Level 3 fair value measurements are those derived from valuation techniques that include inputs for the asset or liability that are not based on observable market data (unobservable inputs).
The Company adopted the requirements of amendments to Section 3862 in its December 31, 2009 consolidated financial statements (note 5).
B. RECENT ACCOUNTING PRONOUNCEMENTS
Convergence with International Financial Reporting Standards
In February 2008, the Accounting Standards Board confirmed that International Financial Reporting Standards (IFRS) will replace Canadian GAAP for publicly accountable enterprises for financial periods beginning on and after January 1, 2011. The Company’s first mandatory filing under IFRS, which will be the first quarter of 2011, will contain IFRS-compliant information on a comparative basis, as well as reconciliations for that quarter and as at January 1, 2010 transition date. Although IFRS uses a conceptual framework similar to Canadian GAAP, there are significant differences in recognition, measurement and disclosure. The Company has developed a plan for IFRS convergence and has started the implementation process. Detailed analysis of the differences between IFRS and the Company’s accounting policies and assessment of the various alternatives for first time adoption of IFRS are in progress. Training for key employees has begun and will continue throughout the implementation. Due to anticipated changes in IFRS prior to transition, it is currently not possible to fully determine the impact on the consolidated results.
Business Combinations / Consolidated Financial Statements / Non — Controlling Interests
In January 2009, the CICA adopted Sections 1582, “Business Combinations”, 1601, “Consolidated Financial Statements”, and 1602, “Non-Controlling Interests” which superseded current Sections 1581, “Business Combinations” and 1600, “Consolidated Financial Statements”. These sections will be applied prospectively to business combinations for which the acquisition date is on or after the beginning of the first annual reporting period beginning on or after January 1, 2011. Earlier adoption is permitted. If an entity applies these sections before January 1, 2011, it is required to disclose that fact and apply each of the new sections concurrently. These new sections were created to converge Canadian GAAP to IFRS.
31
NOTES TO THE CONSOLIDATED FINANCIAL STATEMENTS
FOR THE YEARS ENDED DECEMBER 31, 2009 AND 2008
(in thousands of dollars, except as the per share amounts)
4. CAPITAL MANAGEMENT
The Company manages its capital structure and makes adjustments to it to effectively support the acquisition, exploration and development of mineral properties. In the definition of capital, the Company includes, as disclosed on its consolidated balance sheet: share capital, deficit, contributed surplus and cash and cash equivalents.
The Company believes it has sufficient funds to finance its current operating, development and exploration expenditures. Longer term, the Company may pursue opportunities to raise additional capital through equity and/or debt markets as it progresses with its projects and properties. The Company will continue to assess new properties and seek to acquire an interest in additional properties if it feels there is sufficient geologic or economic potential and if it has adequate financial resources to do so.
Management reviews its capital management approach on an ongoing basis and believes that this approach, given the relative size of the Company, is reasonable.
There were no changes in the Company’s approach to capital management during the year ended December 31, 2009. Neither the Company nor its subsidiaries are subject to externally imposed capital requirements and do not have exposure to asset-backed commercial paper or similar products.
5. FINANCIAL INSTRUMENTS AND FINANCIAL RISK MANAGEMENT
FINANCIAL INSTRUMENTS
The carrying values of the financial assets and liabilities at December 31, 2009 and 2008 are as follows:
As at December 31, | | 2009 | | 2008 | |
Financial Assets | | | | | |
Held-for-trading, measured at fair value* | | | | | |
Cash and cash equivalents | | $ | 132,920 | | $ | 85,319 | |
Restricted cash | | 4,766 | | 4,901 | |
| | $ | 137,686 | | $ | 90,220 | |
Loans and receivable, measured at amortized cost | | | | | |
Exploration advances and other receivables | | $ | 3,810 | | $ | 3,888 | |
Available-for-sale, measured at fair value | | | | | |
Investments in public companies | | 245 | | 3 | |
Financial Liabilities | | | | | |
Other liabilities, measured at amortized cost | | | | | |
Accounts payable and accrued liabilities | | $ | 19,352 | | $ | 17,113 | |
* The above were designated as held for trading upon initial recognition.
32
NOTES TO THE CONSOLIDATED FINANCIAL STATEMENTS
FOR THE YEARS ENDED DECEMBER 31, 2009 AND 2008
(in thousands of dollars, except as the per share amounts)
FAIR VALUES
The fair values of cash and cash equivalents, restricted cash, exploration advances and other receivables and accounts payable and accrued liabilities approximate their carrying values due to the short-term to maturity of these financial instruments.
The fair value hierarchy of financial instruments measured at fair value on the balance sheet is as follows:
| | 2009 | | 2008 | |
As at December 31, | | Level 1 | | Level 1 | |
| | | | | |
Cash and cash equivalents | | $ | 132,920 | | $ | 85,319 | |
Investments in public listed companies | | 245 | | 3 | |
| | | | | | | |
The Company does not have Level 2 or Level 3 inputs (note 3).
The Company holds investments in four public companies; with the exception of the investment in Northern Superior Resources Inc. (“Northern Superior”), the Company acquired the other investments with the acquisition of West Timmins (note 8).
RISK MANAGEMENT POLICIES
The Company is sensitive to changes in commodity prices, foreign exchange and interest rates. The Company’s Board of Directors has overall responsibility for the establishment and oversight of the risk management framework. Currently the Company has not entered into any options, forward and future contracts to manage its price-related exposures. Similarly, derivative financial instruments are not used to reduce these financial risks.
The Company’s risk exposures and the impact on the Company’s financial instruments are summarized below:
Credit Risk
The Company’s credit risk is primarily attributable to exploration advances and receivables, which consist of goods and services tax due from the Federal Government of Canada and refundable tax credits for resources due from the Government of Quebec. The Company has no significant concentration of credit risk arising from operations. Management believes that the credit risk concentration with respect to financial instruments included in other assets is remote.
Liquidity Risk
The Company’s approach to managing liquidity risk is to ensure that it will have sufficient liquidity to meet liabilities when due. As at December 31, 2009, the Company has a cash and cash equivalents balance of $132,920 (December 31, 2008 — $85,319) to settle current liabilities of $22,471 (December 31, 2008 — $17,784). All of the Company’s financial liabilities are subject to normal trade terms.
33
NOTES TO THE CONSOLIDATED FINANCIAL STATEMENTS
FOR THE YEARS ENDED DECEMBER 31, 2009 AND 2008
(in thousands of dollars, except as the per share amounts)
Market Risk
a. Interest rate risk
The Company has significant cash balances and no debt. The Company’s current policy is to invest excess cash in very low risk investments with banking institutions. The Company periodically monitors the investments it makes and is satisfied with the credit ratings of its banks and investments.
The Company’s excess cash at December 31, 2009, is invested in very liquid and low risk accounts in A rated Canadian Banks, direct obligations or fully guaranteed obligations of AAA rated Canadian provinces and Government of Canada Treasury Bills. The Company is exposed to short term interest rates through the interest earned on cash and Treasury Bill’s balances. A 1% change in short term rates would change the interest income and net loss of the Company, assuming that all other variables remain constant, by approximately $416 in 2010 (2009 — $597).
b. Price risk
The Company is exposed to price risk with respect to future gold prices which impacts the future economic feasibility of its resource properties.
c. Foreign currency exchange risk
The Company is exposed to foreign currency exchange risk with respect to future gold sales, since gold sales will be denominated in United States Dollars (US$) and the Company’s functional currency is Canadian dollar. The movements on US$ rates may impact the future economic feasibility of the Company’s exploration properties.
6. INVESTMENT IN RT MINERALS INC.
On December 31, 2009, the Company acquired 6,000,000 units (“Units”), consisting of one common share and one common share purchase warrants on RT Minerals Corp. (“RT Minerals”) for $900. Subsequent to year end, on January 6, 2009, the Company acquired another 1,500,000 Units of RT Minerals for $300 bringing the Company’s investment in RT Minerals to 26.26% of the outstanding common shares. The Company’s share on the net book value of RT Minerals at the date of acquisition is $394 (“NBV”); the difference between amount paid of $900 and NBV of RT Minerals at date of acquisition will be allocated to the resource property balances.
In connection with the above transactions, on December 31, 2009, Lake Shore Gold and RT Minerals entered into a Strategic Alliance Agreement, which provides the Company with certain rights, including a right to participate pro rata in any future equity financings by RT Minerals, a right to appoint two members of the board of directors of RT Minerals, a right of first refusal in the event RT Minerals seeks to sell or joint venture any of its properties, and an option to acquire a 50% interest in RT Minerals’ Golden Property. The Golden Property covers approximately 6.4 kilometres along the western extension of the Destor-Porcupine fault system and is contiguous to Lake Shore Gold’s Timmins West Gold Complex.
The investment is accounted for under the equity method of accounting whereby the investment is initially recorded at cost and the carrying value will be adjusted thereafter to include the Company’s pro rata share of post-acquisition earnings (losses) of RT Minerals, computed by the consolidation method. The amount of the adjustment will be included in the determination of net income (losses) of the Company, and the investment carrying amount will change to reflect the Company’s share of capital transactions (including amounts recognized in other comprehensive income (loss) and changes in accounting policies and corrections of errors relating to prior period financial statements applicable to post-acquisition periods.
34
NOTES TO THE CONSOLIDATED FINANCIAL STATEMENTS
FOR THE YEARS ENDED DECEMBER 31, 2009 AND 2008
(in thousands of dollars, except as the per share amounts)
7. RESTRICTED CASH
Restricted cash includes secured funds for letters of credit issued by the Company in favour of the Ontario Ministry of Northern Development, Mines and Forestry as security for the Company’s obligations under the Closure Plans submitted for various properties ($4,137) and other letters of credit issued under various agreements ($629). These funds are restricted and not available for current operations.
8. ACQUISITION OF WEST TIMMINS MINING INC.
On November 6, 2009 (“the acquisition date”), Lake Shore Gold acquired all of the issued and outstanding common shares of West Timmins Mining Inc. (“West Timmins”) by issuing 103,951,125 common shares of the Company (each West Timmins common share outstanding on November 6, 2009 was exchanged for 0.73 of a Lake Shore Gold common share). The outstanding West Timmins stock options and warrants were exchanged into 4,370,179 options and 4,180,085 warrants of Lake Shore Gold, at the same exchange ratio of 0.73.
The acquisition is accounted for as an asset acquisition under Canadian GAAP. The Lake Shore Gold shares issued were valued at $399,172 and the options and warrants at $13,128 and $11,591 respectively. The Company incurred related transaction costs of $4,499 and share issue costs of $170. At the time of acquisition, West Timmins Mining held 25,000 shares of Lake Shore Gold, valued at $95.
The fair value of stock options and warrants was determined using the Black-Scholes option pricing model. A weighted average grant-date fair value of $3.00 and $2.95, respectively for options and warrants granted was estimated using the following assumptions: no dividends are to be paid; volatility of 71% to 85% and 81% to 83%, respectively for options and warrants; risk free interest rate of 1.3% to 2.42% and 1.31%, respectively for options and warrants and expected life of 0.6 to 3.2 years and of 0.73 to 1.1 years, respectively for options and warrants. The fair value computed using the Black-Scholes model is only an estimate of the potential value of the individual warrants and the Company is not required to make payments for such transactions.
The consideration paid by the Company has been allocated on a preliminary basis to assets and liabilities acquired as follows:
| | Total | |
Cash | | $ | 13,056 | |
Investments in public listed companies | | 218 | |
Property, plant and equipment | | 44 | |
Resource properties and deferred exploration | | 563,596 | |
Working capital | | (219 | ) |
Treasury shares | | 95 | |
Future tax liabilities | | (148,400 | ) |
Purchase price | | $ | 428,390 | |
Consideration: | | | |
Common shares | | $ | 399,172 | |
Options and warrants | | $ | 24,719 | |
Cash | | 4,499 | |
Total purchase price consideration | | $ | 428,390 | |
35
NOTES TO THE CONSOLIDATED FINANCIAL STATEMENTS
FOR THE YEARS ENDED DECEMBER 31, 2009 AND 2008
(in thousands of dollars, except as the per share amounts)
The preliminary allocation of the purchase price was based on information available at December 31, 2009. The allocation of the purchase price has not been finalized and is subject to adjustments, which can be material. The Company has to November 6, 2010 to finalize the purchase price allocation.
The transaction resulted in the Company acquiring 100% ownership of the Thunder Creek property (note 10), an interest in several other exploration properties in the proximity of Thunder Creek and interest in several properties in Mexico. The Canadian properties were preliminarily valued at $447,582 (including future tax liability of $115,636) and the 100% owned Mexican properties at $117,014 (including future tax liability of $32,764).
9. PROPERTY, PLANT AND EQUIPMENT
The details of property, plant and equipment at December 31, 2009 are as follows:
| | | | Accumulated | | Net | |
| | Cost | | Amortization | | Book Value | |
Office equipment | | $ | 213 | | $ | 78 | | $ | 135 | |
Computer equipment | | 1,271 | | 436 | | 835 | |
Mining and milling equipment | | 31,072 | | 3,319 | | 27,753 | |
| | $ | 32,556 | | $ | 3,833 | | $ | 28,723 | |
At December 31, 2008:
| | | | Accumulated | | Net | |
| | Cost | | Amortization | | Book Value | |
Office equipment | | $ | 218 | | $ | 40 | | $ | 178 | |
Computer equipment | | 779 | | 170 | | 609 | |
Mining and milling equipment | | 13,585 | | 669 | | 12,916 | |
| | $ | 14,582 | | $ | 879 | | $ | 13,703 | |
Mining and milling equipment at December 31, 2009, includes cost of $12,174 (December 31, 2008 — $1,733) and accumulated amortization of $1,059 (December 31, 2008 — $128) of capital equipment and vehicles under capital lease (note 11).
The amortization of equipment used in the exploration activities is capitalized in resource properties and deferred exploration ($2,705 for the year ended December 31, 2009; $664 for the year ended December 31, 2008).
36
NOTES TO THE CONSOLIDATED FINANCIAL STATEMENTS
FOR THE YEARS ENDED DECEMBER 31, 2009 AND 2008
(in thousands of dollars, except as the per share amounts)
10. RESOURCE PROPERTIES AND DEFERRED EXPLORATION
For the year ended December 31, 2009:
| | | | | | Thunder Creek | | | | | | | | | |
| | | | | | & acquired | | | | | | | | | |
| | Timmins | | | | West Timmins | | | | | | | | | |
| | Mine | | Bell Creek | | Canadian | | Casa | | | | Mexican | | | |
| | Project | | Properties | | Properties | | Berardi | | Other(1) | | Properties | | Total | |
Balance, beginning of year | | $ | 123,062 | | $ | 32,887 | | $ | 3,375 | | $ | 1,041 | | $ | 11,743 | | — | | $ | 172,108 | |
Property acquisition, assessment and maintenance | | 304 | | 22,216 | | 446,592 | | 51 | | 5 | | 117,022 | | 586,190 | |
Bell Creek mill | | — | | 12,120 | | — | | — | | — | | — | | 12,120 | |
Analytical | | 808 | | 323 | | 251 | | 52 | | 24 | | — | | 1,458 | |
Geology | | 110 | | 296 | | 127 | | 2 | | 156 | | — | | 691 | |
Drilling | | 4,476 | | 6,674 | | 2,709 | | 884 | | 57 | | — | | 14,800 | |
Project administration | | 48 | | 512 | | 350 | | 61 | | 112 | | — | | 1,083 | |
Write off of resource properties | | — | | — | | — | | — | | (210 | ) | — | | (210 | ) |
Advanced exploration | | 51,334 | | 14,667 | | 1,047 | | — | | — | | — | | 67,048 | |
Pre-production revenue | | (6,095 | ) | — | | — | | — | | — | | — | | (6,095 | ) |
Balance, end of year | | $ | 174,047 | | $ | 89,695 | | $ | 454,451 | | $ | 2,091 | | $ | 11,887 | | $ | 117,022 | | $ | 849,193 | |
| | | | | | | | | | | | | | | | | | | | | | |
(1) Includes Ti-pa-haa-kaa-ning $4,687; Blakelock $3,616; Abitibi $1,644; Bazooka $942; Miscellaneous $998.
For the year ended December 31, 2008:
| | Timmins | | Bell | | | | | | | | | |
| | Mine | | Creek | | Thunder | | Casa | | | | | |
| | Project | | Properties | | Creek | | Berardi | | Other(1) | | Total | |
Balance, beginning of year | | $ | 82,079 | | $ | 19,088 | | $ | 2,413 | | $ | 48 | | $ | 5,414 | | $ | 109,042 | |
Property acquisition, assessment and maintenance | | — | | 118 | | 9 | | 4 | | 336 | | 467 | |
Bell Creek mine and mill | | — | | 9,009 | | — | | — | | — | | 9,009 | |
Analytical | | 88 | | 25 | | 34 | | 61 | | 289 | | 497 | |
Geology | | 237 | | 319 | | 119 | | 262 | | 781 | | 1,718 | |
Drilling | | 1,688 | | 4,076 | | 749 | | 640 | | 3,988 | | 11,141 | |
Project administration | | 318 | | 252 | | 51 | | 26 | | 935 | | 1,582 | |
Advanced exploration | | 38,652 | | — | | — | | — | | — | | 38,652 | |
Balance, end of year | | $ | 123,062 | | $ | 32,887 | | $ | 3,375 | | $ | 1,041 | | $ | 11,743 | | $ | 172,108 | |
(1) Includes Ti-pa-haa-kaa-ning $4,480; Blakelock $3,523; Abitibi $1,644; Bazooka $942; Miscellaneous $1,155.
37
NOTES TO THE CONSOLIDATED FINANCIAL STATEMENTS
FOR THE YEARS ENDED DECEMBER 31, 2009 AND 2008
(in thousands of dollars, except as the per share amounts)
Timmins Mine Project
Lake Shore Gold owns 100% of the Timmins Mine project, of which one of the claims (which does not contain any portion of the current reserves or resources on the Timmins Mine project) is subject to a 1.5% net smelter returns royalty, which the Company can purchase for $1,000. The Company is carrying out an advanced exploration program on the Timmins Mine project and realized $6,095 of pre-production revenue from the gold sales in 2009 (2008 — $Nil).
On July 18, 2008, the Company signed an Exploration Agreement with the Flying Post First Nation and Mattagami First Nation (“the First Nation communities”) in order to promote a cooperative and mutually respectful relationship between the communities and Lake Shore Gold as the Company moves forward with exploration and advanced exploration work on the Timmins Mine project and Thunder Creek property. The agreement establishes a framework for ongoing dialogue and consultation, including providing business, employment and training opportunities for members of the two First Nation communities. During the year ended December 31, 2008, Lake Shore Gold issued 100,000 common shares of the Company, valued at $118, to the First Nation communities.
Bell Creek Properties
Bell Creek Properties include the Bell Creek mine and mill, the newly acquired Bell Creek West properties and Vogel and Schumacher properties with values as at December 31, 2009 and 2008 as follows:
Property | | 2009 | | 2008 | |
Mill | | $ | 31,085 | | $ | 18,964 | |
Mine | | 5,446 | | 2,003 | |
Bell Creek advanced exploration | | 11,225 | | — | |
Exploration properties (including acquired Bell Creek West properties) | | 41,939 | | 11,920 | |
Bell Creek properties | | $ | 89,695 | | $ | 32,887 | |
On December 17, 2009, the Company acquired from Goldcorp Canada Ltd., manager of the Porcupine Gold Mines Joint Venture (“PJV”), and Goldcorp Inc. approximately 28 square kilometres of prospective exploration property (the “Bell Creek West” properties) in the surrounding vicinity of the Company’s 100% owned Bell Creek Mine and Mill. The properties, which range from a project with historic resources, the Marlhill Mine, to early stage exploration targets, are all located along the New Mine Trend, host of the PJV’s Hoyle Pond Mine and Pamour operations.
Consideration for the transaction included $15,000 of cash and 1,596,023 Lake Shore Gold common shares, valued at $6,523. The Company incurred related transaction costs of $194; as part of the agreement the Company assumed environmental liabilities for clean up and remediation on the properties acquired estimated at $197. The PJV has retained a 2% net smelter royalty relating to any future production from the acquired properties, which are divided into five blocks; the Company has the right to buy back 1% of the net smelter royalty on four of the five blocks of properties for $2,500 for each block.
38
NOTES TO THE CONSOLIDATED FINANCIAL STATEMENTS
FOR THE YEARS ENDED DECEMBER 31, 2009 AND 2008
(in thousands of dollars, except as the per share amounts)
The consideration paid by the Company has been allocated to the assets and liabilities acquired as follows:
| | Total | |
Resource properties and deferred exploration | | $ | 21,906 | |
Asset retirement obligations | | (197 | ) |
Purchase price | | $ | 21,709 | |
Consideration: | | | |
Cash | | $ | 15,000 | |
Common shares, net of share issue costs | | 6,515 | |
Acquisition costs | | 194 | |
Total purchase price consideration | | $ | 21,709 | |
In March 2005, the Company acquired 100% of a mining lease on the Vogel property, located in the Timmins Gold Camp, Ontario. The Vogel property consists of one patented “Vet Lot” covering 64 hectares and lies between the Hoyle Pond and Bell Creek gold properties. The property is subject to a maximum 3% net smelter royalty with annual advance royalty payments of US$50. A cash payment of $500 will be payable once an indicated resource (as defined by NI 43-101) of 600,000 ounces of gold or more is confirmed on the property.
In December 2005, the Company signed a twenty year lease agreement to acquire the Schumacher property (the “Schumacher agreement”) located contiguous to and west of Lake Shore Gold’s Vogel property. The agreement can be extended, at the request of Lake Shore for as many 20-year terms, as Lake Shore Gold considers necessary to completely exploit all potential resources from the property. The property is subject to a 2% net smelter royalty with advanced annual royalty payments of $25 in years 4—6 and $50 thereafter.
On March 10, 2009, the Company signed an Exploration Agreement with the Flying Post First Nation, Mattagami First Nation, Matachewan and Wahgoshig First Nations (“the Bell Creek First Nation communities”) in order to promote a cooperative and mutually respectful relationship between the communities and Lake Shore Gold as the Company moves forward with exploration and advanced exploration work on the Bell Creek, Vogel and Shumaker properties. The agreement establishes a framework for ongoing dialogue and consultation, including providing business, employment and training opportunities for members of the two First Nation communities. During the year ended December 31, 2009, Lake Shore Gold issued a total of 40,000 common shares of the Company, valued at $114, to the Bell Creek First Nation communities.
Thunder Creek and West Timmins acquired Canadian Properties
As of November 6, 2009, the Thunder Creek property is 100% owned by Lake Shore Gold (subsequent to the acquisition of West Timmins Mining by the Company, note 8). Previously the Company had a 60% interest (with West Timmins Mining holding the remaining 40%); the Company was the operator with all work funded on a 60/40 pro-rata basis. Portions of the property are subject to either a 2% or a 3% net smelter royalty with an annual pre-production royalty payment of $5 adjusted annually for Canadian Price Index.
Through the acquisition of West Timmins, the Company also acquired approximately 120 square kilometres of additional exploration property in close proximity to Thunder Creek and the Company’s Timmins mine, including 100% ownership on the Thorne and Highway 144 properties and 51% to 55% on various other properties (“Other properties”). Certain of the Other properties are subject to net smelter royalties between 2% and 3%. On certain of the Other properties, the Company is required to make cash payments of $1,000 or issue 146,000 Lake Shore Gold common shares upon commencement of commercial production.
39
NOTES TO THE CONSOLIDATED FINANCIAL STATEMENTS
FOR THE YEARS ENDED DECEMBER 31, 2009 AND 2008
(in thousands of dollars, except as the per share amounts)
On August 23, 2009, West Timmins had entered into an agreement with Explorers Alliance Corporation and certain other third parties (together the “Vendors”) to acquire the remaining non-owned 49% interest in the Allerston properties and 100% interest in certain other properties by issuing shares and warrants of West Timmins (none issued as at the acquisition date). On January 22, 2010, the Company and the Vendors entered into a Revival and Amending Agreement (the “Agreement”), whereby the Company agreed to acquire the properties as per the original agreement and acquire some additional exploration interests by issuing 1,058,850 common shares of the Company and 513,000 common share purchase warrants; the warrants will expire 18 months from the closing date of the transaction and will be exercisable as follows: 75,000 at $4.75 per share and 438,000 at $3.70 per common share.
Casa Berardi
On September 6, 2007, the Company entered into an option joint venture agreement with Aurizon Mines Ltd. (“Aurizon”) to acquire a 50% interest in Aurizon’s large land position surrounding its Casa Berardi mine (‘the Casa Berardi property”). Under the terms of the agreement, Lake Shore Gold has a 50% earn-in right in the Casa Berardi property by incurring exploration expenditures of $5,000 over a five-year period ($600 in the first year, $1,000 in the next three years and $1,400 in the fifth year). Lake Shore Gold is the operator during the earn-in period. If an indicated mineral resource of at least 500,000 ounces of gold at a minimum grade of 6.0 grams of gold per tonne (or economic equivalent thereof) is established, the area containing the resource plus a one kilometre radius surrounding the outer perimeter of the resource may be transferred to a specific property joint venture, in which Aurizon and Lake Shore Gold will each have a 50% interest. Aurizon will then have the right to earn an additional 10% interest in the specific property by funding the costs of a feasibility study. As at December 31, 2009, the Company has spent a total of $3,479 on the Casa Berardi property (gross of estimated Quebec refundable tax credits of $1,388).
Other
During the year ended December 31, 2009, the Company wrote off exploration costs of $210 (2008 - $Nil) relating to various non-core projects in Ontario.
West Timmins acquired Mexican Properties
The West Timmins transaction also provided the Company with 100% ownership of a large land position in Mexico, including the polymetallic Montaña de Oro project, high-grade Lluvia de Oro gold-silver project, Universo gold project as well as other properties. A portion of the The Montaña de Oro property is subject to a 1% net smelter royalty. The Company is required to make annual payments of Mexican pesos 800 ($66) for land rights on one of the Mexican properties.
11. CAPITAL LEASE OBLIGATIONS
The Company has entered into equipment and vehicle leases expiring between 2010 and 2013 with interest rates between 3.35% to 8.5%. Estimated minimum annual lease payments at December 31, 2009 and 2008 are as follows:
| | December 31, 2009 | | December 31, 2008 | |
2009 | | $ | 0 | | $ | 776 | |
2010 | | 3,628 | | 537 | |
2011 | | 2,754 | | 116 | |
2012 | | 2,512 | | 115 | |
2013 | | 1,073 | | — | |
Total minimum lease payments | | $ | 9,967 | | $ | 1,544 | |
Less: Amount representing interest | | (1,084 | ) | (154 | ) |
Present value of capital lease obligations | | $ | 8,883 | | $ | 1,390 | |
Less: Current portion | | (3,119 | ) | (671 | ) |
Non-current portion | | $ | 5,764 | | $ | 719 | |
40
NOTES TO THE CONSOLIDATED FINANCIAL STATEMENTS
FOR THE YEARS ENDED DECEMBER 31, 2009 AND 2008
(in thousands of dollars, except as the per share amounts)
12. SHARE CAPITAL
a) Authorized unlimited common shares without par value.
b) During the years ended December 31, 2009 and 2008, changes in issued share capital were as follows:
| | Year ended December 31, 2009 | | Year ended December 31, 2008 | |
Issued and outstanding | | Shares | | Amount | | Shares | | Amount | |
Balance, beginning of year | | 175,354,885 | | $ | 252,872 | | 112,684,675 | | $ | 112,071 | |
Public offering, net of share issue costs of $2,692* | | 37,232,056 | | 57,995 | | — | | — | |
Private placements, net of share issue costs of $671* (2008 — $647*) | | 20,553,929 | | 92,329 | | 61,339,210 | | 143,643 | |
Issued on acquisition of West Timmins Mining note 8, net of share issue costs of $128* | | 103,951,125 | | 399,045 | | — | | — | |
Treasury shares note 8 | | (25,000 | ) | (95 | ) | — | | — | |
Exercise of options (including transfer of $7,792 (2008 — $670) from contributed surplus) | | 4,308,792 | | 12,389 | | 1,231,000 | | 1,765 | |
Exercise of warrants (including transfer of $1,473 (2008 — $Nil) from contributed surplus) | | 2,282,916 | | 6,632 | | — | | — | |
Renunciation of flow-through shares | | — | | — | | — | | (4,725 | ) |
Issued as part of resource properties agreements, net of share issue costs of $3* (2008 — $2*), note 9 | | 1,636,023 | | 6,628 | | 100,000 | | 118 | |
Balance, end of year | | 345,294,726 | | $ | 827,795 | | 175,354,885 | | $ | 252,872 | |
* Share issue costs includes $1,266 (2008 — $297) adjustment for recovery of income tax.
Public offering
On March 5, 2009, the Company completed a bought-deal financing pursuant to an underwriting agreement between the Company and a syndicate of Banks led by Scotia Capital Inc. (collectively, the “underwriters”). The Company raised gross proceeds of $60,687 through the issuance of 30,615,871 common shares of the Company at a price of $1.55 per common share and 6,616,185 flow-through common shares (“flow through shares”) at $2.00 per flow through share. The underwriters received a cash commission equal to 5% of gross proceeds. The Company has until December 31, 2010 to spend the money raised by issuing flow through shares on Canadian exploration expenditures (“CEE”).
Private placements
On December 4, 2009, the Company completed a private placement with Hochschild Mining plc. (“Hochschild”), a related party in 2009, raising gross proceeds of $85,000 through the issuance of 19,187,359 shares. At December 31, 2009, Hochschild’s shareholding in the Company on a fully diluted basis is 36%. On December 29, 2009 the Company raised gross proceeds of $8,000 from the issuance of 1,366,570 flow-through shares, representing the first tranche of a non-brokered structured flow-through financing announced on November 19, 2009. Subsequent to year end, on February 16, 2010, the Company issued 1,273,036 shares (“second tranche”) for gross proceeds of $7,614, bringing the total gross proceeds from the transaction to $15,614. The Company has until December 31, 2010 and 2011 respectively to spend the money raised by issuing flow through shares respectively in the first and second tranche on CEE.
41
NOTES TO THE CONSOLIDATED FINANCIAL STATEMENTS
FOR THE YEARS ENDED DECEMBER 31, 2009 AND 2008
(in thousands of dollars, except as the per share amounts)
On June 17, 2008, the Company completed a private placement transaction with Hochschild, involving the sale to Hochschild of 33,166,908 common shares of Lake Shore Gold at a price of $2.40 per share, for proceeds of $79,601. The transaction follows an initial private placement with Hochschild, completed on February 25, 2008, whereby Lake Shore Gold issued 28,172,302 common shares of the Company at $2.30 per share for a total consideration of $64,689. Hochschild has agreed to a standstill with Lake Shore Gold, limiting its shareholdings to no more than 40%, on a fully diluted basis, until November 22, 2010.
c) Stock Options
As at December 31, 2009, the Company had 12,993,720 options outstanding of which 7,219,214 are exercisable. Under the Company’s stock option plan, options may not be granted for a term exceeding ten years and the minimum exercise price cannot be less than the volume weighted average closing price of the Company’s common shares on the Toronto Stock Exchange, for the five trading days day preceding the grant of the option. All options granted to date have been for a term of five years. The maximum number of options issuable by the Company is 10% of the issued and outstanding common shares. The Board of Directors determines the vesting terms of the options which vary between grants, from vesting half on grant date and half in the first anniversary of the grant date to vesting in three equal amounts in a three year period from the grant date.
A summary of the changes in the Company’s incentive share option plan for the years ended December 31, 2009 and 2008 are as follows:
| | | | December 31, 2009 | | | | December 31, 2008 | |
| | Number of | | Weighted-average | | Number of | | Weighted-average | |
| | options | | Exercise price | | options | | exercise price | |
Outstanding, beginning of year | | 10,380,000 | | $ | 1.37 | | 6,380,000 | | $ | 1.48 | |
Granted | | 3,244,500 | | $ | 3.73 | | 6,720,000 | | $ | 1.26 | |
Issued in connection with the acquisition of West Timmins Mining note 8 | | 4,370,179 | | $ | 0.96 | | — | | — | |
Exercised | | (4,308,792 | ) | $ | 1.07 | | (1,231,000 | ) | $ | 0.89 | |
Forfeited | | (692,167 | ) | $ | 1.66 | | (1,489,000 | ) | $ | 1.74 | |
Outstanding, end of year | | 12,993,720 | | $ | 1.90 | | 10,380,000 | | $ | 1.37 | |
Exercisable, end of year | | 7,219,214 | | $ | 1.42 | | 2,981,648 | | $ | 1.48 | |
The following table summarizes information regarding stock options outstanding and exercisable at December 31, 2009:
Exercise | | Number of | | Weighted-average | | | | Number of | | | |
Price | | options | | remaining years of | | Weighted-average | | options | | Weighted-average | |
Range | | outstanding | | contractual life | | exercise price | | exercisable | | exercise price | |
$ 0.00—$0.99 | | 4,675,046 | | 3.1 | | $ | 0.76 | | 2,668,378 | | $ | 0.72 | |
$ 1.00—$1.99 | | 4,510,084 | | 3.1 | | $ | 1.67 | | 3,566,746 | | $ | 1.74 | |
$ 2.00—$2.99 | | 947,590 | | 2.6 | | $ | 2.11 | | 947,590 | | $ | 2.11 | |
$ 3.00—$3.99 | | 396,500 | | 4.6 | | $ | 3.66 | | 36,500 | | $ | 3.42 | |
$ 4.00—$5.00 | | 2,464,500 | | 4.9 | | $ | 4.13 | | — | | $ | — | |
| | 12,993,720 | | | | | | 7,219,214 | | | |
d) Stock-Based Compensation
Stock-based compensation recognized is allocated to consulting fees (options granted to consultants), general exploration (options granted to individuals involved in exploration work of a general reconnaissance nature), corporate costs (options granted to directors and corporate employees) and capitalized as part of resource properties and deferred exploration (options granted to individuals involved on the specific projects included in resource properties and deferred exploration). The Company capitalized $812 of stock based compensation during 2009 (2008— $473).
42
NOTES TO THE CONSOLIDATED FINANCIAL STATEMENTS
FOR THE YEARS ENDED DECEMBER 31, 2009 AND 2008
(in thousands of dollars, except as the per share amounts)
The allocation on the consolidated statement of income (loss) and deficit for the years ended December 31, 2009 and 2008 was as follows:
Year ended December 31, | | 2009 | | 2008 | |
Corporate costs | | $ | 1,506 | | $ | 1,187 | |
Consulting fees | | 172 | | 299 | |
General exploration | | 14 | | 119 | |
Total stock-based compensation | | $ | 1,692 | | $ | 1,605 | |
Stock-based compensation was determined using the Black-Scholes option pricing model. A weighted average grant-date fair value of $1.90 (2008 — $0.58) for options granted was estimated using the following assumptions: no dividends are to be paid; volatility of 69% (2008 — 62.5% to 66%); risk free interest rate of 1.63% to 2.44 % (2008 — 2.39% to 3.35%) and expected life of 3.5 years (2008 — 3.5 years)
The fair value computed using the Black-Scholes model is only an estimate of the potential value of the individual stock options and the Company is not required to make payments for such transactions.
e) Warrants
As at December 31, 2009 and 2008, the following warrants are outstanding:
December 31, 2009 | | December 31, 2008 | |
Date issued | | Number of
warrants | | Exercise
price | | Expiry date | | Date issued | | Number of
warrants | | Exercise
price | | Expiry date | |
November 6, 2009 | | 1,707,731 | | $ | 0.89 | | July 30, 2010 | | December 17, 2007 | | 2,000,000 | | $ | 2.40 | | December 17, 2009 | |
November 6, 2010 | | 282,705 | | $ | 0.89 | | August 5, 2010 | | | | | | | | | |
November 6, 2009 | | 1,906,733 | | $ | 1.30 | | December 4, 2010 | | | | | | | | | |
| | 3,897,169 | | | | | | | | 2,000,000 | | | | | |
| | | | | | | | | | | | | | | | | |
The warrants outstanding at December 31, 2008, were exercised on December 17, 2009 for $4,820; $712 was transferred from contributed surplus to share capital, representing value of warrants at date of issuance.
As part of the West Timmins acquisition, the Company issued 4,180,085 warrants (note 8); to December 31, 2009, a total of 282,916 warrants were exercised for proceeds of $340. $761 was transferred to contributed surplus, representing value of warrants exercised at date of issuance.
f) Contributed Surplus
Year ended December 31, | | 2009 | | 2008 | |
Balance, beginning of year | | $ | 7,982 | | $ | 6,797 | |
Stock-based compensation | | 2,504 | | 2,077 | |
Options and warrants issued on the West Timmins acquisition, note 8 | | 24,719 | | — | |
Stock options exercised | | (7,792 | ) | (670 | ) |
Warrants exercised (2008 — expired) | | (1,473 | ) | (222 | ) |
Balance, end of year | | $ | 25,940 | | $ | 7,982 | |
g) Accumulated Other Comprehensive Income
Year ended December 31, | | 2009 | | 2008 | |
Balance, beginning of year | | $ | 0 | | $ | (6 | ) |
Other comprehensive income, net of tax | | 26 | | 6 | |
Balance, end of year | | $ | 26 | | $ | 0 | |
43
NOTES TO THE CONSOLIDATED FINANCIAL STATEMENTS
FOR THE YEARS ENDED DECEMBER 31, 2009 AND 2008
(in thousands of dollars, except as the per share amounts)
h) Basic and Diluted Income (Loss) per Share
The impact of the outstanding options and warrants for the year ended December 31, 2008 has not been included in the calculation of loss per share as the impact would be anti-dilutive. The diluted income (loss) per share for the year ended December 31, 2009 and 2008 is calculated as follows:
Year ended December 31, | | 2009 | | 2008 | |
Net income (loss) for the year | | $ | 2,135 | | $ | (5,501 | ) |
Weighted average diluted number of common shares outstanding | | 229,753 | | 155,797 | |
Diluted income (loss) per share | | $ | 0.01 | | $ | (0.04 | ) |
The diluted number of shares outstanding at December 31, 2009, is as follows:
Weighted average commons share outstanding | | 224,278 | |
Incremental shares — stock compensation options | | 2,150 | |
Incremental shares — warrants | | 3,325 | |
Weighted average diluted number of common shares outstanding | | 229,753 | |
13. ASSET RETIREMENT OBLIGATIONS
A summary of the changes in the asset retirement obligations for the years ended December 31, 2009 and, 2008 is as follows:
Year ended December 31, | | 2009 | | 2008 | |
Balance, beginning of year | | $ | 1,461 | | $ | 1,228 | |
Liability incurred on the Timmins West property | | 72 | | 109 | |
Liability incurred on the Bell Creek mine | | 49 | | — | |
Acquired with the Bell Creek West properties note 10 | | 197 | | — | |
Accretion expense | | 146 | | 124 | |
Total asset retirement obligations | | $ | 1,925 | | $ | 1,461 | |
Less current portion (included on accounts payable and accrue liabilities): | | (197 | ) | — | |
Long term asset retirement obligations | | $ | 1,728 | | $ | 1,461 | |
Asset retirement obligations include $1,455 acquired obligations for site reclamation and remediation on the Bell Creek mine and mill and $273, obligations for site reclamation and remediation on the Timmins mine project and $197, acquired obligations with the acquisition of the Bell Creek West properties. This includes site restoration, rehabilitation and remediation of tailings pond, roads, mine infrastructure and plant and equipment.
The liability is accreted over time through charges to operating costs and, the associated costs capitalized on the related assets will be amortized over the assets’ useful lives once commercial production commences.
The total undiscounted estimated asset retirement liability is $4,960 for the Bell Creek mine and mill and $851 for the Timmins mine project. In determining this amount it has been assumed that the costs will be incurred in twelve to twenty years for the Bell Creek mine and mill and fourteen years for Timmins mine project; the costs were discounted using a credit-adjusted risk-free rate of 10%.
In view of the uncertainties concerning the preparation of the cost estimate, the ultimate cost of asset retirement obligations could differ materially from the estimated amounts. Any future changes to the liability as a result of changes in regulations, laws or assumptions used would be recognized prospectively.
44
NOTES TO THE CONSOLIDATED FINANCIAL STATEMENTS
FOR THE YEARS ENDED DECEMBER 31, 2009 AND 2008
(in thousands of dollars, except as the per share amounts)
14. RELATED PARTY TRANSACTIONS
In addition to the transactions with Hochschild in 2009 (note 12(b)), the following are related party transactions for the years ended December 31, 2009 and 2008:
No fees were paid during 2009 (2008 — $647) for consulting services provided by directors. The fees paid in 2008 included $500 paid to a director as finder fees related to the Hochschild equity transactions (note 12(b)), and have been recorded as share issue costs.
In 2009, the Company charged $87 (2008 — $112) to Northern Superior. The charges were for certain corporate governance, finance, investor relations and accounting and administrative services the Company provided to Northern Superior under an administrative service agreement entered into in June 2008 and terminated on April 30, 2009.
During the year ended December 31, 2009, Northern Superior, the joint venture operator for the Ti-pa-haa-kaa-ning property, charged the Company $216 (2008 — $4,017), for the Company’s share for the property expenditures. As at December 31, 2009, there is net amount of $87 (2008 — $814) due to Northern Superior, of which $87 is included in accounts payable (2008 — $1,088) and $Nil in exploration advances and other receivables (2008 — $274).
Related party transactions are measured at the exchange amount which is the consideration agreed to between the parties.
15. FUTURE INCOME TAXES
The provision for income taxes in the consolidated statement of loss and deficit represents an effective rate different than statutory rate of 31% (2008 — 31.5%) computed by applying the cumulative Canadian federal and provincial income tax rates to the loss before income taxes due to the following:
Year ended December 31, | | 2009 | | 2008 | |
Loss before income taxes | | $ | (9,694 | ) | $ | (7,532 | ) |
Computed income tax recovery at Canadian statutory rates | | 3,005 | | 2,373 | |
Non-deductible expenses | | (471 | ) | (507 | ) |
Future tax rate adjustments | | 9,360 | | 442 | |
Other | | (65 | ) | (277 | ) |
Future income tax recovery | | $ | 11,829 | | $ | 2,031 | |
The tax effect of temporary differences that gives rise to the Company’s net future income tax liability is as follows:
As at December 31, | | 2009 | | 2008 | |
Future income tax assets | | | | | |
Operating losses carried forward | | $ | 20,398 | | $ | 2,962 | |
Property, plant and equipment | | 2,265 | | — | |
Share issue costs | | 1,730 | | 730 | |
Asset retirement obligations | | 432 | | 394 | |
Other | | 115 | | — | |
| | 24,940 | | 4,086 | |
Less: Valuation allowance | | (4,529 | ) | (201 | ) |
Total future income tax assets | | $ | 20,411 | | $ | 3,885 | |
| | | | | |
Future income tax liabilities | | | | | |
Resource properties and deferred exploration | | $ | (173,386 | ) | $ | (19,676 | ) |
Property, plant and equipment | | — | | (1,590 | ) |
Total future income tax liability | | (173,386 | ) | (21,266 | ) |
Net future income tax liability | | $ | (152,975 | ) | $ | (17,381 | ) |
45
NOTES TO THE CONSOLIDATED FINANCIAL STATEMENTS
FOR THE YEARS ENDED DECEMBER 31, 2009 AND 2008
(in thousands of dollars, except as the per share amounts)
The renunciation in 2008 of flow through funds raised in 2007 resulted in $4,725 (none in 2009) reduction in share capital with a corresponding increase to future income tax liability. During the first quarter of 2008, the Company renounced $15,000 of flow through expenditures (funds raised in 2007), of which $5,340 were spent on Canadian exploration expenditures (“CEE”) as at December 31, 2007 and the remainder was spent in 2008 on eligible CEE.
At December 31, 2009, the Company has loss carry forwards of $63,490 available for tax purposes in Canada which expire between 2010 and 2029; the Company also has losses carried forward of $15,225 available for tax purposes in Mexico expiring between 2013 and 2019. The Company has taken a full valuation allowance against the Mexico losses as at December 31, 2009.
16. SUPPLEMENTAL CASH FLOW INFORMATION
Non-cash investing and financing activities
Year ended December 31, | | 2009 | | 2008 | |
Resource properties | | | | | |
Value allocated pursuant to the West Timmins Mining acquisition (2008 —finalization of the purchase price allocation for Bell Creek asset acquisition) | | $ | 563,596 | | $ | 64 | |
Value allocated on the acquisition of Bell Creek West properties | | 6,707 | | — | |
Reduction in working capital related to resource properties | | 2,122 | | 8,607 | |
Write off of resource properties | | 210 | | — | |
Depreciation capitalized | | 2,705 | | 664 | |
Asset retirement obligations incurred | | 122 | | 109 | |
Stock based compensation capitalized (note 12(d)) | | 813 | | 473 | |
Shares issued as part of resource property agreements | | 114 | | 118 | |
Share Capital | | | | | |
Shares issued on acquisition of West Timmins Mining (net of share issue costs) note 8 | | $ | 399,045 | | $ | 0 | |
Shares issued for resource properties (note 10) | | 6,628 | | 118 | |
Transfer of amounts from contributed surplus (note 12) | | 9,265 | | 892 | |
Future tax recovery on share issue costs | | 1,266 | | 297 | |
2008 — 15 million flow through shares renounced recorded as adjustment to share issue costs (note 15) | | — | | (4,725 | ) |
Interest received | | $ | 414 | | $ | 2,200 | |
Income taxes paid | | — | | — | |
Cash and cash equivalents consist of: | | | | | |
Cash | | $ | 44,220 | | $ | 25,319 | |
Short term investments | | 88,700 | | 60,000 | |
| | $ | 132,920 | | $ | 85,319 | |
46
NOTES TO THE CONSOLIDATED FINANCIAL STATEMENTS
FOR THE YEARS ENDED DECEMBER 31, 2009 AND 2008
(in thousands of dollars, except as the per share amounts)
17. COMMITMENTS AND CONTINGENCIES
In addition to commitments and contractual obligations under various property agreements (note 10), the Company’s existing contractual obligations are as follows:
| | | | | | | | | | | | 2015 and | | | |
| | 2010 | | 2011 | | 2012 | | 2013 | | 2014 | | thereafter | | Total | |
Office rent | | $ | 455 | | $ | 431 | | $ | 433 | | $ | 429 | | $ | 179 | | $ | 0 | | $ | 1,927 | |
Asset retirement obligations | | — | | — | | — | | — | | — | | 5,811 | | 5,811 | |
Capital leases and other | | 3,880 | | 3,006 | | 2,764 | | 1,266 | | 253 | | 1,261 | | 12,430 | |
| | $ | 4,335 | | $ | 3,437 | | $ | 3,197 | | $ | 1,695 | | $ | 432 | | $ | 7,072 | | $ | 20,168 | |
18. SEGMENTED INFORMATION
The Company’s one reportable segment is the acquisition and exploration of mineral properties. Geographic information as at December 31, 2009 and 2008 is as follows:
As at December 31, | | 2009 | | 2008 | |
Resource properties and deferred exploration | | | | | |
Canada | | $ | 732,171 | | $ | 172,108 | |
Mexico | | 117,022 | | — | |
| | $ | 849,193 | | $ | 172,108 | |
Property, plant and equipment | | | | | |
Canada | | $ | 28,701 | | $ | 13,703 | |
Mexico | | 22 | | — | |
| | $ | 28,723 | | $ | 13,703 | |
Future tax liabilities | | | | | |
Canada | | $ | (120,198 | ) | $ | (17,381 | ) |
Mexico | | (32,777 | ) | — | |
| | $ | (152,975 | ) | $ | (17,381 | ) |
47
CORPORATE INFORMATION
BOARD OF DIRECTORS
Alan C. Moon, Chair (1) (4)
Anthony Makuch
Ignacio Bustamante (2)
Peter Crossgrove (1)
Roberto Dañino (1)
Jonathan Gill (2)
Frank Hallam (2)
Daniel Innes (2)
Arnold Klassen (3)
Wayne O’Connor (4)
K. Sethu Raman (4)
Ignacio Rosado (3)(4)
Michael D. Winn (3)
(1) Corporate Governance and Nominating Committee
(2) Health, Safety Environment and Community Committee
(3) Audit Committee
(4) Compensation Committee
OFFICERS
Anthony (Tony) Makuch, President and CEO
Brian Hagan, Executive Vice-President
Mike Kelly, Senior Vice-President, Operations
Mario Stifano, Vice-President & CFO
Alasdair Federico, General Counsel & Corporate Secretary
Eric Kallio, Vice-President, Exploration
Tina Ouellette, Vice-President, Human Resources
Mark Utting, Vice-President, Investor Relations
Merushe (Meri) Verli, Vice-President, Finance and Controller
HEAD OFFICE
181 University Ave., Suite 2000
Toronto, Ontario, Canada M5H 3M7
Tel: 416 703 6298
Fax: 416 703 7764
Email: info@lsgold.com
Internet: www.lsgold.com
INVESTOR RELATIONS
info@lsgold.com
EXPLORATION OFFICE
1515 Government Road South
Timmins, ON, Canada P4R 1N4
Tel: 705 269 4344
Fax: 705 268 1794
TRANSFER AGENT
Computershare Investor Services Inc.
Toll-free within North America 1 (800) 564 6253
International (514) 982 7555
Email: service@computershare.com
Manage your shares online at Computershare’s Investor Centre at
www-us.computershare.com/investor
AUDITORS
Deloitte & Touche LLP
181 Bay Street, Suite 1400
Toronto, ON, Canada M5J 2V1
Stock Exchange Listing: TSX — LSG
ANNUAL GENERAL AND SPECIAL MEETING
St. Andrew’s Club & Conference Centre
150 King Street West, 27th Floor
Toronto, Ontario, M5H 1J9
Tel: 416 366 4228
Fax: 416 366 9347
May 5, 2010 at 4:30 pm
48