Exhibit 99.76
Scott Wilson Mining
LAKE SHORE GOLD CORP.
TECHNICAL REPORT
ON THE MARHILL PROJECT,
HOYLE TOWNSHIP, TIMMINS,
ONTARIO, CANADA
NI 43-101 Report
Author:
Reno Pressacco, M.Sc.(Applied), P.Geo.
March 1, 2011
SCOTT WILSON ROSCOE POSTLE ASSOCIATES INC.
Report Control Form | | |
| | |
Document Title | | Technical Report on the Marlhill Project, Hoyle Township, Timmins, Ontario, Canada |
| | | | | | |
Client Name & Address | | Lake Shore Gold Corp. | | | | |
| | 181 University Ave., Suite 2000 | | | | |
| | Toronto, ON, Canada M5H 3M7 | | | | |
| | | | | | |
Document Reference | | | | Status & | | Final |
| | Project #1512 | | Issue No. | | Version |
Issue Date | | March 1, 2011 | | | | | |
| | | | | | | |
Lead Author | | Reno Pressacco | | | (Signed) | | |
| | | | | | | |
Peer Reviewer | | Luke Evans | | | (Signed) | | |
| | | | | | | |
Project Manager Approval | | Luke Evans | | | (Signed) | | |
| | | | | | | |
Project Director Approval | | Wayne W. Valliant | | | (Signed) | | |
| | | | | | | |
Report Distribution | | Name | | No. of Copies |
| | | | |
| | Client | | |
| | | | |
| | Scott Wilson RPA Filing | | 1 (project box) |
Scott Wilson Roscoe Postle Associates Inc.
55 University Avenue, Suite 501
Toronto, Ontario M5J 2H7
Canada
Tel: +1 416 947 0907
Fax: +1 416 947 0395
mining@scottwilson.com
SCOTT WILSON RPA | | www.scottwilson.com |
TABLE OF CONTENTS
| PAGE |
| |
1 SUMMARY | 1-1 |
Executive Summary | 1-1 |
Technical Summary | 1-4 |
2 INTRODUCTION | 2-1 |
3 RELIANCE ON OTHER EXPERTS | 3-1 |
4 PROPERTY DESCRIPTION AND LOCATION | 4-1 |
5 ACCESSIBILITY, CLIMATE, LOCAL RESOURCES, INFRASTRUCTURE AND PHYSIOGRAPHY | 5-1 |
6 HISTORY | 6-1 |
7 GEOLOGICAL SETTING | 7-1 |
Regional Geology | 7-1 |
Property Geology | 7-4 |
8 DEPOSIT TYPES | 8-1 |
9 MINERALIZATION | 9-1 |
10 EXPLORATION | 10-1 |
11 DRILLING | 11-1 |
12 SAMPLING METHOD AND APPROACH | 12-1 |
13 SAMPLE PREPARATION, ANALYSES AND SECURITY | 13-1 |
14 DATA VERIFICATION | 14-1 |
15 ADJACENT PROPERTIES | 15-1 |
16 MINERAL PROCESSING AND METALLURGICAL TESTING | 16-1 |
17 MINERAL RESOURCE AND MINERAL RESERVE ESTIMATES | 17-1 |
Mineral Resources | 17-1 |
18 OTHER RELEVANT DATA AND INFORMATION | 18-1 |
19 INTERPRETATION AND CONCLUSIONS | 19-1 |
20 RECOMMENDATIONS | 20-1 |
21 REFERENCES | 21-1 |
22 DATE AND SIGNATURE PAGE | 22-1 |
23 CERTIFICATE OF QUALIFIED PERSON | 23-1 |
Lake Shore Gold Corp. – Marlhill Project | | |
Technical Report NI 43-101 – March 1, 2011 | | |
i
LIST OF TABLES
| | PAGE |
| | |
Table 1-1 | Summary of the Estimated Mineral Resources for the M1 Vein | 1-4 |
Table 4-1 | Marlhill Land Tenure and Taxes | 4-3 |
Table 6-1 | Historic Drilling at Marlhill | 6-4 |
Table 8-1 | Porcupine District Operations with Greater Than 100,000 oz Au Production | 8-2 |
Table 12-1 | Significant Intersections M1 Vein | 12-2 |
Table 14-1 | Results of the Check Surveying Program | 14-3 |
Table 14-2 | Results of the Check Assaying Program | 14-4 |
Table 14-3 | Results of the Scott Wilson RPA Check Assaying Program | 14-9 |
Table 15-1 | Bell Creek Historical Production | 15-1 |
Table 15-2 | Other New Mines Trend Production | 15-2 |
Table 16-1 | Summary of Head Analyses | 16-1 |
Table 16-2 | Direct Cyanidation Results | 16-2 |
Table 16-3 | Comparison of Gold Recovery by Flowsheet | 16-2 |
Table 16-4 | Results from Additional Analyses on Cyanidation Residue | 16-3 |
Table 17-1 | Summary of the Estimated Mineral Resources for the M1 Vein | 17-1 |
Table 17-2 | Summary of the Drill Hole Database (as at August 5, 2010) | 17-2 |
Table 17-3 | Summary Statistics for Uncapped and Capped Assays | 17-13 |
Table 17-4 | Summary Statistics for Composited Gold Assays Within the M1 Vein Domain Model | 17-14 |
Table 17-5 | Bulk Density Results | 17-15 |
Table 17-6 | Summary of Block Model Limits | 17-19 |
Table 17-7 | Summary of Block Model Attributes | 17-19 |
Table 17-8 | Summary of Cut-off Grade Input Parameters Estimates | 17-22 |
Table 17-9 | Summary of the Estimated Mineral Resources for the M1 Vein | 17-23 |
Table 17-10 | Block Model Reconciliation Report, M1 Vein Mineral Resource Estimate | 17-26 |
Table 19-1 | Summary of the Estimated Mineral Resources for the M1 Vein | 19-3 |
LIST OF FIGURES
| | PAGE |
| | |
Figure 4-1 | Location Map | 4-4 |
Figure 4-2 | Claim Map | 4-5 |
Figure 7-1 | Regional Geology | 7-3 |
Figure 7-2 | Property Geology | 7-6 |
Figure 14-1 | View of the Open Pit Mine (Looking Northwest) | 14-1 |
Figure 14-2 | View of the Historical Drill Core Storage Area | 14-2 |
Figure 14-3 | Comparison of Check Assay Results, M1 Vein | 14-8 |
Figure 14-4 | Comparison of Check Assay Results (One High Grade Sample Removed), M1 Vein | 14-8 |
Figure 17-1 | Plan View of the Drill Hole Locations | 17-3 |
ii
Figure 17-2 | M1 Vein Containing Brecciated, Siliceous Mafic Volcanic Fragments. | 17-6 |
Figure 17-3 | M1 Vein Showing Well Developed Banding | 17-7 |
Figure 17-4 | M1 Vein Showing Well Developed Breccia Texture Defined by Tourmaline Stockwork | 17-8 |
Figure 17-5 | M1 Vein Showing Tourmaline Stockwork and Altered Mafic Volcanic Wall Rock Inclusions (A) | 17-9 |
Figure 17-6 | Longitudinal View of The M1 Vein Model (Looking Northeast) | 17-11 |
Figure 17-7 | Histogram of Raw Assay Values, M1 Vein | 17-12 |
Figure 17-8 | Histogram of Fixed-Length Composite Samples Contained Within the M1 Vein | 17-15 |
Figure 17-9 | Histogram of Bulk Density Results, M1 Vein | 17-16 |
Figure 17-10 | Longitudinal Projection of the Gold Grades of the M1 Vein | 17-17 |
Figure 17-11 | Overview of the Marlhill Block Model Outline | 17-20 |
Figure 17-12 | Longitudinal View of the M1 Vein Mineral Resources | 17-24 |
iii
1 SUMMARY
EXECUTIVE SUMMARY
INTRODUCTION
Scott Wilson Roscoe Postle Associates Inc. (Scott Wilson RPA) was retained by Lake Shore Gold Corp. (Lake Shore Gold) to prepare a Technical Report in support of an initial Mineral Resource estimate for the mineralization at the Marlhill gold deposit located in Hoyle Township, near Timmins, Ontario. This Technical Report conforms to NI 43-101 Standards of Disclosure for Mineral Projects.
Lake Shore Gold is a public company listed on the Toronto Stock Exchange and trading under the symbol LSG. Lake Shore Gold was founded in 2002 to explore for precious and base metals hosted within the Quebec and Ontario portions of the Canadian Shield. Since its founding, Lake Shore Gold has acquired the rights to the former producing Bell Creek Mine and certain neighbouring properties, including the Marlhill Mine which is the subject of this report.
The Qualified Person for this report is Mr. Reno Pressacco, P. Geo., who at the time of preparation of the Mineral Resource estimate held the position of Senior Consulting Geologist with Scott Wilson RPA. Mr. Pressacco visited the Marlhill property on April 19 to 21, 2010, where he observed the general layout of surficial features, examined selected outcrops, inspected the condition of the stored historical drill core, reviewed the project’s database structure, and held discussions regarding the modelling approaches.
INTERPRETATIONS AND CONCLUSIONS
The Marlhill Mine has produced a small amount of gold during the 1981 to 1989 period by means of underground mining methods and during the 2002 to 2003 period by means of open pit mining methods. While a number of gold-bearing quartz veins are known to be present in the immediate vicinity of the mine workings, much of the gold production has been derived from the M1 vein system. Diamond drilling programs that were conducted by previous operators on the property have been successful in tracing the M1 vein along a strike length of 500 m to 600 m and to a vertical depth of 400 m to 500 m from surface. While mining activity has excavated portions of the M1 vein to a vertical
1-1
depth of approximately 150 m, additional gold mineralization has been shown to be present beneath the existing underground mine workings.
A Mineral Resource estimate has been prepared using the historical drill hole information, as Lake Shore Gold has not completed any new drilling to test the M1 vein system except for drilling of four holes in the fall 2010 that are reported to have essentially no impact on the current resource estimate. Spot checking of the accuracy of the drill hole collar information and the assay information contained in the historical drill hole database has shown that this historical information can be relied upon for the preparation of a Mineral Resource estimate.
The Mineral Resource estimate has been prepared for the M1 vein only, as modelling of the minor vein sets were not successful due to the limited areal extent of those veins (as evidenced from the existing underground exposures) and the limited amount of detailed drill hole information. Following completion of the solid model of the M1 vein, a separate clipping polygon was created which was then used to remove that part of the domain model in and about the existing mine workings. The M1 vein strikes in a northwesterly direction and dips steeply to the north near surface. The dip of the vein increases with depth such that the vein is interpreted to have a sub-vertical dip at depth.
A domain model of the distribution of the M1 vein was prepared using a series of cross sections that were spaced at a distance of 15 m (± 7.5 m viewing window). While Lake Shore Gold applied a capping factor of 34 g/t Au to the assays within the vein model, analysis of the statistics suggested that a value of 30 g/t Au may be more appropriate. A comparative analysis of the impact of the lower capping grade reveals that no material difference will result in the average grade of the data set from the application of a lower capping grade. Density measurements on a small number of M1 vein samples resulted in a bulk density of 2.73 t/m3.
Analysis of the trends of the gold distribution within the M1 vein shows that, at a grade of 1 g/t Au, and, to a lesser degree, 2 g/t Au, a shallow southeast orientation (approximately -20° to azimuth 135°) is present in the gold grades contained within that portion of the M1 Vein below the lowermost level of the Marlhill Mine. At first glance, this orientation appears discordant with the observed trends at many of the gold deposits in the Timmins area. Examination of the structural information presented in Pressacco
1-2
(1999), however, suggests that the observed shallow southeast plunge may be paralleling an F1 fold axis. A second, more steeply southeast plunging orientation is suggested by the higher grade contours and is consistent with the observed trends in the mined-out areas.
An upright, rotated, whole-block model with the long axis of the blocks oriented along an azimuth of 135° and dipping vertically was constructed using the GEMS v.6.2.3 software package. Gold grades were interpolated into the individual blocks for the M1 vein mineralized domain using the Inverse Distance Squared (ID2) interpolation method. A single-pass approach was used where the size of the search ellipse was governed by the average strike length of the stopes that were excavated along the M1 vein in the underground mine.
An estimate of an appropriate cut-off grade was derived using a gold price of US$1,184/oz, an exchange rate of 0.95 (US$:C$), and estimates of operating costs derived from Scott Wilson RPA’s experience in the area. The input parameters suggest that a cut-off grade of 2.9 g/t Au is appropriate for use in preparation of the Mineral Resource estimate for the M1 vein.
The mineralized material was classified into the Indicated Mineral Resource category on the basis of the search ellipse range obtained from the preliminary variography study, the demonstrated continuity of the gold mineralization above the suggested cut-off grade, and the density of drill hole information. The Mineral Resources for the Marlhill gold deposit include all blocks that are located within the M1 vein domain model, within that portion of the vein that contains gold values above the estimated cut-off grade, inclusive of internal dilution. The estimated Mineral Resources are set out in Table 1-1.
1-3
TABLE 1-1 SUMMARY OF THE ESTIMATED MINERAL RESOURCES FOR
THE M1 VEIN
Lake Shore Gold Corp. — Marlhill Deposit
| | | | Capped Grade | | | |
Category | | Tonnes | | (g/t Au) | | Oz Au | |
Measured | | — | | — | | — | |
Indicated | | 395,000 | | 4.52 | | 57,400 | |
Measured & Indicated | | 395,000 | | 4.52 | | 57,400 | |
| | | | | | | |
Inferred | | — | | — | | — | |
Notes:
1. CIM definitions were followed for classification of Mineral Resources.
2. Mineral Resources are estimated at a cut-off grade of 2.9 g/t Au.
3. Mineral Resources are estimated using an average long-term gold price of US$1,125 per ounce, and a US$/C$ exchange rate of 0.95.
4. A minimum mining width of approximately two metres was used.
5. Capped gold grades are used in estimating the Mineral Resource average grade.
6. Sums may not add due to rounding.
7. Mr. Reno Pressacco, M.Sc.(A), P.Geo., is the Qualified Person for this resource estimate.
There are no Mineral Reserves estimated for the Marlhill property.
RECOMMENDATIONS
It is clear that the depth extents of the gold mineralization within the M1 vein have not been defined by drilling, and the strike extents of the M1 vein remain open. There is also potential to discover additional en-echelon vein systems on the property. Further work to better define the M2 and M3 veins is also warranted.
Scott Wilson RPA believes that Lake Shore Gold would be justified in carrying out exploration programs that are designed to test these areas for the presence of additional gold mineralization.
TECHNICAL SUMMARY
PROPERTY DESCRIPTION AND LOCATION
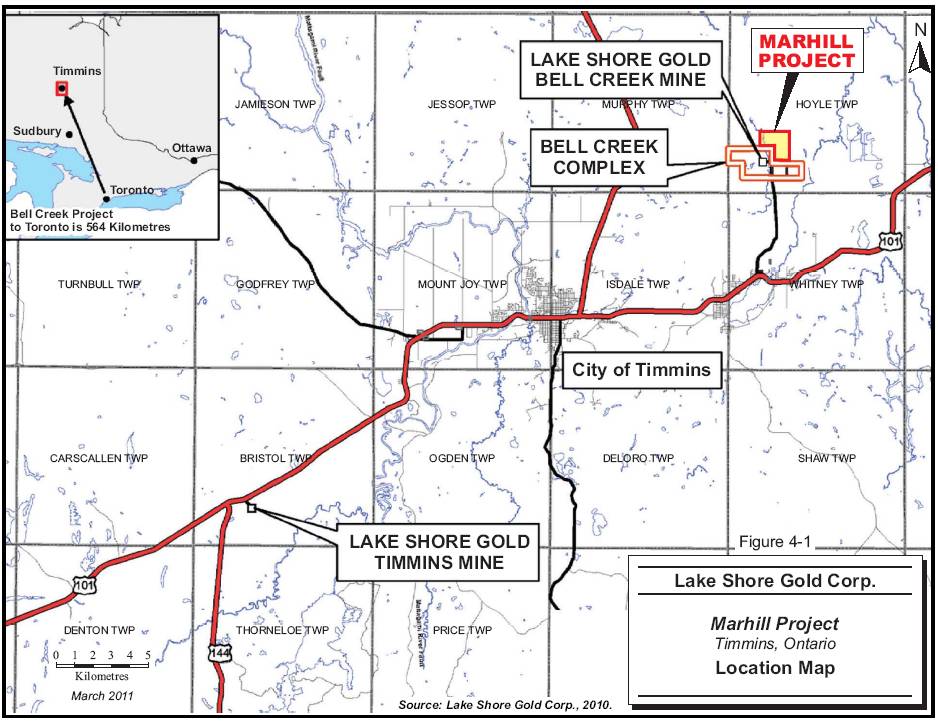
The Marlhill property is located in the Porcupine Mining District’s Hoyle Township, approximately 20 km, by road, northeast of Timmins, Ontario. Access to the property is gained via Florence Street, a 6.7 km long all-weather asphalt and gravel road north of Ontario Provincial Highway 101.
1-4
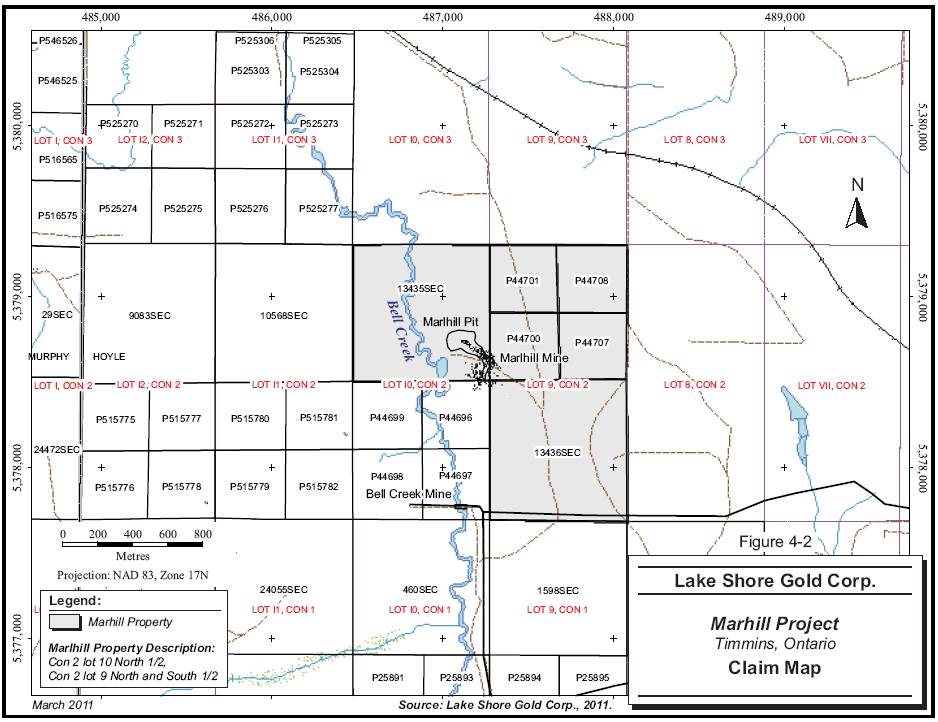
Marlhill makes up a small portion of Lake Shore Gold’s Bell Creek West properties, comprising a Crown mining lease for four unpatented mining claims covering 64.75 ha, and two patented claims. Marlhill is defined as the land underlying Lot 10, Concession II, north half, Hoyle Township, and Lot 9, Concession II, north and south half, Hoyle Township.
LAND TENURE
In December 2009, Lake Shore Gold acquired the Bell Creek West properties, comprising 2,800 ha, from the Porcupine Joint Venture (PJV). The PJV, a joint venture originally between Placer Dome Canada Ltd. (Placer Dome) and Kinross Gold Corp. (Kinross), was formed in 2002. In 2005, Goldcorp Inc. (Goldcorp) acquired Placer Dome’s interest and became the operator. In 2007, Goldcorp acquired Kinross’ interest in the PJV. The property is subject to a 2% Net Smelter Return (NSR) royalty payable to the PJV.
Lake Shore Gold has not entered into any “Exploration Agreements” with First Nations for the Marlhill property.
Lake Shore Gold has not applied for permits to mine the Marlhill property. In December 2009, the Ministry of Northern Development, Mines and Forestry consented to transfer the Marlhill Mine Closure Plan from Goldcorp to Lake Shore Gold.
SITE INFRASTRUCTURE
Infrastructure from previous operations, i.e., mine ramp access, ventilation raise and a stope, have been removed via backfilling, mining of the crown pillar, or flooding. Shrinkage stoping was employed as the mining method and excavated stopes were left unfilled.
The local economy of Timmins is dominated by the mining and logging industries. Timmins is one of Canada’s largest municipalities with an area of 321,000 ha. The Abitibi region has a long history of mining activity, so supplies and experienced mining labour is readily available in the Timmins area.
1-5
The Victor M. Power Airport has scheduled service provided by three carriers, Air Canada Jazz, Bearskin Airlines, and Air Creebec. The Timmins District Hospital is a major referral health care centre for northeastern Ontario.
All-weather road access is available to the Marlhill property and electrical power transmission lines are present nearby.
HISTORY
In the late 1970s and early 1980s, Rosario Resources Canada Ltd. (Rosario) and later Amax, which was renamed Canamax Resources Inc. (Canamax), conducted magnetic, electromagnetic (EM), and Induced Polarization (IP) geophysical surveys along with overburden stripping, channel sampling, geological mapping, and diamond drilling.
From 1978 to 1988, a total of 52,495 m (diameter unknown) of diamond drilling was completed. A decline was driven and production levels were established on the M1 and M2 vein systems at 25 m, 50 m, 92 m, 100 m, 125 m, and 150 m elevations. Production was halted in November 1991 and the mine was allowed to flood. Production from this period totalled 30,924 oz (962 kg) of gold.
In 2003 and 2004, the PJV excavated an open pit to access resources remaining in the mine’s crown pillar. A total of 7,500 oz (233.3 kg) of gold were recovered.
GEOLOGY
The Marlhill deposit is located in the western part of the Archean aged Southern Abitibi Greenstone Belt, a supracrustal complex of moderately to highly deformed, usually greenschist facies, volcanic-dominated oceanic assemblages that are approximately 2.7 Ma in age. Supracrustal rocks in the Timmins region are assigned as members of seven volcanic and two sedimentary assemblages within the Western Abitibi Subprovince of the Superior Province. Intrusions were emplaced during the Archean and Proterozoic eons.
Keewatin Series greenstone volcanics are found in spatially discrete groupings and contain tholeiitic volcanic lineages as well as other volcanic assemblages that were tectonically combined with spatially discrete komatiite-rich assemblages, banded iron formations, and turbidite-bearing sedimentary basins. Unconformably overlying the
1-6
Keewatin Series are younger sub-aqueous to sub-aerial volcanic-sedimentary rocks of the Timiskaming Series. These rocks occur along the margins of late regional tectonic deformation zones that are near strike-parallel shears and/or faults which commonly show high strain and tight, vertically verging folding. .
Batholiths and stocks found in the Southern Abitibi are approximately sequential from tonalite-monzonite-granodiorite through massive granodiorite, granite, feldspar ± quartz porphyry to syenite.
The property is underlain by carbonate altered, greenschist facies, Archean-aged, metavolcanic and clastic metasedimentary rock units belonging to the Tisdale and Porcupine assemblages. The strike of the rock units is generally north-northwest to south-southeast dipping to the northeast. Gold mineralization is hosted in quartz veins within Mg-rich tholeiitic mafic metavolcanics that are in the form of massive flows, pillowed flows, amygdaloidal flows and strained schistose fabrics. To the north, the metavolcanics are in contact with Porcupine assemblage clastic sediments
Alteration at Marlhill occurs as two main types, chlorite and sericite-carbonate. Chloritic alteration is wide-spread. Sericite-carbonate alteration is generally developed adjacent to auriferous quartz vein but extends as much as 20 m from the vein contact. Ultramafic rocks host the widest zones of sericite alteration, extending beyond the limits of mineralization.
The Marlhill vein system is described as being similar to those in the North A zone of the adjacent Bell Creek Mine. The largest vein at Marlhill, the M1 vein, strikes northwest and dips to the northeast at surface. The M2 and M3 are north striking veins which have shorter strike lengths and appear to form economic lenses in saddle reef type structures. These two vein sets have been folded.
DEPOSIT TYPE
The Marlhill vein system is an Archean-aged mesothermal gold deposit. Mesothermal gold deposits comprise high Fe or high ratio Fe/(Fe + Mg) greenstone type rocks that induce sulphidization reactions and gold precipitation and are thought to have formed during the final orogenic phases of Archean tectonism. Most mesothermal gold systems
1-7
are interpreted to have developed along active and permeable low displacement faults and shear zones adjacent to large crustal scale deformation zones. Clusters of large deposits commonly occur in greenschist-facies and, to a lesser extent, amphibolite-facies country rocks.
MINERALIZATION
In the Porcupine Camp, gold mineralized structures most commonly form in relatively competent volcanics intruded by felsic porphyry stocks and dykes prior to the deposition of the Timiskaming assemblages. Observations of pyrrhotite and gold-mineralized clasts at both Pamour and Dome mines within Timiskaming conglomerates suggest a prolonged gold deposition event from the creation of the steep south dipping Destor Porcupine Fault Zone (DPFZ) up to the latest episode of crustal stabilization.
The Marlhill vein system is described as being similar to those in the North A zone of the adjacent Bell Creek Mine. Two types of quartz vein systems are observed at Marlhill. These are:
· long, linear, southeast-striking veins (M1 system) which cut the regional foliation at roughly 45° and show local intense folding parallel to a 080° axial planar surface; and
· shorter and thicker quartz vein systems (M2 and M3 veins) which cut the foliation at 060° to 090°, but have been folded parallel to the 080° foliation.
Generally, fracture intensity and alteration increase toward mineralized zones. Alteration consists of bulk and fracture-controlled sericite, Fe-dolomite to ankerite, quartz, and dark green to black chlorite. Microfractures contain late chlorite and carbonate veinlets. Distal carbonatization, resulting in grey carbonate zones, is quite common.
Mineralization consists of narrow (0.1 m) to wide (3.0 m) quartz veins containing 2% to 5% fine-grained pyrite, arsenopyrite and, rarely, visible gold. Gold occurs as plates on the surface of sulphide minerals but has an affinity for arsenopyrite. Where white mica and sulphides commonly occur on slips and fractures within the vein, gold tenor generally attains economic values.
1-8
EXPLORATION
Since Lake Shore Gold acquired the Property in 2009, no exploration work has been done. Drilling of four holes, as described under Drilling below, has had no impact on the current resource estimate.
DRILLING
Four diamond drill holes totalling 3,116 m were drilled by Lake Shore Gold on the Property in the fall 2010. These holes have essentially no impact on the current resource estimate.
HISTORIC QUALITY ASSURANCE/QUALITY CONTROL
It is not known whether Certified Reference Material (CRM) or blank samples were used by Rosario.
Standard and duplicate samples were processed by Swastika Laboratories Ltd. (Swastika Labs) on drill core samples forwarded by Canamax and Pentland Firth Ventures Ltd. (PFV) as part of Swastika Labs’ in-house Quality Assurance/Quality Control (QA/QC) program. Results of duplicate analyses were returned and are recorded on drill logs. No check analysis were completed by a second party assay laboratory.
No check analysis was completed on underground diamond drill core assayed at the Bell Creek Mine laboratory.
DATA VERIFICATION
Lake Shore Gold, at Scott Wilson RPA’s request, conducted an independent cross check of collar locations where 15 drill holes were selected for re-surveying. Of these, four could not be located or were inaccessible due to field conditions. In general, the drill hole collar coordinates provided in the original drill logs correlate very well with the check survey information, to within an accuracy of approximately two metres.
Lake Shore Gold also carried out a program of check assaying. Selected intervals of available historical drill core were quarter-sampled and re-assayed for their gold content.
1-9
A total of 155 samples in 15 drill holes were selected. Very good correlation is observed between the original values and the check assay values.
A small program of check assaying was carried out by Scott Wilson RPA, with a total of 18 samples selected from two of the historical drill holes. The quarter-sawed core samples were sent to the Acme Analytical Laboratories Ltd. (Acme) facility located in Vancouver, British Columbia, where the gold contents were determined using Acme’s G601 method or fire assay. While such a small number of check samples cannot be considered as adequate to confirm the accuracy of all of the assays contained within the Marlhill drill hole database, Scott Wilson RPA is satisfied that it has independently confirmed the presence of gold in approximately similar quantities as have been historically reported in the selected samples from the Marlhill deposit.
Scott Wilson RPA’s data verification included a program of spot checking of the drill hole database. For this program, approximately 10% of the drill holes contained within the Marlhill database were selected for validation on a semi-random basis. The information contained in the drill logs for the selected holes was compared against the information contained in the digital database. No errors were identified which Scott Wilson RPA considers to be material.
As a result of its data validation efforts, Scott Wilson RPA believes that the historical drill hole data that was obtained for the M1 vein at the Marlhill deposit is appropriate for use in the preparation of mineral resource estimates.
MINERAL RESOURCES AND MINERAL RESERVES
Scott Wilson RPA prepared a Mineral Resource estimate for the M1 vein system based on historical drill information. The Mineral Resource estimate has been prepared for the M1 vein only as attempts to model other minor veins sets were unsuccessful.
Scott Wilson RPA classified the mineralized material into the Indicated Mineral Resource category on the basis of the search ellipse range obtained from the preliminary variography study, the demonstrated continuity of the gold mineralization above the suggested cut-off grade, and the density of drill hole information.
1-10
There are no Mineral Reserves present on the property as of the date of this Technical Report.
DESCRIPTION OF THE DATABASE
A digital database was provided to Scott Wilson RPA by Lake Shore Gold containing drill hole information such as collar location, downhole survey, lithology, and assays, in comma delimited format. The drill hole database contains 367 holes.
The cut-off date for the drill hole database is August 5, 2010. All of the drill hole information contained in this database comprise historical data that was gathered by such prior operators as Canamax and PFV. Lake Shore Gold has not completed any new drill holes on the Property.
This drill hole information was modified slightly so as to be compatible with the format requirements of the Gemcom-Surpac v.6.1.4 mine planning software
GEOLOGICAL DOMAIN INTERPRETATIONS
Interpretation of the position of the M1 vein was carried out by Lake Shore Gold on a total of 56 cross sections that are oriented in a northeast-southwest direction and spaced 15 m apart (± 7.5m viewing window). Attempts to model minor vein sets were not successful due to limited detailed drill hole information.
GRADE CAPPING
Lake Shore Gold has elected to apply a capping value of 34 g/t Au (approximately 1 oz/ton Au), which is the historical value applied to the deposits in the Timmins camp over the past 100 years. Scott Wilson RPA has analyzed the assay data and suggests that 30 g/t Au may be a more appropriate capping value. A comparative analysis of the impact of the lower capping grade reveals, however, that no material difference will result in the average grade of the data set from the application of a lower capping grade.
COMPOSITING METHODS
All samples contained within the M1 vein domain model were composited using the fixed-length method. Scott Wilson RPA believes that this method is appropriate for this style of mineralization.
1-11
BULK DENSITY
Scott Wilson RPA has carried out a small program of bulk density measurements on samples of the M1 vein mineralized material taken from the remaining historical drill core. A total of 18 drill core samples from two drill holes were selected and shipped to the Acme facility located in Vancouver, British Columbia. The bulk densities of the samples were determined using Acme’s G8SG method based on water displacement.
An average bulk density of 2.73 t/m3 is suggested from this small data set.
TREND ANALYSIS
Scott Wilson RPA conducted a short study of the overall trends that may be present as an aid in carrying out a variography study of the continuity of the gold grades at the M1 vein. The average gold grade across the entire width of the mineralized vein for each drill hole that pierced the M1 vein domain model was plotted and hand-contoured on a longitudinal projection.
The 1 g/t Au contour, and, to a lesser degree, the 2 g/t Au contour, displays a shallow southeast orientation (approximately -20° to azimuth 135°) within the M1 vein below the lowermost level of the Marlhill Mine.
VARIOGRAPHY
The analysis of the variographic parameters of the mineralization found in the mineralized domains of the M1 vein domain model began with the construction of downhole and omni-directional variograms using the capped, composited sample data. An evaluation of other anisotropies resulted in successful variograms for the down-plunge direction for the M1 vein domain, with a good model fit that identified a range of approximately 40 m. Efforts to identify the across-plunge anisotropy did not result in a successful variogram model.
BLOCK MODEL CONSTRUCTION
An upright, rotated, partial percentage block model with the long axis of the blocks oriented along an azimuth of 135° and dipping vertically was constructed using the GEMS v.6.2.3 software package. The selected block size was 1.5 m x 3.0 m x 3.0 m. A number of attributes were created to store such information as metal grades, distances to and number of informing samples, domain codes, and resource classification codes.
1-12
Gold grades were interpolated into the individual blocks for the M1 vein mineralized domain using the ID2 interpolation method. A single-pass approach was used where the size of the search ellipse was governed by the average strike length of the stopes that were excavated along the M1 vein in the underground mine.
“Hard” domain boundaries were used along the contacts of the mineralized domain model in which only data contained within the M1 vein domain model were allowed to be used to estimate the grades of the blocks in the M1 vein domain, and only those blocks within the domain limits were allowed to receive grade estimates. Both the uncapped and capped, composited grades of all the drill hole intersections were used to derive an estimate of a block’s grade.
CUT-OFF GRADE
Scott Wilson RPA estimated an underground cut-off grade of 2.9 g/t Au based on a US$1,184/oz gold price, an exchange rate of 0.95 (US$:C$), a $100/t operating cost, and mill recovery of 90%.
MINERAL RESOURCE CLASSIFICATION CRITERIA
The mineralized material was classified on the basis of the search ellipse range obtained from the preliminary variography study, the demonstrated continuity of the gold mineralization above the suggested cut-off grade, and the density of drill hole information.
BLOCK MODEL VALIDATION
Validation efforts for the Mineral Resource estimate at the Marlhill deposit consisted of visual, statistical, and volumetric checks. There is a good correlation between the reported volumes for the resource outline, with the block model reporting a slightly less volume (i.e., tonnage). With respect to grade, it can be seen that the block model is reporting an average grade approximately 1 g/t Au less than is suggested by the informing capped composited samples.
1-13
2 INTRODUCTION
Scott Wilson Roscoe Postle Associates Inc. (Scott Wilson RPA) was retained by Mr. Eric Kallio, Vice President, Exploration of Lake Shore Gold Corp. (Lake Shore Gold), to prepare a Technical Report in support of an initial Mineral Resource estimate for the mineralization at the Marlhill gold deposit located in Hoyle Township, near Timmins, Ontario. This Technical Report conforms to NI 43-101 Standards of Disclosure for Mineral Projects.
Lake Shore Gold is a public company listed on the Toronto Stock Exchange and trading under the symbol LSG. Lake Shore Gold was founded in 2002 to explore for precious and base metals hosted within the Quebec and Ontario portions of the Canadian Shield. Since its founding, Lake Shore Gold has acquired the rights to the former producing Bell Creek Mine and certain neighbouring properties, including the Marlhill Mine which is the subject of this report.
As part of the December 17, 2009 land acquisition from Goldcorp Inc. (Goldcorp), Lake Shore acquired the formerly producing Marlhill Mine. The Marlhill Mine operated as a small ramp-access mining operation from 1989 to 1991 and produced about 31,000 oz of gold. In 2003 and 2004, the Porcupine Joint Venture (PJV) extracted approximately 7,500 oz of gold from a crown pillar using open pit mining methods. At the time of Scott Wilson RPA’s site visit, no surface infrastructure from the past mining activities remained other than the partially water-filled open pit mine.
The current report is based on data provided to Scott Wilson RPA by Lake Shore Gold and obtained from other relevant, publicly available information from such sources as the World Wide Web, various Canadian Federal and Provincial government maps, reports and databases, and academic journals.
The Qualified Person for this report is Mr. Reno Pressacco, P. Geo., who at the time of preparation of the Mineral Resource estimate held the position of Senior Consulting Geologist with Scott Wilson RPA. Mr. Pressacco visited the Marlhill property on April 19 to 21, 2010, where he observed the general layout of surficial features, examined selected outcrops, inspected the condition of the stored historical drill core, reviewed the project’s database structure, and held discussions regarding the modelling approaches.
2-1
The site visit was conducted in the presence of Mr. Keith Greene, Mr. Ralph Koch, and Mr. Anthony Camuti, all of whom are currently employed by Lake Shore Gold.
Prior Scott Wilson RPA involvement with the Marlhill property includes site visits and descriptions prepared by Mr. Pressacco while in the employ of the Ontario Geological Survey. The results of these activities were presented in Open File Report 5985 (Pressacco, 1999).
The documentation reviewed, and other sources of information, are listed at the end of this report in Section 21, References.
2-2
LIST OF ABBREVIATIONS
Units of measurement used in this report conform to the SI (metric) system. All currency in this report is Canadian dollars (C$) unless otherwise noted.
µ | | micron |
°C | | degree Celsius |
°F | | degree Fahrenheit |
µg | | microgram |
A | | ampere |
a | | annum |
bbl | | barrels |
Btu | | British thermal units |
C$ | | Canadian dollars |
cal | | calorie |
cfm | | cubic feet per minute |
cm | | centimetre |
cm2 | | square centimetre |
d | | day |
dia. | | diameter |
dmt | | dry metric tonne |
dwt | | dead-weight ton |
ft | | foot |
ft/s | | foot per second |
ft2 | | square foot |
ft3 | | cubic foot |
g | | gram |
G | | giga (billion) |
Gal | | Imperial gallon |
g/L | | gram per litre |
g/t | | gram per tonne |
gpm | | Imperial gallons per minute |
gr/ft3 | | grain per cubic foot |
gr/m3 | | grain per cubic metre |
hr | | hour |
ha | | hectare |
hp | | horsepower |
in | | inch |
in2 | | square inch |
J | | joule |
k | | kilo (thousand) |
kcal | | kilocalorie |
kg | | kilogram |
km | | kilometre |
km/h | | kilometre per hour |
km2 | | square kilometre |
kPa | | kilopascal |
kVA | | kilovolt-amperes |
kW | | kilowatt |
kWh | | kilowatt-hour |
L | | litre |
L/s | | litres per second |
m | | metre |
M | | mega (million) |
m2 | | square metre |
m3 | | cubic metre |
min | | minute |
MASL | | metres above sea level |
mm | | millimetre |
mph | | miles per hour |
MVA | | megavolt-amperes |
MW | | megawatt |
MWh | | megawatt-hour |
m3/h | | cubic metres per hour |
opt, oz/st | | ounce per short ton |
oz | | Troy ounce (31.1035g) |
oz/dmt | | ounce per dry metric tonne |
ppm | | part per million |
psia | | pound per square inch absolute |
psig | | pound per square inch gauge |
RL | | relative elevation |
s | | second |
st | | short ton |
stpa | | short ton per year |
stpd | | short ton per day |
t | | metric tonne |
tpa | | metric tonne per year |
tpd | | metric tonne per day |
US$ | | United States dollar |
USg | | United States gallon |
USgpm | | US gallon per minute |
V | | volt |
W | | watt |
wmt | | wet metric tonne |
yd3 | | cubic yard |
yr | | year |
2-3
3 RELIANCE ON OTHER EXPERTS
This report has been prepared by Scott Wilson Roscoe Postle Associates Inc. (Scott Wilson RPA) for Lake Shore Gold Corp. (Lake Shore Gold). The information, conclusions, opinions, and estimates contained herein are based on:
· Information available to Scott Wilson RPA at the time of preparation of this report,
· Assumptions, conditions, and qualifications as set forth in this report, and
· Data, reports, and other information supplied by Lake Shore Gold and other third party sources.
For the purpose of this report, Scott Wilson RPA has relied on ownership information provided by Lake Shore Gold. Scott Wilson RPA has not researched property title or mineral rights for the Marlhill property and expresses no opinion as to the ownership status of the property.
Scott Wilson RPA has relied on Lake Shore Gold for guidance on applicable taxes, royalties, and other government levies or interests, applicable to revenue or income from Marlhill.
Except for the purposes legislated under provincial securities laws, any use of this report by any third party is at that party’s sole risk.
3-1
4 PROPERTY DESCRIPTION AND LOCATION
The Marlhill property is located in the Porcupine Mining District’s Hoyle Township, approximately 20 km, by road, northeast of Timmins, Ontario (Figure 4-1). Access to the property is gained via Florence Street, a 6.7 km long all-weather asphalt and gravel road north of Ontario Provincial Highway 101. The project is situated approximately 564 km north-northwest of Toronto, Ontario. The mine infrastructure is located within National Topography Series Map reference 42-A-11 southeast, at longitude 81° 2’ west and latitude 48.6° north. Universal Transverse Mercator (UTM) coordinates for the project centre utilizing projection North American Datum (NAD) 83, Zone 17 are approximately 486,369 m east, 5,378,445 m north. The property is contiguous to the north boundary of the Bell Creek Mine.
In December 2009, Lake Shore Gold announced the completion of the acquisition of the Bell Creek West properties, comprising 2,800 ha, from the PJV. The PJV, a joint venture between Placer Dome Canada Ltd. (Placer Dome) and Kinross Gold Corp. (Kinross), was formed in 2002. In 2005, Goldcorp acquired Placer Dome’s interest and became the operator (Butler, 2008). In 2007, Goldcorp acquired Kinross’ interest in the PJV.
Marlhill makes up a small portion of the Bell Creek West properties, comprising a Crown mining lease for four unpatented mining claims covering 64.75 ha, and two patents covering both surface and mineral rights. Marlhill is defined as the land underlying Lot 10, Concession II, north half, Hoyle Township, and Lot 9, Concession II, north and south half, Hoyle Township. (Figure 4-2).
The consideration for the transaction totalled C$20 million, including C$15 million of cash and 1,593,023 Lake Shore Gold common shares. As part of the transaction, the PJV retained a 2% Net Smelter Return (NSR) royalty.
Underlying royalty agreements attached to Marlhill are:
· The Marlhill Agreement: Registered agreement (304107) between Marlhill Mines Limited (Marlhill Mines) and Rosario Resources Canada Ltd. (Rosario) dated February 27, 1980, as amended by any agreement between Marlhill and Amax of Canada Limited (Amax) (as assignee of Rosario) dated January 5, 1983, and as subsequently assigned. For mining and surface rights of Hoyle Township, Lot 10, Concession II, north half and Lot 9 Concession II south half, the Marlhill Agreement defines a 20% net profit royalty (NPR) to be paid to Marlhill in the
4-1
event the lands are placed into commercial production. Once the lands have been placed into commercial production, the royalty shall in no event be less than C$25,000 annually and paid within 30 days at the end of each quarter year of operations.
· The PJV Agreement: Agreement between Goldcorp Canada Ltd., Goldcorp Inc. and Lake Shore Gold Corp., dated December 17, 2009, covering all of the Marlhill property, pursuant to which Goldcorp Canada Ltd. and Goldcorp Inc. are jointly entitled to a 2% NSR on the lands.
Lake Shore Gold has not entered into any “Exploration Agreements” with First Nations for the Marlhill property.
Lake Shore Gold has not applied for permits to mine the Marlhill property.
In December 2009, the Ministry of Northern Development Mines and Forestry (MNDMF) consented to the transfer of the Marlhill Mine Closure Plan from Goldcorp to Lake Shore Gold. Blue Heron Solutions for Environmental Management Inc. (Blue Heron) have reviewed the closure plan and have prepared a summary and cost estimate. Blue Heron notes that as of December 2007, the PJV has carried out all the physical requirements of the original “Closure Plan for the Marlhill Mine” as submitted in 2002. Blue Heron reports that their site inspection of September 2009 found no remaining mine hazards on the property. A former mine ramp access, a ventilation raise, and a stope have been removed via backfilling or mining of the crown pillar and flooding. Blue Heron’s recommended closure costs include a budget of approximately C$59,000 for site characterization programs and monitoring and long term monitoring and maintenance for a period of five years post closure. A summary of the Marlhill land tenure and taxes is provided in Table 4-1.
4-2
TABLE 4-1 MARLHILL LAND TENURE AND TAXES
Lake Shore Gold Corp. — Bell Creek Deposit
| | Taxes Paid | | | | | | | | | | | | | | | | | | | | | |
Taxes Paid To | | To MNDMF - | | Taxes | | | | | | | | | | | | | | | | | | | |
MNDMF -2010 Land | | 2010 Lease | | Paid to C | | | | Surface/Mining | | Mining | | | | | | | | | | | | | |
Taxes 1 | | Rent2 | | of T 20103 | | Tenure | | Rights4 | | Claim # | | Owner | | PCL# | | PIN# | | Ha | | Expiry Date | | Royalties | |
| | $ | 194.25 | | | | Mining
Rights
Only | | Mining Lease # 107917 | | 44700 | | Lake
Shore
Gold | | | | | | 64.75 | | 2027-Sep 30 | | Goldcorp2A-2 | |
| | 44708 | | | Goldcorp2A-2 | |
| | 44701 | | | Goldcorp2A-2 | |
| | 44707 | | | Goldcorp2A-2 | |
$ | 256.57 | | | | $ | 645.50 | | MRO &
SRO | | Patent | | | | Lake
Shore
Gold | | 13435SEC | | 65360-
0052 | | | | | | Marlhill Mines; Goldcorp2A-2 | |
$ | 259.00 | | | | $ | 93.13 | | MRO &
SRO | | Patent | | | | Lake
Shore
Gold | | 13436SEC | | 65360-
0043 | | | | | | Marlhill Mines; Goldcorp2A-2 | |
1 MNDF = Ministry of Northern Development, Mines and Forestry
2 MAH = Ministry of Municipal Affairs and Housing
3 C of T = City of Timmins
4 SRO = Surface Rights Only, MRO = Mining Rights Only
4-3
4-4
4-5
5 ACCESSIBILITY, CLIMATE, LOCAL RESOURCES, INFRASTRUCTURE AND PHYSIOGRAPHY
ACCESSIBILITY
Access to Marlhill is gained via Florence Street, a 6.7 km long all-weather asphalt and gravel road, north of Ontario Provincial Highway 101, approximately 20 km northeast of Timmins, Ontario. The area is serviced from Toronto via Highways 400, 69 to Sudbury, and Highway 144 to Timmins; or Hwy 11 from Barrie to Matheson and 101 westward to Timmins. The City of Timmins is also serviced by regularly scheduled airline flights from Toronto. The mine site is located approximately one kilometre north of the Bell Creek Mine security gatehouse.
CLIMATE
The project area, and the City of Timmins, experience a continental climate with an average mean temperature range of -17.5°C (January) to +17.4° (July) and an annual precipitation of approximately 830 mm.
Local lakes start to freeze over approximately mid-November, with spring breakup taking place in early to mid-May. Work can be carried out uninterrupted twelve months a year.
LOCAL RESOURCES
The local economy of Timmins is dominated by the mining and logging industries. Timmins is one of Canada’s largest municipalities with an area of 321,000 ha. The Abitibi region has a long history of mining activity so supplies and experienced mining labour is available in the Timmins area. The 2006 census indicates the population of Timmins to be 42,455 persons. The project enjoys the support of local communities.
The Victor M. Power Airport has scheduled service provided by three carriers, Air Canada Jazz, Bearskin Airlines, and Air Creebec. The Timmins District Hospital is a major referral health care centre for northeastern Ontario.
5-1
INFRASTRUCTURE
All-weather road access to the Marlhill property is present, and electrical power transmission lines are located nearby.
Infrastructure from previous operations (i.e., mine ramp access, ventilation raise and a stope) have been removed via backfilling, mining of the crown pillar, or flooding. Shrinkage stoping was employed as the mining method and excavated stopes were left unfilled.
PHYSIOGRAPHY
The Marlhill property exhibits low to moderate topographic relief, with the property elevation ranging from 285 MASL to 298 MASL. Drainage is characterized by slow, meandering creeks and rivers that are part of the Arctic watershed. Outcrop exposure is less than 3%.
The Timmins area is situated in plant hardiness zone 2a, which supports boreal forest tree species and an active timber, pulp, and paper industry. Local trees species include American Mountain-Ash, Balsam Fir, Black Spruce, Eastern White Cedar, Eastern White Pine, Jack Pine, Pin Cherry, Red, Tamarack, Trembling Aspen, White Birch, White Spruce, and Speckled Alder.
Timber has been harvested on the Marlhill property as past mining operations required clearing of the trees.
5-2
6 HISTORY
The discovery of gold occurrences in the Timmins area began to appear in the historic record in the early part of the twentieth century. The extension of the railway lines from Cobalt, Ontario, in the early 1900s allowed for new access to the gold discoveries found near Porcupine and Nighthawk lakes. With increased access to the region, numerous gold discoveries were reported that initiated the rush to the Porcupine Gold Camp. World class gold deposits were found in the area, with 1909 being of particular note with the discovery of the Vipond, Dome, and Hollinger mines.
Few bedrock outcrops in the Marlhill area and the clay-rich nature of the surface cover restricted prospectors’ ability to find alluvial gold trains in creek bottoms and trace them back to the source material — the main exploration method employed at the time. With the advent of airborne geophysics in the 1960s, the first discoveries were made below the clay-rich belt that surrounds Timmins. Prior to that, gold was found either in outcrop directly or along the strike of outcrops. Gold mineralization found below this “clay-belt” occurred in what is now southern Hoyle Township (Butler, 2008).
The earliest records found for exploration in the immediate area of the Marlhill deposit are:
· An unpublished Hollinger Consolidated Gold Mines Ltd. (HCGM) internal report (Ontario Geological Survey Assessment T File 3587, Jones, 1936);
· An unpublished report of Broulan’s exploration between 1935 and 1957 (Ontario Geological Survey Assessment T File Report 047).
Both reports describe surface trenching and sampling in Hoyle Township Concession II, Lots 9 and 10.
An examination of the surface showings by O. L. Backman dated June 14, 1958, describes bedrock as being poorly exposed and recommended diamond drilling as the most effective means of furthering exploration. Seven drill holes were completed by Broulan, six in 1959 totalling 2,014 ft. (613.87 m) and one in 1963 to 537 ft. (163.68 m) depth. Available drill logs are summary logs only and lack precise collar locations and assay results.
6-1
Rosario acquired the future Marlhill and Bell Creek properties in 1978. Surface exploration work during this time period included stripping and surface trenching (completed in 1978, 1979, 1981, and 1984), detailed mapping of existing trenches in 1982, a Max Min II horizontal loop electromagnetic (EM) survey and a proton procession total field magnetic survey in 1978 and 1979. An additional ground Max Min EM survey was conducted in 1985, and a series of reverse circulation overburden drill holes were completed in 1978, 1979, and 1981.
The M1 vein was exposed by surface trenching in 1980 and the M2 vein was discovered by trenching during the fall of 1984. The M3 vein was discovered by diamond drilling in 1985. The BR1 (Broulan Reef #1 vein), which had been exposed in early trenching by Broulan in 1985, was subsequently recognized as being part of the M1 vein.
The first diamond drill holes in the immediate vicinity of Marlhill Mine were completed by Rosario in 1980. Rosario drilled five holes (diameter unknown) as sole operator and an additional six holes (diameter unknown) were drilled in a joint venture with Broulan. The work was focused on the north-south trending M2 and M3 veins which dip moderately (45°) east and were exposed in trenching. Only four drill holes appear to target the azimuth 135° striking M1 vein. Drilling does not appear to have been completed on a standard grid.
Drill holes MH80-01, MH80-02, MH80-10, and MH80-11 were drilled northeast to southwest and intersected the M1 vein which dips steeply to the northeast near surface. Two holes were drilled south to north and did not intersect mineralization. Six additional holes, also completed in 1980, were drilled southwest to northeast targeting the M2 and M3 veins (BRW-1 to BRW-6). Drilling completed in 1981 (MH81-36 to MH81-42) was oriented southwest to northeast targeting the M2 and M3 veins. Later work was done in a joint venture with DuPont Canada Explorations Ltd. (DuPont). Exploration continued with Amax (later Canamax) replacing Rosario as the operator in 1982.
At approximately 300 m below surface, the M1 vein steepens from 60° to vertical and eventually dips steeply southwest at 80° to 85°. Because of this downhole flattening, the drilling above 300 m depth produced true width vein intersections. Drilling targeting the M2 and M3 veins was drilled southeast to northwest, parallel to the base line orientation.
6-2
Drill holes were usually collared at -60° yielding true width intersections only where M2 and M3 veins flatten towards the M1 vein.
Canamax surface drilling, conducted between 1983 and 1990, was completed on 30 m centres oriented on a local Marlhill grid with a base line at 135° azimuth and 45° azimuth cross lines. Drill holes targeting the M1 vein were drilled on-section from northeast to southwest with collar dips generally between 50° and 65°. The majority of this drilling was shallower than 200 m. A total of 17,288 m of surface diamond drilling (BQ diameter) was completed in the immediate vicinity of the Marlhill Mine between 1980 and 1990, predominantly by Canamax.
In 1989, an inclined ramp was driven and production levels established on the M1 and M2 vein systems at the 25 m, 50 m, 92 m, 100 m, 125 m, and 150 m elevations (Burns, 1993). During this period, 117 underground diamond drill holes totalling 6,302.35 m (primarily AQ and Ex diameter) were cored. In November 1991, production was halted and the underground workings were allowed to flood. Production from the Marlhill mine site during the 1989-1991 production period totalled 30,924 oz (961.8 kg) of gold.
Between 1995 and 1997, Pentland Firth Ventures Ltd. (PFV) drilled the Marlhill vein systems from surface along strike and down plunge of the existing mine workings on 30 m centres. A total of 33,546.8 m (BQ diameter) was completed in 130 drill holes. The workings were dewatered between 1996 and 1997 and a diamond drill program of ten holes totalling 3,566 m (diameter unknown) was done out of drill cut-outs on the 125 m and 140 m levels. These holes were drilled at different azimuths and dips and intersection angles vary accordingly. Changes in market conditions caused further work to be deferred and the mine was allowed to flood again (Pressacco, 1999).
In 2002, a series of nine surface diamond drill holes totalling 411 m (diameter unknown) were completed by Kinross to test the feasibility of open pit mining the crown pillar of the M1 vein system. Drill logs for this drilling are extant but lack collar co-ordinates. Approximately 7,500 oz (233.3 kg) Au was later recovered from the crown pillar by the PJV in 2003 and 2004.
The historic drilling at Marlhill is summarized in Table 6-1.
6-3
TABLE 6-1 HISTORIC DRILLING AT MARLHILL
Lake Shore Gold — Marlhill Deposit
| | | | Hole Sequence | | | | Bell Creek Area | |
| | | | | | | | | | No. of | | | |
Company | | Year | | From | | To | | Location | | Holes | | Metres | |
Broulan | | 1959 | | Hole #1 | | Hole #6 | | surface | | 6 | | 613.87 | |
| | 1963 | | Hole #7 | | | | surface | | 1 | | 163.70 | |
| | | | | | | | | | | | | |
Rosario | | 1980 to 1981 | | MH80-1 | | MH80-23 | | surface | | 5 | | 975.06 | |
| | | | BRW-1 | | BRW-6 | | surface | | 6 | | 198.76 | |
| | | | MH81-01 | | MH81-02 | | surface | | 11 | | 1,014.76 | |
| | | | | | | | | | | | | |
Canamax | | 1983 to 1986 | | 045-01-153 | | 045-01-200 | | surface | | 7 | | 782.50 | |
| | | | 045-01-201 | | 045-01-213 | | surface | | 5 | | 918.00 | |
| | | | 045-01-214 | | 045-01-255 | | surface | | 26 | | 4,170.00 | |
| | | | 045-01-256 | | 045-01-301 | | surface | | 42 | | 6,594.00 | |
| | 1989 to 1990 | | 045-01-315 | | 045-01-333 | | surface | | 5 | | 1,174.70 | |
| | | | 045-01-334 | | 045-01-379 | | surface | | 4 | | 1,460.51 | |
| | 1988 to 1990 | | M1001 | | M21503 | | underground | | 117 | | 6,302.35 | |
| | | | | | | | | | | | | |
PFV | | 1995 | | KB380 | | KB411 | | surface | | 25 | | 3,816.00 | |
| | 1995 to 1997 | | PM1 | | PM105 | | surface | | 105 | | 29,730.80 | |
| | 1996 | | PMU125-1 | | PMU140-10 | | underground | | 10 | | 3,566.00 | |
| | | | | | | | | | | | | |
Kinross | | 2002 | | MH10833 | | MH10847 | | surface | | 9 | | 411.00 | |
6-4
7 GEOLOGICAL SETTING
REGIONAL GEOLOGY
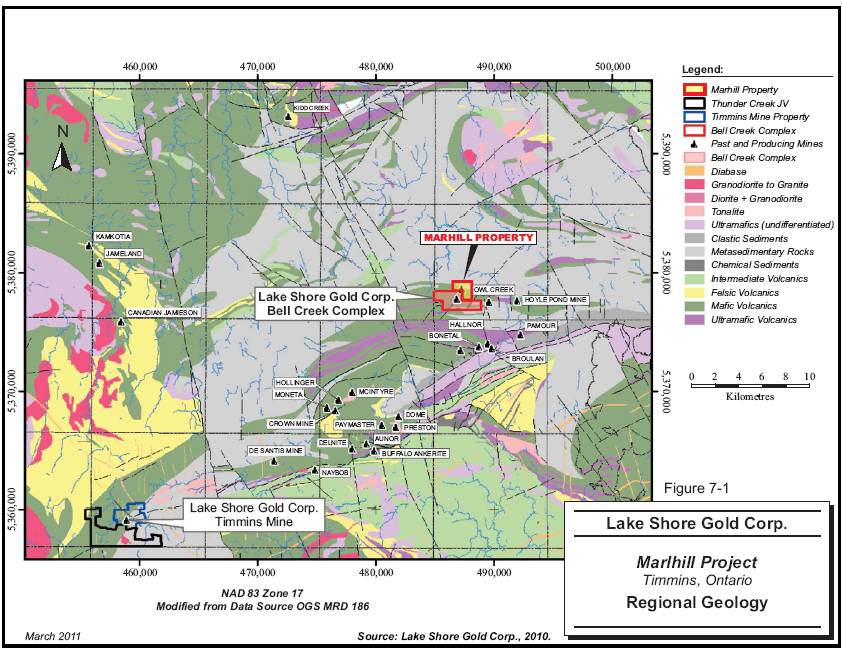
The Marlhill deposit is located in the western part of the Archean aged Southern Abitibi Greenstone Belt, a supracrustal complex of moderately to highly deformed, usually greenschist facies, volcanic-dominated oceanic assemblages that are approximately 2.7 Ma in age. Supracrustal rocks in the Timmins region are assigned as members of seven volcanic and two sedimentary assemblages within the Western Abitibi Subprovince of the Superior Province. Intrusions were emplaced during the Archean and Proterozoic eons.
Keewatin Series greenstone volcanics are found in spatially discrete groupings and contain tholeiitic volcanic lineages as well as other volcanic assemblages that were tectonically combined with spatially discrete komatiite-rich assemblages, banded iron formations, and turbidite-bearing sedimentary basins. Unconformably overlying the Keewatin Series are younger sub-aqueous to sub-aerial volcanic-sedimentary rocks of the Timiskaming Series. These rocks occur along the margins of late regional tectonic deformation zones that are near strike-parallel shears and/or faults which commonly show high strain and tight, vertically verging folding. .
Batholiths and stocks found in the Southern Abitibi are approximately sequential from tonalite-monzonite-granodiorite through massive granodiorite, granite, feldspar ± quartz porphyry to syenite.
An extensive geological history of the South Abitibi Greenstone Belt has been previously filed for the adjacent Bell Creek deposit and may be referenced in the “Technical Report on the Initial Mineral Resource Estimate for the Bell Creek Mine, Hoyle Township, Timmins, Ontario, Canada Prepared for Lake Shore Gold Corp.” that is available in Lake Shore Gold’s disclosure filings on the SEDAR website at www.sedar.com. There has been no material change to the information since the filing in January 2011
The regional geology map is shown in Figure 7-1.
7-1
STRUCTURAL GEOLOGY
Rhys (2003) describes the regional penetrative structures of the Timmins area as being constrained between 2700 Ma and 2670 Ma, and characterized by pre-metamorphic folds (D1) to a sequence of syn-metamorphic folding events (D2 and D3) which overprint D1 folds. The D1 event is multiphase, recorded by truncation of folds at the unconformable base of the Krist-Porcupine sequence. The Destor Porcupine Fault Zone (DPFZ) accounts for two stages of deformation:
· an episode of syn-Timiskaming (2680 Ma to 2677 Ma) brittle faulting, which truncates D1 folds and created the basins for Timiskaming sedimentation, and
· a phase of syn-metamorphic D2-D3 shear zone development, which is represented by a band of highly strained rock, generally several hundred metres wide.
The syn-metamorphic D2-D3 events are often characterized by west-northwest trending foliations, steeply dipping stretching and intersection lineations, and shear zones. The displacement along the DPFZ in the Timmins area is sinistral.
7-2
7-3
PROPERTY GEOLOGY
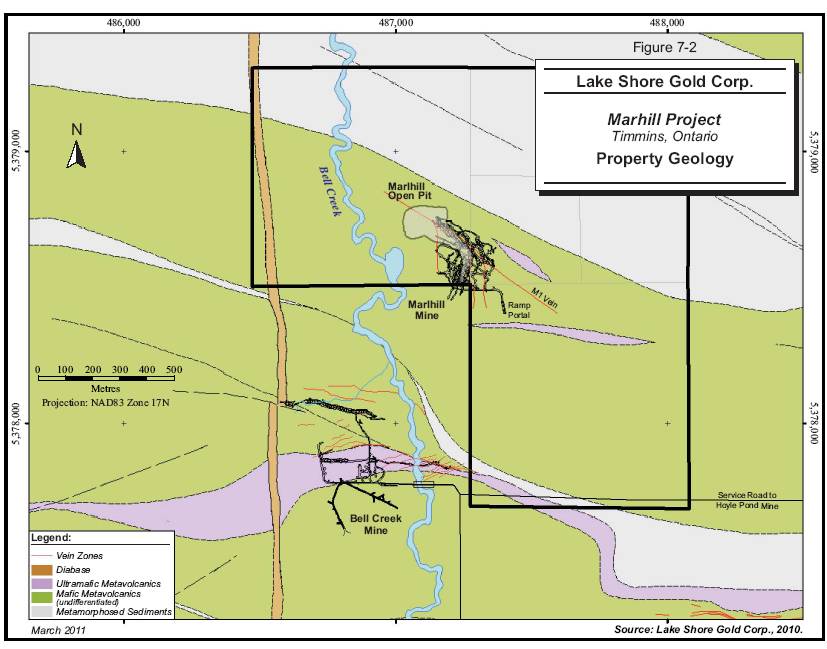
The Marlhill property is underlain by carbonate altered, greenschist facies Archean-aged, metavolcanic and clastic metasedimentary rock units belonging to the Tisdale and Porcupine assemblages. The strike of the rock units is generally north-northwest to south-southeast and dips are to the northeast. Gold mineralization is hosted in quartz veins within Mg-rich tholeiitic mafic metavolcanics that are in the form of massive flows, pillowed flows, amygdaloidal flows, and strained schistose fabrics. To the north, the metavolcanics are in contact with Porcupine assemblage clastic sediments (Berger, 1992). Figure 7-2 shows the property geology map.
Alteration at Marlhill occurs as two main types, chlorite and sericite-carbonate. Chloritic alteration is wide-spread. Weak chlorite alteration is associated with axial planar cleavage in all mafic and ultramafic host rocks. In basaltic rocks, purple-white leucoxene occurs as skeletal crystals up to 2 mm in length and can form up to 5% of the rock locally. Sericite-carbonate alteration is generally developed adjacent to auriferous quartz vein but can extend as much as 20 m from the vein contact. Ultramafic rocks host the widest zones of sericite alteration, extending beyond the limits of mineralization. At the adjacent Bell Creek Mine, the sericite alteration zone can form a 20 m to 30 m wide halo around the sulphide hosted gold zone with intense quartz-ankerite veining and fracturing surrounded by fuchsite. Sericite, Fe-carbonate, and silica surround quartz vein structures. At Bell Creek a visible halo, up to five metres wide, is common in the North zone. At Marlhill, a 0.1 m to 1.0 m wide halo surrounds the veins and is composed of grey ankerite or buff-coloured dolomite. Albite has been observed in thin section and on vein margins where crystals tend to be coarser (Kent, 1990).
The Marlhill vein system is described as being similar to those in the North A zone of the adjacent Bell Creek Mine. The Marlhill veins strike north to northwest and dip to the northeast. Some of these veins have been folded. The following descriptions are taken from Kent (1990).
Two types of quartz vein systems are observed:
· long, linear, southeast-striking veins (M1 system) which cut the regional foliation at roughly 45° and which show local intense folding parallel to a 080° axial planar surface; and
7-4
· shorter and thicker quartz vein systems (M2 and M3 veins) which cut the foliation at 060° to 090°, but have been folded parallel to the 080° foliation.
The most significant vein at Marlhill is the M1 vein. The M2 and M3 are north striking veins which have shorter strike lengths and appear to form economic lenses in saddle reef type structures. In both the M2 and M3 vein systems, the strongest gold mineralization occurs within a zone of 75 m to 100 m long along strike, which is centred upon a fold axis. The fold plunges to the southeast and has an axial plane which strikes east.
Foliation-parallel quartz and quartz-tourmaline “strike” veins also occur. These veins occur within 080° zones of intense foliation, and dip 80° south. The strike veins and associated cubic pyrite are barren of significant gold values. Locally, the strike veins cut the M1, M2, and M3 veins.
STRUCTURAL GEOLOGY
In 1994, Bill Barclay completed review on behalf of PFV that characterized the altered, mafic metavolcanic flows near the mine as striking east-west and being overprinted by a S1 foliation striking between 070° and 095° and dipping 70° to 80° south. Barclay describes an S2, fracture cleavage striking at 063° and dipping 76° southeast. This cleavage is axial planar to the minor folds of the M1 and M2 auriferous quartz, tourmaline, and carbonate veins and forms a diamond fracture pattern in outcrop with the long axis trending east-southeast to southeast and plunging steeply. In trenched outcrop, Barclay observed a second set of veinlets trending east-west to east-northeast/west-southwest having a mean orientation of 082° and dipping 67° south. He characterizes these veinlets as being uniformly narrow (0.5 cm to 3.0 cm), discontinuous at metre scale along strike, straight, and rarely exhibiting pinch and swell structures or local boudinage. These veinlets locally exploit and crosscut the spaced S2 cleavage and were noted to be moderately deflected across the M2 Vein (Barclay, 1994).
7-5
7-6
8 DEPOSIT TYPES
The Porcupine area is well known for hosting two mineral deposit types:
· Xstrata’s Kidd Creek mine, which is a volcanogenic massive sulphide deposit; and
· Several Archean-aged mesothermal gold deposits, of which Bell Creek and Marlhill are examples.
Approximately 15% of the gold mined to date in the Porcupine Camp has come from bulk tonnage, sheeted vein and stockwork deposits, and, to a lesser extent, from narrow veins hosted in Timiskaming-aged sedimentary rocks. These deposits have been mined at the Dome Mine in Tisdale Township, and at the Pamour, Falconbridge Hoyle, Broulan, Hallnor, and Bonetal mines in Whitney Township.
Mesothermal gold deposits comprise high Fe or high ratio Fe/(Fe + Mg) greenstone type rocks that induce sulphidization reactions and gold precipitation and are thought to have formed during the final orogenic phases of Archean tectonism. Regionally, deposits occur in the vicinity of large deformation zones associated with secondary or tertiary deformation. Cox (2000) describes the development of most mesothermal gold systems along active and permeable low displacement faults and shear zones adjacent to large crustal scale deformation zones. Clusters of large deposits commonly occur in greenschist-facies, and, to a lesser extent, amphibolite-facies, country rocks (Butler, 2008).
Gold production to the end of 2006, from some 50 operational sites, is reported to be 2,028,140 kg of Au (65,206,222 oz Au). Table 8-1 highlights the 21 locations that exceeded production of 3,110 kg of Au (100,000 oz Au). The gold deposits of Whitney Township were not examined here but are described by Aitken (1990) and by Brisbin (1997).
8-1
TABLE 8-1 PORCUPINE DISTRICT OPERATIONS WITH GREATER THAN 100,000 OZ AU PRODUCTION
Lake Shore Gold Corp. — Marlhill Deposit
Deposit | | Oz Au (000) | |
Hollinger | | 19,328 | |
Dome | | 15,911 | |
McIntyre — Pamour - Schumacher | | 10,752 | |
Pamour #1 (pits 3,4, 7, Hoyle) | | 4,594 | |
Aunor — Pamour (#3) | | 2,502 | |
Hoyle Pond | | 2,690 | |
Hallnor (Pamour #2) | | 1,646 | |
Preston | | 1,539 | |
Paymaster | | 1,192 | |
Coniaurum/Carium | | 1,110 | |
Buffalo Ankerite | | 957 | |
Delnite (Open Pit) | | 924 | |
Pamour (other sources) | | 677 | |
Broulan Reef Mine | | 500 | |
Broulan Porcupine | | 241 | |
Owl Creek | | 237 | |
Hollinger Pamour Timmins | | 182 | |
Nighthawk | | 176 | |
Moneta | | 149 | |
Crown | | 138 | |
Bell Creek | | 113 | |
Source: http://www.mndm.gov.on.ca/mines/ogs/resgeol/office
A summary of the local Timmins area gold mineralization and stratigraphic associations have been previously filed for the adjacent Bell Creek deposit and may be referenced in the “Technical Report on the Initial Mineral Resource Estimate for the Bell Creek Mine, Hoyle Township, Timmins, Ontario, Canada Prepared for Lake Shore Gold Corp.” that is available in Lake Shore Gold’s disclosure filings on the SEDAR website at www.sedar.com. There has been no material change to the information since the filing of the report in January 2011.
8-2
9 MINERALIZATION
In the Porcupine Camp, gold mineralized structures most commonly form in relatively competent volcanics intruded by felsic porphyry stocks and dykes prior to the deposition of the Timiskaming assemblages. Porphyries dating from 2691 ± 3 Ma to 2688 ± 2 Ma intruded the already folded and faulted greenstone sequences and initiated the mesothermal systems with the formation of associated albitites. Observations of pyrrhotite and gold-mineralized clasts at both Pamour and Dome mines within Timiskaming conglomerates suggest a prolonged gold deposition event from the creation of the steep south dipping DPFZ up to the latest episode of crustal stabilization (Butler, 2008).
Fracture intensity and alteration increase toward mineralized zones. Alteration consists of bulk and fracture-controlled sericite, Fe-dolomite to ankerite, quartz, and dark green to black chlorite. Microfractures contain late chlorite and carbonate veinlets. Distal carbonatization, resulting in grey carbonate zones, is quite common (Butler, 2008).
Kinross and PFV first coined the term “New Mines Trend” to describe areas of the Hoyle antiform and synform that host the current and past producing Hoyle Pond, Owl Creek, Marlhill, and Bell Creek mines and the Schumacher and Vogel advanced exploration projects.
Mineralization at Marlhill consists of narrow (0.1 m) to wide (3.0 m) quartz veins with 2% to 5% fine-grained pyrite, arsenopyrite and, rarely, visible gold. Gold occurs as plates on the surface of sulphide minerals but has an affinity for arsenopyrite. Significant amounts of brown tourmaline (dravite) occur in the veins. Where white mica and sulphides commonly occur on slips and fractures within the vein, gold tenor generally attains economic values. A sericite-sulphide halo extends up to one metre from the vein. Only about 10% to 20% of the gold occurs associated with this wall rock sulphide assemblage. Coarse to medium grained cubic pyrite extends farther away from the vein margin, into the host mafic metavolcanic rocks.
9-1
10 EXPLORATION
Historic exploration in the vicinity of Marlhill is described in Section 6.
Since Lake Shore Gold acquired the Marlhill property, no exploration work has been done. Four holes drilled by Lake Shore Gold in the fall 2010 have had no impact on the current resource estimate.
10-1
11 DRILLING
Four diamond drill holes totalling 3,116 m were drilled by Lake Shore Gold on the Property in the fall 2010. These holes have essentially no impact on the current resource estimate. A number of drilling programs had been completed by previous owners of the property, as described in Section 6 of this report.
11-1
12 SAMPLING METHOD AND APPROACH
No diamond drill core or description of sampling method or approach has been located for drilling completed by Rosario. A review of drill logs indicates that samples were taken from collar to toe of hole in increments adjusted to the nearest foot or half foot based on mineralogy and lithology.
No diamond drill core exists from the Canamax surface drilling or Canamax underground drilling. Review of the surface drill logs indicates selective sampling of the drill core with a typical sample length of one metre. Sample lengths greater or lesser than this have been adjusted to correspond to mineralogical or geological boundaries such as veining, variation in accessory mineralization, and changes in lithology. All surface drill core was split for sampling.
Review of drill logs for the Canamax underground drilling and shows selective sampling of drill core based on geologic boundaries such as veining, variation in accessory mineralization, or lithology. It is not known if the drill core was split or whole core sampled.
All core drilled for PFV is stored at the Bell Creek core farm at the Bell Creek Mine site. Review of the drill logs and drill core indicates selective sampling based on geologic boundaries such as veining, variation in accessory mineralization, or lithology. Drill core was split excepting samples containing visible gold which were whole core sampled (identified in log as whole cored).
Assay certificates are not available for the historical diamond drilling excepting a random portion of the PFV drilling (Koch, 2010, pers. com.).
Significant intersections in historic drilling are summarized in Table 12-1
12-1
TABLE 12-1 SIGNIFICANT INTERSECTIONS M1 VEIN
Lake Shore Gold Corp. — Marlhill Deposit
| | | | | | | | | | | | | | | | From | | To | | Width | | Au | | Au Cut | |
Hole ID | | Easting | | Northing | | Elevation | | Azimuth | | Dip | | Length | | Location | | (m) | | (m) | | (m) | | (g/t) | | (34 g/t) | |
C201 | | 5950.00 | | 6395.00 | | 2290.00 | | 180 | | -75 | | 213.0 | | surface | | 162.1 | | 162.6 | | 0.5 | | 1.51 | | 1.51 | |
C202 | | 6010.00 | | 6395.00 | | 2288.00 | | 180 | | -70 | | 258.0 | | surface | | 209.4 | | 212.7 | | 3.3 | | 5.39 | | 5.39 | |
C245 | | 6247.70 | | 6305.30 | | 2290.20 | | 225 | | -70 | | 234.0 | | surface | | 220.8 | | 225.3 | | 4.5 | | 2.11 | | 2.11 | |
C247 | | 6204.80 | | 6343.83 | | 2289.00 | | 225 | | -70 | | 258.0 | | surface | | 246.5 | | 251.6 | | 5.1 | | 4.92 | | 4.92 | |
C248 | | 6205.60 | | 6301.70 | | 2289.70 | | 220 | | -65 | | 204.0 | | surface | | 188.3 | | 190.3 | | 2.0 | | 14.43 | | 14.43 | |
C249 | | 6170.50 | | 6354.70 | | 2288.50 | | 225 | | -65 | | 225.0 | | surface | | 204.0 | | 206.0 | | 2.0 | | 1.82 | | 1.82 | |
C251 | | 6237.60 | | 6294.60 | | 2290.30 | | 225 | | -65 | | 207.0 | | surface | | 191.7 | | 195.3 | | 3.6 | | 7.11 | | 7.11 | |
C258 | | 6117.30 | | 6406.00 | | 2286.99 | | 225 | | -70 | | 315.0 | | surface | | 292.3 | | 293.8 | | 1.5 | | 2.50 | | 2.50 | |
C269 | | 6187.90 | | 6046.50 | | 2288.00 | | 315 | | -65 | | 153.0 | | surface | | 16.3 | | 21.1 | | 4.8 | | 6.21 | | 6.21 | |
C294 | | 6145.50 | | 6089.00 | | 2293.00 | | 315 | | -65 | | 108.0 | | surface | | 15.0 | | 19.6 | | 4.6 | | 63.80 | | 12.92 | |
M18911 | | 5982.00 | | 6258.00 | | 2177.00 | | 45 | | -49 | | 152.4 | | underground | | 90.1 | | 92.6 | | 2.5 | | 2.34 | | 2.34 | |
M18913 | | 5952.50 | | 6271.50 | | 2177.60 | | 45 | | -32 | | 97.8 | | underground | | 86.9 | | 88.9 | | 2.0 | | 8.39 | | 8.39 | |
M18914 | | 5952.50 | | 6271.50 | | 2177.80 | | 45 | | -15 | | 75.0 | | underground | | 86.4 | | 88.9 | | 2.5 | | 2.95 | | 2.95 | |
M1892 | | 6028.00 | | 6238.00 | | 2180.00 | | 45 | | -30 | | 95.0 | | underground | | 100.1 | | 111.1 | | 11.0 | | 3.23 | | 3.23 | |
M1894 | | 6028.00 | | 6238.00 | | 2180.00 | | 45 | | -50 | | 131.1 | | underground | | 130.4 | | 135.1 | | 4.7 | | 3.68 | | 3.68 | |
PM10 | | 6355.39 | | 6302.31 | | 2289.86 | | 220 | | -65 | | 311.0 | | surface | | 279.0 | | 282.0 | | 3.0 | | 4.80 | | 4.80 | |
PM100 | | 6109.50 | | 6437.50 | | 2288.00 | | 221 | | -70 | | 437.0 | | surface | | 302.8 | | 305.1 | | 2.3 | | 4.10 | | 4.10 | |
PM103 | | 6134.00 | | 6457.00 | | 2286.00 | | 221 | | -71 | | 574.0 | | surface | | 399.3 | | 403.0 | | 3.7 | | 3.61 | | 3.61 | |
PM11 | | 6418.08 | | 6275.49 | | 2290.14 | | 222 | | -63 | | 317.0 | | surface | | 294.4 | | 296.2 | | 1.8 | | 3.76 | | 3.76 | |
PM12 | | 6325.91 | | 6312.63 | | 2290.10 | | 220 | | -63 | | 320.0 | | surface | | 269.7 | | 272.3 | | 2.6 | | 1.87 | | 1.87 | |
PM14 | | 6329.59 | | 6290.82 | | 2290.42 | | 225 | | -63 | | 308.0 | | surface | | 258.0 | | 261.0 | | 3.0 | | 2.21 | | 2.21 | |
PM16 | | 6308.32 | | 6323.47 | | 2289.88 | | 225 | | -63 | | 297.4 | | surface | | 266.1 | | 269.9 | | 3.8 | | 18.69 | | 10.25 | |
PM18 | | 6343.88 | | 6264.61 | | 2290.88 | | 225 | | -63 | | 287.0 | | surface | | 246.4 | | 248.5 | | 2.1 | | 2.26 | | 2.26 | |
PM19 | | 6250.85 | | 6346.77 | | 2290.73 | | 225 | | -65 | | 275.0 | | surface | | 255.9 | | 260.7 | | 4.8 | | 2.95 | | 2.95 | |
PM21 | | 6307.86 | | 6365.87 | | 2289.76 | | 225 | | -65 | | 359.0 | | surface | | 347.0 | | 352.3 | | 5.3 | | 6.59 | | 6.59 | |
12-2
| | | | | | | | | | | | | | | | From | | To | | Width | | Au | | Au Cut | |
Hole ID | | Easting | | Northing | | Elevation | | Azimuth | | Dip | | Length | | Location | | (m) | | (m) | | (m) | | (g/t) | | (34 g/t) | |
PM22 | | 6353.68 | | 6361.43 | | 2289.97 | | 225 | | -65 | | 365.0 | | surface | | 328.0 | | 330.7 | | 2.7 | | 4.04 | | 4.04 | |
PM25 | | 6237.30 | | 6325.31 | | 2289.92 | | 225 | | -80 | | 374.0 | | surface | | 331.2 | | 344.1 | | 12.9 | | 7.41 | | 7.41 | |
PM26 | | 6222.97 | | 6314.93 | | 2289.50 | | 225 | | -80 | | 353.0 | | surface | | 335.5 | | 345.5 | | 10.0 | | 3.89 | | 3.89 | |
PM27 | | 6147.90 | | 6347.54 | | 2287.98 | | 225 | | -80 | | 320.0 | | surface | | 257.4 | | 259.4 | | 2.0 | | 3.42 | | 3.42 | |
PM30 | | 5916.56 | | 6424.40 | | 2283.10 | | 225 | | -60 | | 152.0 | | surface | | 91.5 | | 94.0 | | 2.5 | | 1.87 | | 1.87 | |
PM32 | | 6246.00 | | 6114.00 | | 2288.00 | | 270 | | -65 | | 302.0 | | surface | | 74.0 | | 77.4 | | 3.4 | | 10.60 | | 10.60 | |
PM34 | | 6337.00 | | 6077.00 | | 2288.00 | | 275 | | -65 | | 380.0 | | surface | | 135.2 | | 137.2 | | 2.0 | | 5.42 | | 5.42 | |
PM48 | | 6389.86 | | 6200.52 | | 2291.30 | | 220 | | -65 | | 392.0 | | surface | | 234.5 | | 236.7 | | 2.2 | | 3.86 | | 3.86 | |
PM5 | | 6407.15 | | 6317.56 | | 2290.43 | | 217 | | -60 | | 416.0 | | surface | | 302.8 | | 304.4 | | 1.6 | | 25.42 | | 16.21 | |
PM51 | | 6434.95 | | 6224.27 | | 2290.82 | | 220 | | -66 | | 371.0 | | surface | | 295.5 | | 298.6 | | 3.1 | | 5.20 | | 5.20 | |
PM54 | | 6428.00 | | 6187.00 | | 2288.00 | | 220 | | -66 | | 392.0 | | surface | | 279.0 | | 280.7 | | 1.7 | | 2.75 | | 2.75 | |
PM55 | | 6324.00 | | 6176.00 | | 2288.00 | | 220 | | -66 | | 362.0 | | surface | | 175.0 | | 176.6 | | 1.6 | | 1.69 | | 1.69 | |
PM56 | | 6513.30 | | 6199.50 | | 2290.80 | | 220 | | -66 | | 416.0 | | surface | | 355.0 | | 356.8 | | 1.8 | | 5.80 | | 5.80 | |
PM58 | | 6568.04 | | 6156.90 | | 2291.10 | | 220 | | -66 | | 416.0 | | surface | | 405.0 | | 409.5 | | 4.5 | | 2.55 | | 2.55 | |
PM59 | | 6484.00 | | 6231.00 | | 2288.00 | | 220 | | -66 | | 446.0 | | surface | | 342.0 | | 344.0 | | 2.0 | | 2.08 | | 2.08 | |
PM6 | | 6502.45 | | 6272.05 | | 2290.57 | | 225 | | -65 | | 464.0 | | surface | | 355.5 | | 357.5 | | 2.0 | | 3.41 | | 3.41 | |
PM60 | | 6032.55 | | 6410.41 | | 2285.34 | | 220 | | -66 | | 288.0 | | surface | | 197.8 | | 200.5 | | 2.7 | | 1.98 | | 1.98 | |
PM61 | | 6089.45 | | 6440.78 | | 2286.04 | | 220 | | -66 | | 350.0 | | surface | | 289.5 | | 300.0 | | 10.5 | | 8.00 | | 7.99 | |
PM63 | | 6190.39 | | 6150.62 | | 2291.99 | | 220 | | -45 | | 92.0 | | surface | | 60.7 | | 62.9 | | 2.2 | | 1.85 | | 1.85 | |
PM66 | | 5997.36 | | 6459.81 | | 2284.18 | | 220 | | -70 | | 359.0 | | surface | | 264.5 | | 267.5 | | 3.0 | | 2.03 | | 2.03 | |
PM70 | | 5922.74 | | 6390.96 | | 2283.29 | | 220 | | -70 | | 251.0 | | surface | | 120.0 | | 122.0 | | 2.0 | | 3.15 | | 3.15 | |
PM72 | | 5817.40 | | 6279.00 | | 2288.00 | | 45 | | -45 | | 242.0 | | surface | | 162.4 | | 166.0 | | 3.6 | | 1.59 | | 1.59 | |
PM73 | | 6060.37 | | 6394.87 | | 2285.49 | | 220 | | -70 | | 311.0 | | surface | | 235.0 | | 236.5 | | 1.5 | | 1.75 | | 1.75 | |
PM74 | | 5994.16 | | 6418.25 | | 2284.15 | | 220 | | -70 | | 281.0 | | surface | | 191.5 | | 193.5 | | 2.0 | | 3.43 | | 3.43 | |
PM75 | | 6044.38 | | 6424.67 | | 2285.05 | | 220 | | -70 | | 299.0 | | surface | | 240.5 | | 248.9 | | 8.4 | | 25.31 | | 8.67 | |
PM85 | | 5973.64 | | 6433.97 | | 2283.73 | | 220 | | -65 | | 320.0 | | surface | | 217.0 | | 219.0 | | 2.0 | | 1.56 | | 1.56 | |
PM87 | | 5941.89 | | 6451.47 | | 2283.25 | | 220 | | -65 | | 251.0 | | surface | | 188.3 | | 191.1 | | 2.8 | | 4.77 | | 4.77 | |
PM88 | | 6031.89 | | 6452.18 | | 2285.03 | | 220 | | -65 | | 350.0 | | surface | | 225.3 | | 227.7 | | 2.4 | | 1.61 | | 1.61 | |
12-3
| | | | | | | | | | | | | | | | From | | To | | Width | | Au | | Au Cut | |
Hole ID | | Easting | | Northing | | Elevation | | Azimuth | | Dip | | Length | | Location | | (m) | | (m) | | (m) | | (g/t) | | (34 g/t) | |
PM9 | | 6318.84 | | 6339.63 | | 2289.84 | | 217 | | -62 | | 401.0 | | surface | | 290.0 | | 293.0 | | 3.0 | | 14.51 | | 7.59 | |
PM98 | | 6082.50 | | 6431.00 | | 2286.00 | | 221 | | -69 | | 377.0 | | surface | | 284.7 | | 299.8 | | 15.1 | | 6.07 | | 6.07 | |
PM99 | | 6032.25 | | 6417.99 | | 2286.00 | | 225 | | -70 | | 371.0 | | surface | | 227.4 | | 230.7 | | 3.3 | | 1.65 | | 1.65 | |
PMU125-5 | | 6068.00 | | 6182.00 | | 2164.00 | | 70 | | -67 | | 397.0 | | underground | | 355.0 | | 361.0 | | 6.0 | | 6.19 | | 6.19 | |
PMU140-10 | | 6147.50 | | 6128.00 | | 2149.00 | | 50 | | -55 | | 297.0 | | underground | | 214.2 | | 218.0 | | 3.8 | | 6.09 | | 6.09 | |
PMU140-2 | | 6147.50 | | 6128.00 | | 2149.00 | | 45 | | -50 | | 293.0 | | underground | | 207.6 | | 212.1 | | 4.5 | | 2.42 | | 2.42 | |
PMU140-6 | | 6147.00 | | 6128.00 | | 2149.00 | | 77 | | -53 | | 302.0 | | underground | | 258.5 | | 264.5 | | 6.0 | | 4.25 | | 4.25 | |
PMU140-8 | | 6147.50 | | 6128.00 | | 2149.00 | | 77 | | -60 | | 368.0 | | underground | | 281.0 | | 288.5 | | 7.5 | | 1.75 | | 1.75 | |
12-4
13 SAMPLE PREPARATION, ANALYSES AND SECURITY
Details of sample preparation and assay procedures for samples processed for Rosario are not known.
All samples assayed for Canamax surface drilling, and PFV were processed at Swastika Laboratories Ltd. (Swastika Labs).
Swastika Labs has a Certificate of Laboratory Proficiency, CCRMP ISO 9001:2000 and PTP-MAL for specific mineral analysis parameters (gold, platinum, palladium, silver, copper, lead, nickel, cobalt). PTP-MAL uses criteria for laboratory proficiency established by the Task Accreditation Sub-Committee Working Group for Mineral Analysis Laboratories of the Standards Council of Canada.
A memorandum from Swastika Labs dated December 10, 1982, describes the preparation and analysis procedures as follows
· Samples are crushed through a #1 Woodstock crusher and further reduced to approximately 6-mesh using a Sturtevat Roll. The rolls are then cleaned with a combined wire brush and air jets. Samples weighing less than one pound are crushed through a Sturtevant Roll Jaw crusher. A Jones Riffle is used to cut a 400 g portion for pulverizing. When requested, the reject portion is bagged and stored.
· After reducing to nominal 100 mesh with a Braun pulverizer, the samples are thoroughly blended and sent to the fire assay (FA) department.
· A 0.5 assay ton (AT) portion (14.538 g) is used for FA. This process results in a particle of Au, which in the normal assay method is weighed on a Huesser assay balance with a sensitivity of 0.0025 mg at best or 0.005 oz/st.
· To lower detection limits for geochemical work or where required, the Au particle or doré bead is dissolved and determined by Atomic Absorption Spectrophotometry (AAS).
· Using pliers, the 0.5 mg doré bead is picked off the fused button and transferred to #04 parting cups in a metal tray. The bead is dissolved by adding approximately 4 mL of parting acid (1 part nitric acid and 7 parts water) and then taken to dryness over a boiling water bath. Then 5.4 mL of 40% aqua regia is added and each cup covered and cooked for 20 minutes, then cooled.
13-1
· The concentration of gold now in solution is measured in µg/mL by AAS relative to standards made from proof gold.
· With a 0.5 AT ton sample and a final volume of 5.0 mL, the instrument readings in µg/mL are multiplied by a factor of 0.01 to give ounces per ton, or by 0.34286 to give ppm.
UNDERGROUND SAMPLING
Samples obtained through drilling from underground mine workings by Canamax were processed at the Bell Creek Mine assay laboratory. The Bell Creek laboratory conducted in-house analysis of mill, underground, and drill core samples for both the Marlhill and Bell Creek mines and is not ISO 9001-2000 certified.
SAMPLE QUALITY ASSURANCE/QUALITY CONTROL
It is not known whether Certified Reference Material (CRM) or blank samples were used by Rosario.
Standard and duplicate samples were processed by Swastika Labs on drill core samples forwarded by Canamax and PFV as part of Swastika Labs’ in house Quality Assurance/Quality Control (QA/QC) program. Standards in use at the time were Canmet MA-1 and Amax’s Au7 and Au 9. Results of duplicate analyses were returned and are recorded on drill logs. No check analysis were completed by a second party assay laboratory.
No check analysis was completed on underground diamond drill core assayed at the Bell Creek laboratory.
SAMPLE SECURITY
No records could be found regarding security practices employed prior to 1982, by Rosario. Scott Wilson RPA notes that only one diamond drill hole from this period falls within the resource volume.
Surface drilling for Canamax was completed by St-Lambert Drilling Ltd., with frequent unscheduled site visits to ensure safety, good working practices, and drill core security. Drill core was delivered by the drill foreman to an on-site logging facility and was logged by graduate geologists who oversaw sampling. Samples were packed in cardboard
13-2
boxes sealed with packing tape and shipped via ONR Bus service to Swastika Labs. Pulps and rejects were returned from the laboratory but are no longer available (Ken Tylee, P.Geo., pers. comm., 2010).
Drill core from underground drilling for Canamax was brought to the surface logging facilities by the drill foreman. Samples were brought directly to the Bell Creek assay laboratory by Canamax personnel (Ken Tylee, P.Geo., pers. comm., 2010).
Surface drilling for PFV (1995) was completed by Norex Drilling Ltd., with frequent unscheduled site visits to ensure safety, good working practices, and drill core security. Drill core was delivered by the drill foreman to an on-site logging facility and was logged by graduate geologists who oversaw sampling. Samples were packed in cardboard boxes sealed with packing tape and were picked up by Swastika Labs personnel or brought direct to Swastika Labs by PFV personnel. Pulps and rejects were returned from the laboratory but are no longer available (Ken Tylee, P.Geo., pers. comm., 2010).
Apart from splitting drill core to obtain sample material, no other aspects of sample preparation were conducted by employees, officers, directors, or associates of the aforementioned mining/exploration companies to Scott Wilson RPA’s knowledge.
Sample preparation, security, and analytical procedures described in the previous sections are in accordance with industry practices at the time.
In the opinion of Scott Wilson RPA, the procedures and practices employed by the various operators at Bell Creek prior to Lake Shore Gold’s involvement conformed to industry standards that predate the adoption of NI 43-101.
13-3
14 DATA VERIFICATION
Scott Wilson RPA conducted a site visit on April 19-21, 2010, during which it examined selected surface outcrops, remaining site infrastructure, and access. The site visit was carried out by Mr. Reno Pressacco, Senior Consulting Geologist with Scott Wilson RPA, with the accompaniment of Mr. Anthony Camuti of Lake Shore Gold. As observed during the site visit, the open pit mine is currently filled with water (Figure 14-1), and much of the historical core that was drilled by Canamax and PFV remains intact and accessible (Figure 14-2).
FIGURE 14-1 VIEW OF THE OPEN PIT MINE (LOOKING NORTHWEST)
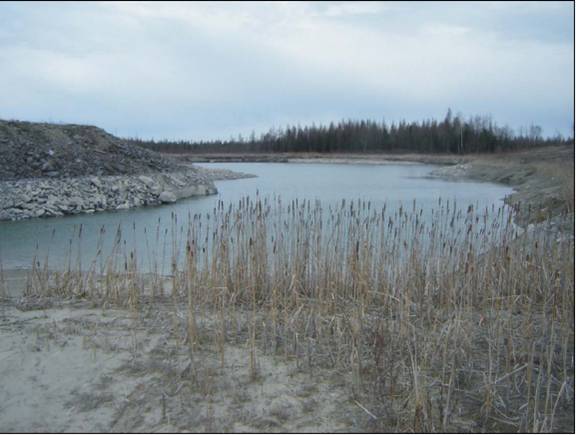
14-1
FIGURE 14-2 VIEW OF THE HISTORICAL DRILL CORE STORAGE AREA
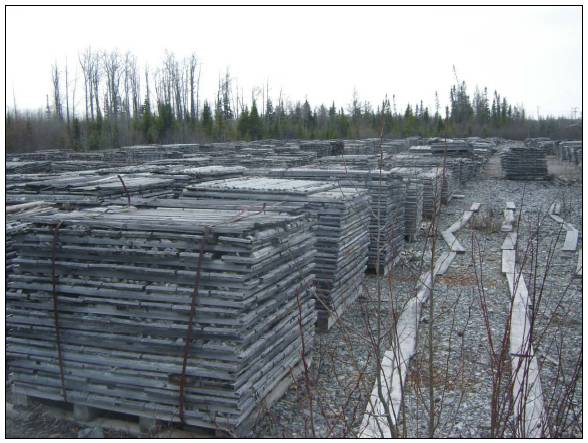
Discussions were carried out with Lake Shore Gold staff in regard to the accuracy of the location of the collars of the historical drill holes. As an independent cross check, a small number of drill hole collars were selected and were re-surveyed. A total of 15 drill holes were selected, of which four were either not able to be located or otherwise inaccessible due to field conditions. The results of this check surveying program are presented in Table 14-1. It can be seen that, in general, the drill hole collar coordinates provided in the original drill logs correlate very well with the check survey information, to within an accuracy of approximately two metres.
14-2
TABLE 14-1 RESULTS OF THE CHECK SURVEYING PROGRAM
Lake Shore Gold Corp. — Marlhill Deposit
| | Easting | | Northing | | Elevation | | Easting | | Northing | | Elevation | | Delta | | Delta | | Delta | |
Hole | | (X) | | (Y) | | (Z) | | (X) | | (Y) | | (Z) | | X | | Y | | Z | |
Local Grid Coordinates | |
PM10 | | 6,355.4 | | 6,302.3 | | 2,289.9 | | 6,353.0 | | 6,304.0 | | 2,290.7 | | 2.4 | | -1.7 | | -0.9 | |
PM11 | | 6,418.1 | | 6,275.5 | | 2,290.1 | | 6,416.4 | | 6,277.2 | | 2,290.3 | | 1.6 | | -1.7 | | -0.2 | |
PM16 | | 6,308.3 | | 6,323.5 | | 2,289.9 | | 6,306.6 | | 6,325.0 | | 2,292.8 | | 1.7 | | -1.5 | | -2.9 | |
PM19 | | 6,250.9 | | 6,346.8 | | 2,290.7 | | 6,249.0 | | 6,348.1 | | 2,292.7 | | 1.8 | | -1.3 | | -2.0 | |
PM21 | | 6,307.9 | | 6,365.9 | | 2,289.8 | | 6,305.9 | | 6,367.3 | | 2,290.0 | | 1.9 | | -1.4 | | -0.2 | |
PM22 | | 6,353.7 | | 6,361.4 | | 2,290.0 | | 6,351.8 | | 6,363.0 | | 2,293.1 | | 1.9 | | -1.6 | | -3.2 | |
PM25 | | 6,237.3 | | 6,325.3 | | 2,289.9 | | | | | | | | | | | | | |
PM26 | | 6,223.0 | | 6,314.9 | | 2,289.5 | | | | | | | | | | | | | |
PM27 | | 6,147.9 | | 6,347.5 | | 2,288.0 | | | | | | | | | | | | | |
PM46 | | 6,357.8 | | 6,219.2 | | 2,291.5 | | 6,356.4 | | 6,220.7 | | 2,291.9 | | 1.4 | | -1.5 | | -0.4 | |
PM48 | | 6,389.9 | | 6,200.5 | | 2,291.3 | | 6,388.5 | | 6,202.2 | | 2,291.5 | | 1.4 | | -1.7 | | -0.2 | |
PM5 | | 6,407.2 | | 6,317.6 | | 2,290.4 | | 6,405.3 | | 6,319.3 | | 2,290.7 | | 1.8 | | -1.8 | | -0.2 | |
PM51 | | 6,434.9 | | 6,224.3 | | 2,290.8 | | 6,433.4 | | 6,226.0 | | 2,291.0 | | 1.6 | | -1.7 | | -0.2 | |
PM6 | | 6,502.4 | | 6,272.1 | | 2,290.6 | | 6,500.8 | | 6,274.0 | | 2,290.8 | | 1.7 | | -2.0 | | -0.2 | |
PM9 | | 6,318.8 | | 6,339.6 | | 2,289.8 | | 6,317.0 | | 6,341.1 | | 2,290.2 | | 1.8 | | -1.5 | | -0.3 | |
UTM Grid Coordinates (NAD83, Zone 17) | |
PM10 | | 487,532.2 | | 5,378,712.6 | | | | 487,529.9 | | 5,378,713.0 | | 290.7 | | 2.3 | | -0.5 | | | |
PM11 | | 487,594.8 | | 5,378,685.6 | | | | 487,593.2 | | 5,378,686.1 | | 290.3 | | 1.7 | | -0.4 | | | |
PM16 | | 487,485.2 | | 5,378,733.8 | | | | 487,483.5 | | 5,378,734.1 | | 292.8 | | 1.7 | | -0.3 | | | |
PM19 | | 487,427.7 | | 5,378,757.2 | | | | 487,426.0 | | 5,378,757.3 | | 292.7 | | 1.7 | | -0.1 | | | |
PM21 | | 487,484.8 | | 5,378,776.2 | | | | 487,483.0 | | 5,378,776.4 | | 290.0 | | 1.8 | | -0.2 | | | |
PM22 | | 487,530.6 | | 5,378,771.7 | | | | 487,528.8 | | 5,378,772.0 | | 293.1 | | 1.8 | | -0.3 | | | |
PM25 | | 487,414.1 | | 5,378,735.7 | | | | | | | | | | | | | | | |
PM26 | | 487,399.8 | | 5,378,725.4 | | | | | | | | | | | | | | | |
PM27 | | 487,324.8 | | 5,378,758.1 | | | | | | | | | | | | | | | |
PM46 | | 487,534.4 | | 5,378,629.4 | | | | 487,533.0 | | 5,378,629.7 | | 291.9 | | 1.5 | | -0.3 | | | |
PM48 | | 487,566.5 | | 5,378,610.7 | | | | 487,565.0 | | 5,378,611.1 | | 291.5 | | 1.5 | | -0.4 | | | |
PM5 | | 487,584.0 | | 5,378,727.7 | | | | 487,582.2 | | 5,378,728.2 | | 290.7 | | 1.8 | | -0.4 | | | |
PM51 | | 487,611.6 | | 5,378,634.4 | | | | 487,610.0 | | 5,378,634.8 | | 291.0 | | 1.6 | | -0.4 | | | |
PM6 | | 487,679.2 | | 5,378,682.1 | | | | 487,677.5 | | 5,378,682.6 | | 290.8 | | 1.7 | | -0.6 | | | |
PM9 | | 487,495.7 | | 5,378,749.9 | | | | 487,494.0 | | 5,378,750.2 | | 290.2 | | 1.7 | | -0.3 | | | |
Lake Shore Gold also carried out a program of check assaying. Selected intervals of such historical drill core as was available were quarter-sampled and were re-assayed for their gold content. A total of 155 samples in 15 drill holes were selected. The numeric results of this check assaying program are presented in Table 14-2, and the results are graphically presented in Figures 14-3 and 14-4. It can be seen that a very good correlation is observed between the original values and the check assay values. On average, the length-weighted average grade of the check assays were 3.22 g/t Au, as compared to the length-weighted average grade of the original assays of 3.19 g/t Au.
14-3
TABLE 14-2 RESULTS OF THE CHECK ASSAYING PROGRAM
Lake Shore Gold Corp. — Marlhill Deposit
Hole | | From | | To | | Length | | Tag # | | AU_Org | | AU_Check | | Diff (Org-Check) | |
PM5 | | 134.7 | | 136.0 | | 1.3 | | 27575 | | 1.1 | | 1.06 | | 0.04 | |
| | 139.2 | | 140.0 | | 0.8 | | 27581 | | 0.16 | | 0.15 | | 0.01 | |
| | 149.9 | | 150.4 | | 0.5 | | 27586 | | 0.53 | | 0.53 | | 0.00 | |
| | 216.0 | | 216.5 | | 0.5 | | 27597 | | 4.18 | | 4.39 | | -0.21 | |
| | 218.0 | | 218.7 | | 0.7 | | 27599 | | 3.53 | | 3.57 | | -0.04 | |
| | 300.0 | | 300.1 | | 0.1 | | 27605 | | 0.15 | | 0.14 | | 0.01 | |
| | 347.2 | | 347.7 | | 0.5 | | 27623 | | 0.96 | | 0.93 | | 0.03 | |
| | 349.0 | | 350.0 | | 1.0 | | 27625 | | 0.39 | | 0.39 | | 0.00 | |
| | 383.1 | | 383.5 | | 0.4 | | 27630 | | 3.19 | | 3.36 | | -0.17 | |
| | 386.0 | | 386.5 | | 0.5 | | 27635 | | 0.06 | | 0.05 | | 0.01 | |
PM6 | | 95.0 | | 96.0 | | 1.0 | | 27651 | | 0.12 | | 0.13 | | -0.01 | |
| | 116.0 | | 116.7 | | 0.7 | | 27660 | | 5.55 | | 3.84 | | 1.71 | |
| | 121.0 | | 122.0 | | 1.0 | | 27665 | | 5.35 | | 5.59 | | -0.24 | |
| | 122.0 | | 123.5 | | 1.5 | | 27666 | | 8.43 | | 8.13 | | 0.3 | |
| | 207.5 | | 209.0 | | 1.5 | | 27679 | | 0.61 | | 0.55 | | 0.06 | |
| | 226.5 | | 227.0 | | 0.5 | | 27683 | | 0.02 | | 0.02 | | 0.00 | |
| | 356.0 | | 356.5 | | 0.5 | | 27707 | | 9.43 | | 8.71 | | 0.72 | |
| | 357.5 | | 358.0 | | 0.5 | | 27710 | | 1.65 | | 1.68 | | -0.03 | |
| | 399.0 | | 399.5 | | 0.5 | | 27715 | | 3.02 | | 3.05 | | -0.03 | |
| | 430.5 | | 431.0 | | 0.5 | | 27720 | | 0.05 | | 0.06 | | -0.01 | |
| | 457.0 | | 458.0 | | 1.0 | | 27732 | | 0.00 | | 0.01 | | -0.01 | |
PM9 | | 122.0 | | 122.5 | | 0.5 | | 27766 | | 0.08 | | 0.10 | | -0.02 | |
| | 134.5 | | 136.0 | | 1.5 | | 27780 | | 0.17 | | 0.17 | | 0.00 | |
| | 158.0 | | 158.6 | | 0.6 | | 27802 | | 1.65 | | 1.71 | | -0.06 | |
| | 245.5 | | 246.0 | | 0.5 | | 27812 | | 0.03 | | 0.03 | | 0.00 | |
| | 292.5 | | 293.0 | | 0.5 | | 27830 | | 2.52 | | 2.40 | | 0.12 | |
| | 296.0 | | 296.5 | | 0.5 | | 27833 | | 3.13 | | 3.29 | | -0.16 | |
| | 296.5 | | 297.0 | | 0.5 | | 27834 | | 2.82 | | 2.81 | | 0.01 | |
| | 299.7 | | 300.2 | | 0.5 | | 27838 | | 2.70 | | 2.64 | | 0.06 | |
| | 362.0 | | 362.5 | | 0.5 | | 27850 | | 0.55 | | 0.48 | | 0.07 | |
PM10 | | 54.2 | | 55.6 | | 1.4 | | 27866 | | 0.21 | | 0.17 | | 0.04 | |
| | 99.0 | | 100.0 | | 1.0 | | 27883 | | 0.17 | | 0.17 | | 0.00 | |
| | 102.5 | | 103.3 | | 0.8 | | 27887 | | 0.22 | | 0.31 | | -0.09 | |
| | 182.5 | | 183.5 | | 1.0 | | 27893 | | 3.15 | | 3.29 | | -0.14 | |
| | 183.5 | | 184.0 | | 0.5 | | 27894 | | 3.77 | | 3.70 | | 0.07 | |
| | 184.0 | | 195.0 | | 11.0 | | 27895 | | 3.26 | | 3.57 | | -0.31 | |
| | 279.0 | | 279.8 | | 0.8 | | 27903 | | 3.08 | | 3.19 | | -0.11 | |
| | 280.3 | | 280.7 | | 0.4 | | 27905 | | 4.22 | | 5.11 | | -0.89 | |
| | 280.7 | | 281.1 | | 0.4 | | 27906 | | 19.13 | | 18.41 | | 0.72 | |
| | 281.5 | | 282.0 | | 0.5 | | 27908 | | 0.55 | | 0.48 | | 0.07 | |
14-4
Hole | | From | | To | | Length | | Tag # | | AU_Org | | AU_Check | | Diff (Org-Check) | |
PM11 | | 36.4 | | 38.0 | | 1.6 | | 4353 | | 0.16 | | 0.17 | | -0.01 | |
| | 40.0 | | 41.0 | | 1.0 | | 4356 | | 0.12 | | 0.12 | | 0.00 | |
| | 42.4 | | 44.0 | | 1.6 | | 4358 | | 0.01 | | 0.02 | | -0.01 | |
| | 84.0 | | 85.0 | | 1.0 | | 4371 | | 0.01 | | 0.01 | | 0.00 | |
| | 104.0 | | 105.0 | | 1.0 | | 4381 | | 0.28 | | 0.25 | | 0.03 | |
| | 111.1 | | 112.1 | | 1.0 | | 4384 | | 0.01 | | 0.01 | | 0.00 | |
| | 119.0 | | 120.5 | | 1.5 | | 4393 | | 1.08 | | 1.16 | | -0.08 | |
| | 141.0 | | 142.0 | | 1.0 | | 4408 | | 0.69 | | 0.71 | | -0.02 | |
| | 164.6 | | 165.8 | | 1.2 | | 4422 | | 0.05 | | 0.05 | | 0.00 | |
| | 185.0 | | 185.5 | | 0.5 | | 4436 | | 0.48 | | 0.38 | | 0.10 | |
| | 188.0 | | 189.0 | | 1.0 | | 4440 | | 1.76 | | 1.89 | | -0.13 | |
| | 191.9 | | 192.3 | | 0.4 | | 4444 | | 1.36 | | 1.20 | | 0.16 | |
| | 253.8 | | 254.6 | | 0.8 | | 27955 | | 23.31 | | 23.11 | | 0.20 | |
| | 294.4 | | 295.2 | | 0.8 | | 27959 | | 6.34 | | 6.48 | | -0.14 | |
| | 295.2 | | 296.2 | | 1.0 | | 27960 | | 1.71 | | 1.61 | | 0.10 | |
| | 297.2 | | 298.5 | | 1.3 | | 4446 | | 1.44 | | 1.40 | | 0.04 | |
PM16 | | 140.0 | | 141.5 | | 1.5 | | M9081 | | 0.06 | | 0.03 | | 0.03 | |
| | 266.1 | | 266.5 | | 0.4 | | M9095 | | 113.83 | | 116.57 | | -2.74 | |
| | 266.5 | | 266.9 | | 0.4 | | M9096 | | 25.06 | | 24.99 | | 0.07 | |
| | 266.9 | | 267.5 | | 0.6 | | M9097 | | 9.26 | | 9.09 | | 0.17 | |
| | 269.5 | | 269.9 | | 0.4 | | M9102 | | 15.29 | | 15.33 | | -0.04 | |
| | 290.0 | | 291.0 | | 1.0 | | M9107 | | 0.13 | | 0.10 | | 0.03 | |
PM19 | | 105.0 | | 106.0 | | 1.0 | | M4723 | | 1.78 | | 1.81 | | -0.03 | |
| | 248.0 | | 249.5 | | 1.5 | | M4736 | | 0.02 | | 0.01 | | 0.01 | |
| | 251.5 | | 252.0 | | 0.5 | | M4740 | | 6.16 | | 10.34 | | -4.18 | |
| | 255.0 | | 255.9 | | 0.9 | | M4744 | | 1.07 | | 1.06 | | 0.01 | |
| | 255.9 | | 256.4 | | 0.5 | | M9169 | | 1.68 | | 1.71 | | -0.03 | |
| | 257.4 | | 257.9 | | 0.5 | | M9172 | | 8.57 | | 9.15 | | -0.58 | |
| | 260.7 | | 261.3 | | 0.6 | | M9178 | | 0.31 | | 0.36 | | -0.05 | |
| | 269.0 | | 270.0 | | 1.0 | | M4755 | | 0.09 | | 0.07 | | 0.02 | |
PM21 | | 77.0 | | 78.2 | | 1.2 | | M4761 | | 0.24 | | 0.26 | | -0.02 | |
| | 105.5 | | 106.0 | | 0.5 | | M4767 | | 0.08 | | 0.09 | | -0.01 | |
| | 107.0 | | 107.7 | | 0.7 | | M4769 | | 0.54 | | 0.62 | | -0.08 | |
| | 155.0 | | 156.0 | | 1.0 | | M4776 | | 0.21 | | 0.31 | | -0.10 | |
| | 175.4 | | 176.0 | | 0.6 | | M4790 | | 0.51 | | 0.52 | | -0.01 | |
| | 326.5 | | 327.0 | | 0.5 | | M8154 | | 0.02 | | 0.01 | | 0.01 | |
| | 340.5 | | 341.0 | | 0.5 | | M4858 | | 0.15 | | 0.18 | | -0.03 | |
| | 347.0 | | 347.5 | | 0.5 | | M9276 | | 4.32 | | 4.59 | | -0.27 | |
| | 347.5 | | 347.9 | | 0.4 | | M9277 | | 2.50 | | 2.33 | | 0.17 | |
| | 348.4 | | 348.9 | | 0.5 | | M9279 | | 11.67 | | 13.3 | | -1.63 | |
| | 349.8 | | 350.3 | | 0.5 | | M9282 | | 4.80 | | 5.25 | | -0.45 | |
| | 351.2 | | 351.6 | | 0.4 | | M9285 | | 13.95 | | 12.79 | | 1.16 | |
PM22 | | 90.0 | | 90.5 | | 0.5 | | M4870 | | 0.04 | | 0.03 | | 0.01 | |
14-5
Hole | | From | | To | | Length | | Tag # | | AU_Org | | AU_Check | | Diff (Org-Check) | |
| | 90.5 | | 91.0 | | 0.5 | | M4871 | | 0.48 | | 0.5 | | -0.02 | |
| | 113.0 | | 113.5 | | 0.5 | | M4879 | | 0.14 | | 0.16 | | -0.02 | |
| | 153.5 | | 155.0 | | 1.5 | | M4893 | | 0.19 | | 0.17 | | 0.02 | |
| | 176.0 | | 177.2 | | 1.2 | | M4904 | | 0.15 | | 0.17 | | -0.02 | |
| | 195.5 | | 197.0 | | 1.5 | | M4917 | | 1.30 | | 1.12 | | 0.18 | |
| | 328.0 | | 328.4 | | 0.4 | | M9289 | | 1.61 | | 1.75 | | -0.14 | |
| | 328.8 | | 329.2 | | 0.4 | | M9291 | | 9.35 | | 8.23 | | 1.12 | |
| | 329.7 | | 330.2 | | 0.5 | | M9293 | | 5.97 | | 6.17 | | -0.20 | |
| | 348.0 | | 348.6 | | 0.6 | | M4938 | | 3.33 | | 3.84 | | -0.51 | |
PM25 | | 108.5 | | 109.0 | | 0.5 | | M9369 | | 0.93 | | 0.89 | | 0.04 | |
| | 115.0 | | 115.5 | | 0.5 | | M9376 | | 0.04 | | 0.05 | | -0.01 | |
| | 330.5 | | 331.2 | | 0.7 | | M9243 | | 1.41 | | 1.39 | | 0.02 | |
| | 332.0 | | 332.5 | | 0.5 | | M9213 | | 11.31 | | 10.7 | | 0.61 | |
| | 336.2 | | 337.0 | | 0.8 | | M9221 | | 22.39 | | 20.91 | | 1.48 | |
| | 342.5 | | 343.0 | | 0.5 | | M9233 | | 20.78 | | 22.05 | | -1.27 | |
| | 343.0 | | 343.5 | | 0.5 | | M9234 | | 25.03 | | 26.06 | | -1.03 | |
| | 355.5 | | 356.0 | | 0.5 | | M9421 | | 2.13 | | 2.37 | | -0.24 | |
| | 371.0 | | 371.5 | | 0.5 | | M9427 | | 0.27 | | 0.29 | | -0.02 | |
PM26 | | 85.0 | | 85.5 | | 0.5 | | M9450 | | 2.57 | | 2.64 | | -0.07 | |
| | 97.0 | | 97.7 | | 0.7 | | M9459 | | 0.06 | | 0.03 | | 0.03 | |
| | 311.9 | | 312.5 | | 0.6 | | M9473 | | 0.74 | | 0.56 | | 0.18 | |
| | 314.0 | | 314.4 | | 0.4 | | M9477 | | 9.57 | | 8.57 | | 1.00 | |
| | 315.5 | | 316.2 | | 0.7 | | M9519 | | 0.45 | | 0.44 | | 0.01 | |
| | 322.5 | | 323.0 | | 0.5 | | M9524 | | 0.14 | | 0.15 | | -0.01 | |
| | 336.0 | | 336.5 | | 0.5 | | M9485 | | 1.17 | | 1.30 | | -0.13 | |
| | 338.0 | | 338.5 | | 0.5 | | M9489 | | 11.73 | | 10.97 | | 0.76 | |
| | 338.5 | | 339.0 | | 0.5 | | M9490 | | 11.21 | | 11.66 | | -0.45 | |
| | 340.5 | | 341.0 | | 0.5 | | M9493 | | 4.87 | | 5.38 | | -0.51 | |
| | 344.0 | | 344.7 | | 0.7 | | M9498 | | 2.85 | | 2.88 | | -0.03 | |
PM27 | | 128.0 | | 128.8 | | 0.8 | | M9537 | | 2.54 | | 2.23 | | 0.31 | |
| | 241.5 | | 242.0 | | 0.5 | | M9547 | | 0.02 | | 0.01 | | 0.01 | |
| | 256.0 | | 257.0 | | 1.0 | | M9558 | | 0.16 | | 0.14 | | 0.02 | |
| | 257.4 | | 257.8 | | 0.4 | | M9560 | | 5.42 | | 5.55 | | -0.13 | |
| | 258.2 | | 258.6 | | 0.4 | | M9562 | | 2.85 | | 3.05 | | -0.20 | |
| | 259 | | 259.4 | | 0.4 | | M9564 | | 4.73 | | 4.11 | | 0.62 | |
PM48 | | 17.0 | | 17.5 | | 0.5 | | M1246 | | 0.03 | | 0.01 | | 0.02 | |
| | 113.0 | | 113.5 | | 0.5 | | M1266 | | 0.01 | | 0.02 | | -0.01 | |
| | 114.8 | | 115.2 | | 0.4 | | M1270 | | 3.49 | | 3.29 | | 0.20 | |
| | 118.0 | | 118.5 | | 0.5 | | M1274 | | 0.55 | | 0.52 | | 0.03 | |
| | 196.3 | | 196.7 | | 0.4 | | M1289 | | 0.38 | | 0.24 | | 0.14 | |
| | 203.0 | | 203.6 | | 0.6 | | M1292 | | 2.52 | | 2.74 | | -0.22 | |
| | 234.5 | | 234.9 | | 0.4 | | M1301 | | 3.81 | | 3.01 | | 0.80 | |
| | 234.9 | | 235.3 | | 0.4 | | M1302 | | 4.46 | | 4.39 | | 0.07 | |
14-6
Hole | | From | | To | | Length | | Tag # | | AU_Org | | AU_Check | | Diff (Org-Check) | |
| | 235.7 | | 236.2 | | 0.5 | | M1304 | | 4.8 | | 5.21 | | -0.41 | |
| | 236.2 | | 236.7 | | 0.5 | | M1305 | | 4.18 | | 4.79 | | -0.61 | |
| | 239.2 | | 239.7 | | 0.5 | | M1311 | | 2.23 | | 1.92 | | 0.31 | |
| | 249.3 | | 249.7 | | 0.4 | | M1317 | | 0.09 | | 0.08 | | 0.01 | |
| | 338.5 | | 339.0 | | 0.5 | | M1349 | | 0.13 | | 0.15 | | -0.02 | |
| | 348.4 | | 348.8 | | 0.4 | | M1358 | | 11.04 | | 9.30 | | 1.74 | |
| | 348.8 | | 349.2 | | 0.4 | | M1359 | | 5.21 | | 4.94 | | 0.27 | |
| | 352.5 | | 353.0 | | 0.5 | | M1361 | | 1.82 | | 1.92 | | -0.10 | |
| | 369.5 | | 370.0 | | 0.5 | | M1373 | | 6.92 | | 6.62 | | 0.30 | |
| | 370.5 | | 371.0 | | 0.5 | | M1375 | | 0.11 | | 0.09 | | 0.02 | |
PM51 | | 84.7 | | 85.1 | | 0.4 | | M1675 | | 0.23 | | 0.24 | | -0.01 | |
| | 92.5 | | 93.2 | | 0.7 | | M1684 | | 0.02 | | 0.03 | | -0.01 | |
| | 94.5 | | 95.0 | | 0.5 | | M1688 | | 0.06 | | 0.05 | | 0.01 | |
| | 97.2 | | 98.0 | | 0.8 | | M1692 | | 0.04 | | 0.06 | | -0.02 | |
| | 104.0 | | 105.0 | | 1.0 | | M1697 | | 0.02 | | 0.03 | | -0.01 | |
| | 177.0 | | 177.5 | | 0.5 | | M1720 | | 0.02 | | 0.03 | | -0.01 | |
| | 271.0 | | 271.6 | | 0.6 | | M1741 | | 2.16 | | 2.30 | | -0.14 | |
| | 294.5 | | 295.5 | | 1.0 | | M1744 | | 0.89 | | 0.75 | | 0.14 | |
| | 297.0 | | 297.4 | | 0.4 | | M1748 | | 11.36 | | 11.55 | | -0.19 | |
| | 297.4 | | 297.8 | | 0.4 | | M1749 | | 6.03 | | 5.93 | | 0.10 | |
| | 359.0 | | 359.6 | | 0.6 | | M1770 | | 2.83 | | 2.88 | | -0.05 | |
| | 359.6 | | 360.0 | | 0.4 | | M1771 | | 3.05 | | 2.91 | | 0.14 | |
PMU125-1 | | 17.0 | | 17.5 | | 0.5 | | P7408 | | 4.27 | | 4.15 | | 0.12 | |
| | 23.1 | | 23.4 | | 0.3 | | P7414 | | 0.41 | | 0.48 | | -0.07 | |
| | 28.4 | | 28.7 | | 0.3 | | P7417 | | 0.62 | | 0.54 | | 0.08 | |
| | 155.0 | | 155.5 | | 0.5 | | R19042 | | 11.79 | | 11.76 | | 0.03 | |
| | 243.5 | | 244.0 | | 0.5 | | R19058 | | 5.93 | | 5.97 | | -0.04 | |
| | 247.2 | | 248.0 | | 0.8 | | R19064 | | 2.67 | | 2.32 | | 0.35 | |
| | 311.9 | | 313.4 | | 1.5 | | P7438 | | 0.63 | | 0.69 | | -0.06 | |
| | | | | | | | | | | | | | | |
Length-Weighted Average: | | | | | | | | 3.19 | | 3.22 | | | |
14-7
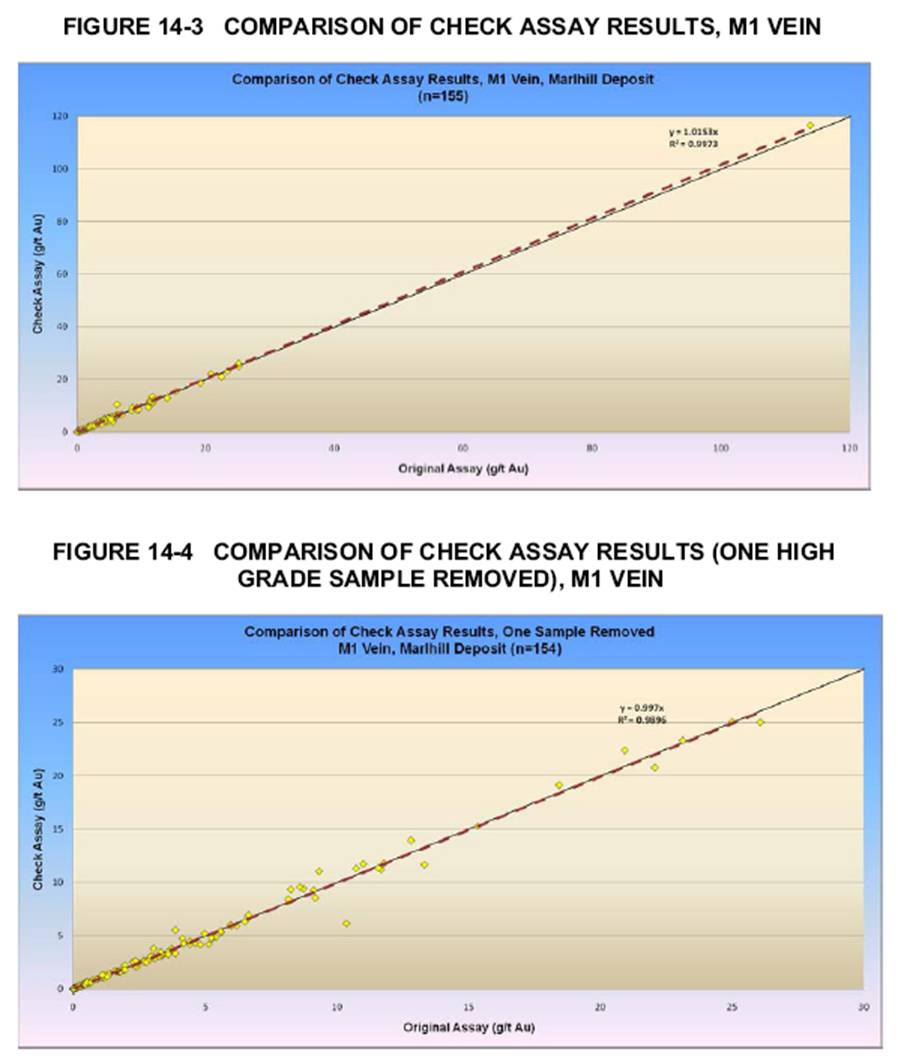
Scott Wilson RPA carried out a small program of check assaying, with a total of 18 samples selected from two of the historical drill holes. The quarter-sawed core samples were sent to the Acme Analytical Laboratories Ltd. (Acme) facility located in Vancouver, British Columbia, where the gold contents were determined using Acme’s G601 method code (crush split and pulverize 250 g of drill core to 200 mesh followed by Fire Assay
14-8
fusion and Inductively Coupled Plasma Emission Spectroscopy (ICP-ES) analysis). The numeric results of these check assays are presented in Table 14-3. Scott Wilson RPA is satisfied that it has independently confirmed the presence of gold in approximately similar quantities as have been historically reported in the selected samples from the Marlhill deposit.
TABLE 14-3 RESULTS OF THE SCOTT WILSON RPA CHECK ASSAYING PROGRAM
Lake Shore Gold Corp. — Marlhill Deposit
Hole ID | | From | | To | | Length | | Sample
No. | | Au_Check | | Au_Org | | Difference
(check-org) | |
PM-6 | | 353.5 | | 354.5 | | 1.0 | | 277704 | | 0.008 | | 0.00 | | 0.008 | |
PM-6 | | 354.5 | | 355.5 | | 1.0 | | 277705 | | 0.003 | | 0.00 | | 0.003 | |
PM-6 | | 355.5 | | 356.0 | | 0.5 | | 277706 | | 1.700 | | 1.82 | | -0.129 | |
PM-6 | | 356.0 | | 356.5 | | 0.5 | | 277707 | | 5.233 | | 9.20 | | -3.967 | |
PM-6 | | 356.5 | | 357.0 | | 0.5 | | 277708 | | 2.533 | | 0.84 | | 1.693 | |
PM-6 | | 357.0 | | 357.5 | | 0.5 | | 277709 | | 1.075 | | 1.78 | | -0.705 | |
PM-6 | | 357.5 | | 358.0 | | 0.5 | | 277710 | | 1.747 | | 1.66 | | 0.087 | |
PM-6 | | 358.0 | | 359.0 | | 1.0 | | 277711 | | 0.057 | | 0.15 | | -0.093 | |
PM-125-1 | | 172.0 | | 172.5 | | 0.5 | | T502851 | | 0.072 | | — | | | |
PM-125-1 | | 172.5 | | 173.0 | | 0.5 | | T502852 | | 0.117 | | — | | | |
PM-125-1 | | 173.0 | | 173.5 | | 0.5 | | R19048 | | 12.37 | | 9.72 | | 2.650 | |
PM-125-1 | | 173.5 | | 174.0 | | 0.5 | | R19049 | | 1.777 | | 0.73 | | 1.047 | |
PM-125-1 | | 174.0 | | 174.5 | | 0.5 | | R19050 | | 2.631 | | 1.13 | | 1.501 | |
PM-125-1 | | 174.5 | | 175.0 | | 0.5 | | R19051 | | 5.415 | | 5.24 | | 0.175 | |
PM-125-1 | | 175.0 | | 175.5 | | 0.5 | | R19052 | | 4.530 | | 3.09 | | 1.440 | |
PM-125-1 | | 175.5 | | 176.0 | | 0.5 | | R19053 | | 5.787 | | 9.5 | | -3.713 | |
PM-125-1 | | 176.0 | | 176.5 | | 0.5 | | T502853 | | 0.859 | | — | | | |
PM-125-1 | | 176.5 | | 177.0 | | 0.5 | | T502854 | | 0.051 | | — | | | |
Scott Wilson RPA’s data verification activities included a program of spot checking of the drill hole database. For this program, approximately 10% of the drill holes contained within the Marlhill database were selected for validation on a semi-random basis. The information contained in the drill logs for the selected holes was compared against the information contained in the digital database. No errors were identified which Scott Wilson RPA considers to be material.
14-9
As a result of its data validation efforts, Scott Wilson RPA believes that the historical drill hole data that was obtained for the M1 vein at the Marlhill deposit is appropriate for use in the preparation of mineral resource estimates.
14-10
15 ADJACENT PROPERTIES
The Marlhill Mine is situated on the New Mines Trend, 0.8 km northeast of the past producing, and recently reactivated, Bell Creek Mine, 2.8 km west of the centre of Goldcorp’s past producing Owl Creek Pit, and five kilometres west of Goldcorp’s operating Hoyle Pond Mine. The term New Mines Trend was coined by PFV and Kinross to promote and describe the area of the Hoyle antiform and synform which hosts significant past production and unexploited Mineral Resources and Reserves.
Gold mineralization was first discovered in 1980 to 1981 on the Bell Creek Mine property by a joint venture between Rosario and DuPont at, what is now known as, the North A and Northeast zones. The Bell Creek West Zone was discovered in 1989.
Canamax was operator from 1986 to 1991. Falconbridge Gold operated Bell Creek from 1991 to 1992, followed by Kinross until closure in 1994. The mine was kept on care and maintenance until 2001 when it was allowed to flood. Bell Creek produced at a rate of 380 tpd and was reported to have produced 576,000 short tons of ore at a grade of 0.197 oz/ton (6.13 g/t) Au using vertical sublevel retreat, longhole, and shrinkage mining methods. This includes some ore from Marlhill. The bulk of the production was derived from the North A Zone where mining occurred on multiple levels (Butler, 2008). Table 15-1, from Pressacco (1999), summarizes historical ore production from Bell Creek.
TABLE 15-1 BELL CREEK HISTORICAL PRODUCTION
Lake Shore Gold Corp. — Bell Creek Deposit
| | Short Tons | | Grade | | Recovered | | | |
Year | | Produced | | (opt Au) | | Ounces Au | | Remarks | |
1987 | | 55,180 | | 0.173 | | 9,558 | | Mill commissioned in July | |
1988 | | 135,324 | | 0.195 | | 24,648 | | 93.4% mill recovery | |
1989 | | 146,727 | | 0.203 | | 29,786 | | 94% mill recovery, includes Marlhill ore | |
1990 | | 66,666 | | 0.206 | | 13,728 | | Excludes 82,200 tons of Marlhill ore | |
1992 | | 138,171 | | 0.195 | | 26,880 | | Includes co-mingled Marlhill ore | |
1992 | | 5,030 | | 0.223 | | 1,112 | | | |
1993 | | Limited | | — | | — | | | |
1994 | | 33,899 | | 0.207 | | 7,017 | | | |
Total | | 576,017 | | 0.197 | | 112,739 | | | |
15-1
TABLE 15-2 OTHER NEW MINES TREND PRODUCTION
Lake Shore Gold Corp. — Bell Creek Deposit
Deposit | | Years | | Workings | | Oz Produced | |
Owl Creek | | 1981 to 1989 | | Open Pit | | 268,587 | |
Hoyle Pond | | 1985 to 2009 | | Underground | | 2,690,184 | |
Scott Wilson RPA has been unable to verify the information presented above, and notes that this information is not necessarily indicative of the mineralization on the property that is the subject of the Technical Report.
15-2
16 MINERAL PROCESSING AND METALLURGICAL TESTING
Metallurgical testing on Marlhill mineralization was first completed for Canamax in 1986 by Lakefield Research of Canada Ltd. (Lakefield).
Test work was conducted on two composite samples (M2 and M3) and included Head Analyses, Direct Cyanidation, Flotation, and Cyanidation of the Flotation Concentrate, summarized in Tables 16-1 to 16-4.
TABLE 16-1 SUMMARY OF HEAD ANALYSES
Lake Shore Gold Corp. — Marlhill Deposit
| | | | | | Composite | | Composite | |
Head Analysis | | Element | | units | | M2 | | M3 | |
Gold | | Au | | g/t | | 31.00, 27.90 | | 12.00, 9.49 | |
| | Average | | g/t | | 29.50 | | 10.70 | |
Silver | | Ag | | g/t | | 5.40 | | 2.00 | |
Sulphur | | S | | % | | 0.59 | | 0.76 | |
Iron | | Fe | | % | | 6.10 | | 4.55 | |
Copper | | Cu | | % | | 0.005 | | 0.005 | |
Lead | | Pb | | % | | 0.002 | | <0.002 | |
Zinc | | Zn | | % | | 0.006 | | 0.006 | |
Arsenic | | As | | % | | 0.11 | | 0.17 | |
Graphite Carbon | | C | | % | | 0.06 | | <0.05 | |
Pyrite | | Py | | % | | 1.10 | | 1.42 | |
Pyrrhotite | | Po | | % | | <0.10 | | <0.10 | |
A brief description of results is derived from Lakefield (1986).
The average calculated gold head assays of Composite M2 and M3 were 21.9 g/t Au and 9.07 g/t Au respectively.
Tests were conducted to investigate the recovery of gold by direct cyanidation. A sample of each composite was ground and split into two similar charges. Duplicate cyanidations were performed at 33 % solids in bottles on rolls. The samples were pre-aerated maintaining 0.5 g/L CaO for 6 hours then leached for 24 hours maintaining 0.5 g/L NaCN. A sample of the residue was removed for assaying. The remaining residue was amalgamated and the amalgamation tailing was assayed for gold. One tailing sample of each composite was screened at 200 mesh and the under-size fraction was assayed for gold.
The results are presented in Table 16-2.
16-1
TABLE 16-2 DIRECT CYANIDATION RESULTS
Lake Shore Gold Corp. — Marlhill Deposit
| | | | Tailings % | | Reagent
Cons. (kg/t) | | % Au Recovery | | Residue, g/t Au | | Head |
Test
No. | | Comp. | | -200 Mesh | | NaCN | | CaCO | | Cyanide
Only | | Cyanide
+ Hg | | After
Cyn. | | After Amal.
O’all | | After Amal.
- 200 M | | (Calc)
Au g/t |
31 | | M2 | | 68 | | 0.1 | | 1.3 | | 94.7 | | 97.9 | | 1.14 | | 0.46 | | 0.3 | | 21.7 |
32 | | M2 | | 68 | | 0.1 | | 1.34 | | 84.7 | | 98.0 | | 4.89 | | 0.57 | | — | | 27.6 |
33 | | M3 | | 63 | | 0.04 | | 1.26 | | 92.9 | | 93 | | 0.69 | | 0.68 | | 0.6 | | 9.76 |
34 | | M3 | | 63 | | 0.1 | | 1.04 | | 92.8 | | 93.3 | | 0.65 | | 0.61 | | — | | 9.06 |
Flotation tests were performed on each composite in duplicate to investigate the recovery of gold in a sulphide concentrate. Samples were ground to 70% minus 200 mesh. A xanthate mixture and Aerofloat 25 were applied as collectors and pine oil as a frother to recover a rougher and scavenger concentrate. The concentrates were combined and cleaned once with no further reagent additions. A sample of the scavenger tailing was removed for assaying. The remainder was amalgamated and resampled for gold assaying. Metallurgical balances were calculated based on the tailings assay before and after amalgamation. The recovery of gold from Composites M2 and M3 by flotation was 91% and 88% respectively.
The recovery of gold by cyanidation of the flotation concentrate was investigated. Each cleaner concentrate was reground for 5 min/100 g in a pebble mill and pre-aerated in a lime solution for 20 hours. Cyanide was added and maintained at 0.8 g/L NaCN for the 72 hour leach period.
The overall recovery of gold by the two flowsheets is compared in Table 16-3.
TABLE 16-3 COMPARISON OF GOLD RECOVERY BY FLOWSHEET
Lake Shore Gold Corp. — Marlhill Deposit
Composite | | Direct Cyanidation | | Flotation + Concentrate
Cyanidation |
M2 | | 95 | | 90 |
M3 | | 93 | | 86 |
Additional analyses were performed on the cyanidation residue yielding the results presented in Table 16-4.
16-2
TABLE 16-4 RESULTS FROM ADDITIONAL ANALYSES ON
CYANIDATION RESIDUE
Lake Shore Gold Corp. — Marlhill Deposit
| | | | | | Composite M2 | | Composite M3 |
Element | | | | units | | Residue | | Residue |
Silver | | Ag | | g/t | | 5.0 | | 7.4 |
Sulphur | | S | | | % | 18.7 | | 17.7 |
Iron | | Fe | | | % | 21.8 | | 20.3 |
Copper | | Cu | | | % | 0.12 | | 0.075 |
Lead | | Pb | | | % | 0.012 | | 0.005 |
Zinc | | Zn | | | % | 0.039 | | 0.034 |
Graphite-Carbon | | C | | | % | 0.23 | | 0.13 |
Pyrite | | Py | | | % | 34.6 | | 32.9 |
Pyrrhotite | | Po | | | % | <0.10 | | <0.10 |
Complete results of the test work are documented in a report by Lakefield titled “An Investigation of the Recovery of Gold from Samples Submitted by Canamax Resources Incorporated, Progress Report No 2. Project No. LR 2998, August 29, 1986”.
16-3
17 MINERAL RESOURCE AND MINERAL RESERVE ESTIMATES
MINERAL RESOURCES
SUMMARY
Scott Wilson RPA prepared a Mineral Resource estimate for the M1 vein system based on historical drill information. The Mineral Resource estimate has been prepared for the M1 vein only as attempts to model other minor veins sets were unsuccessful. The Mineral Resource estimate is presented in Table 17-1.
TABLE 17-1 SUMMARY OF THE ESTIMATED MINERAL RESOURCES FOR
THE M1 VEIN
Lake Shore Gold Corp. — Marlhill Deposit
| | | | Capped Grade | | |
Category | | Tonnes | | (g/t Au) | | Oz Au |
Measured | | –– | | –– | | –– |
Indicated | | 395,000 | | 4.52 | | 57,400 |
Measured & Indicated | | 395,000 | | 4.52 | | 57,400 |
Inferred | | –– | | –– | | –– |
Notes:
1. CIM definitions were followed for classification of Mineral Resources.
2. Mineral Resources are estimated at a cut-off grade of 2.9 g/t Au.
3. Mineral Resources are estimated using an average long-term gold price of US$1,184 per ounce, and a US$/C$ exchange rate of 0.95.
4. A minimum mining width of approximately two metres was used.
5. Capped gold grades are used in estimating the Mineral Resource average grade.
6. Sums may not add due to rounding.
7. Mr. Reno Pressacco, M.Sc.(A), P.Geo., is the Qualified Person for this resource estimate.
There are no Mineral Reserves present on the property as of the date of this Technical Report.
DESCRIPTION OF THE DATABASE
A digital database was provided to Scott Wilson RPA by Lake Shore Gold containing drill hole information such as collar location, downhole survey, lithology, and assays in comma delimited format. The cut-off date for the drill hole database was August 5, 2010. All of the drill hole information contained in this database comprise historical data
17-1
that was gathered by such prior operators as Canamax and PFV. Lake Shore Gold has not completed any new drill holes on the Property except for drilling of four holes in the fall 2010 that are reported to have essentially no impact on the current resource estimate. The drilling completed by Canamax was carried out on a local (geology) grid coordinate system, while the drilling completed by PFV was carried out using the nearby Bell Creek engineering (metric) grid coordinate system. The coordinates of all drill holes carried out on the local grid coordinate system (the Canamax vintage drill holes) were converted to the engineering grid coordinate system
This drill hole information was modified slightly so as to be compatible with the format requirements of the Gemcom-Surpac v.6.1.4 mine planning software and was imported into that software package. A number of additional tables were created during the process of creating a grade block model of the mineralization found at the Marlhill deposit to store such information as composite assays, zone composites, and assorted domain codes. A description of the revised database is provided in Table 17-2 and a summary of the drill hole collar information and a plan-view sketch showing the drill hole locations and mineralized domains is provided in Figure 17-1.
TABLE 17-2 SUMMARY OF THE DRILL HOLE DATABASE (AS AT AUGUST 5, 2010)
Lake Shore Gold Corp. — Marlhill Deposit
Table Name | | Data Type | | Table Type | | No. of Records |
assay_org2 | | interval | | time-independent | | 15,394 |
collar | | | | | | 367 |
comps_1m | | interval | | time-independent | | 359 |
litho | | interval | | time-independent | | 2,993 |
styles | | | | | | 37 |
survey | | | | | | 1,843 |
17-2
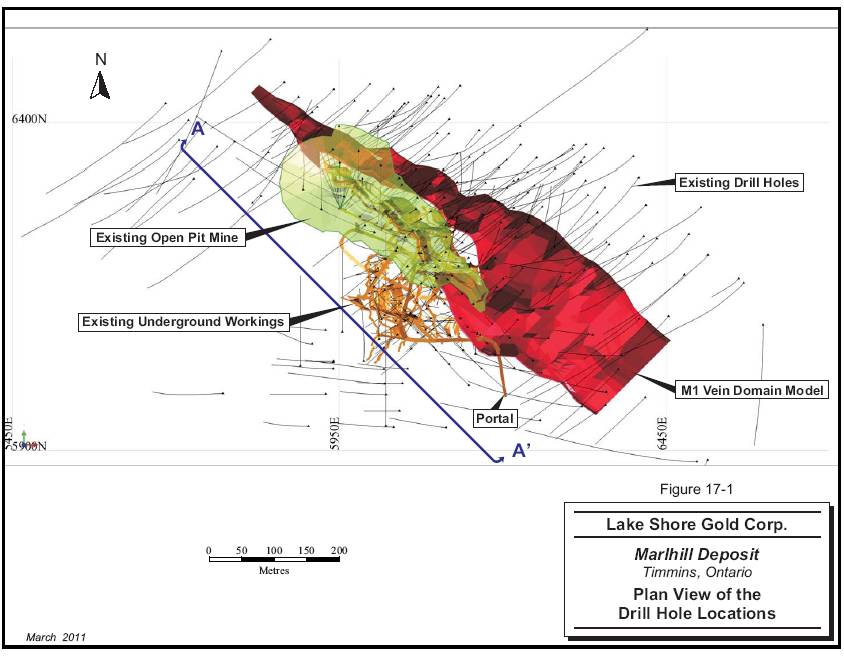
17-3
GEOLOGICAL DOMAIN INTERPRETATIONS
A description of the nature of the gold mineralization encountered by previous operators has been presented by Pressacco (1999), and is excerpted below:
Kent (1990) describes the mineralization and attendant alteration at Marlhill as follows:
“...mineralization consists of a 0.1 to three metre wide central quartz vein, which contains two to five percent fine-grained pyrite, arsenopyrite, and rarely visible gold. Gold occurs as plates on the surfaces of the sulphide minerals, but shows a preference for arsenopyrite. Significant amounts of brown tourmaline (dravite) occur in all veins. Where white mica and sulphides commonly occur on slips and fractures within the vein, gold tenor generally attains economic values. A sericite-sulphide halo extends up to one metre from the vein. Only about 10 to 20 percent of the gold occurs associated with this wall rock sulphide. Coarse to medium grained cubic pyrite extends farther away from the vein margin, into the host mafic metavolcanic rocks.”
Personal observation of selected diamond drill core by the author and discussions with Pentland Firth staff have shown that the alteration style described above is accurate (G. Yule, Pentland Firth Ventures Ltd., personal communication). However a more pervasive, fine-grained sericite—carbonate alteration is commonly present surrounding the veins and vein systems, forming an envelope of incipient to moderate alteration measuring up to 30m in width, with strong sericite-(carbonate) alteration occurring immediately adjacent to the veins. Carbonate alteration often displays a typical zonation pattern in the nature of the carbonate species from calcite in the outer reaches of the envelope, changing to ankerite inwards towards the veins (G. Yule, Pentland Firth Ventures Ltd., personal communication). These two alteration minerals cause a color change in the host mafic volcanic rocks from a light to medium green-grey to a dull, waxy, earthy brown colour on the fresh surface, and a medium yellow-brown rusty colour on the weathered surface.
Presently there are 8 known mineralized quartz veins at Marlhill, all of which are hosted within the mafic volcanic rocks. All of these veins strike either in a northwesterly direction (M1, BR1, and BR2 Veins) or in a northerly direction (M2, M2.5, M3, M5, and M7 Veins). All of the veins dip to the northeast and east. The M1 vein dips north at approximately 60o at surface and steepens into a near vertical orientation below the —200 metre level. The remaining veins dip eastward at approximately 40o thereby creating a branching and bifurcating pattern. All veins have been affected by folding that has thickened the veins in steeply easterly plunging fold closures. Of these veins, the M1 Vein has been the focus of attention and has been traced continuously in mine workings for a minimum strike length of 300 metres, and to a depth of 530 metres by diamond drilling. It attains widths of up to 3.6 metres. In describing the results of his review of the underground geology plans Barclay (1994) writes:
“At macroscopic scale, the M1, M2, and M3 Veins as presently defined crosscut stratigraphy. They typically splay into branching spurs that may extend from a
17-4
main through going vein at low or high angles, or may coalesce around large blocks of host rock. They contain breccia clasts of wallrock which is typically mineralized, as is wallrock immediately contiguous to the veins [Figure 17-2]. These veins, particularly M2 and M3, are cut by a secondary ENE-striking set observed on surface as described below. The veins are further cut by late, often shallow—dipping slips or joints which may be lined with calcite and / or dolomite, or mica.
“Locally the veins are described as being highly folded. Fold axes which have been measured underground generally plunge 45 — 60__, ENE — ESE. Plan map traces of the individual veins underground confirm that M1, M2, and M3 all locally roll into metre — scale moderately East — plunging folds. These observations are closely consistent with surface data.
Each of the M1, M2, and M3 Veins reportedly contains tourmaline and ankerite [Figures 17-3, 17-4 and 17-5]. Visible gold is commonly noted in assay plans along each of them: indeed it likely elevates background 2 — 4 g/t material into ore. The veins also contain, or are flanked along contact alteration haloes, by disseminated pyrite and arsenopyrite. Minor sphalerite and pyrrhotite and / or hydromuscovite are less commonly reported.”
17-5
FIGURE 17-2 M1 VEIN CONTAINING BRECCIATED, SILICEOUS MAFIC
VOLCANIC FRAGMENTS.
-100 m Level, West End of Marlhill Mine
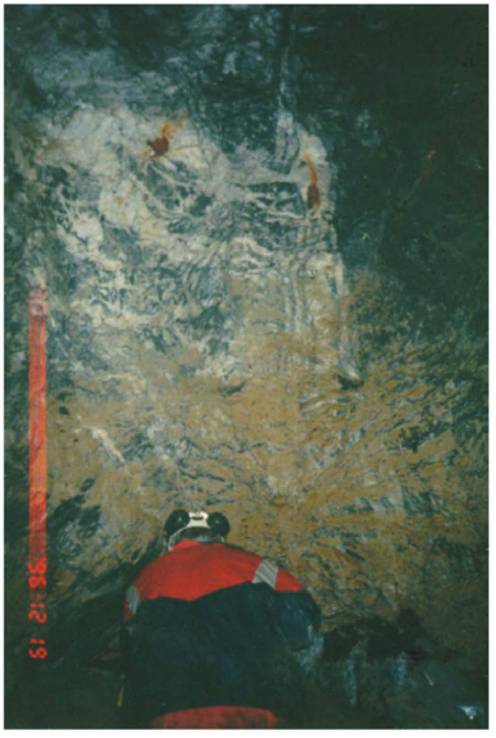
Photo taken from Pressacco (1999)
17-6
FIGURE 17-3 M1 VEIN SHOWING WELL DEVELOPED BANDING
Dark Material is Semi-Massive Tourmaline Occurring in the Vein as Bands (A) and in the Wall Rock as Stockwork (B). -150 m Level.
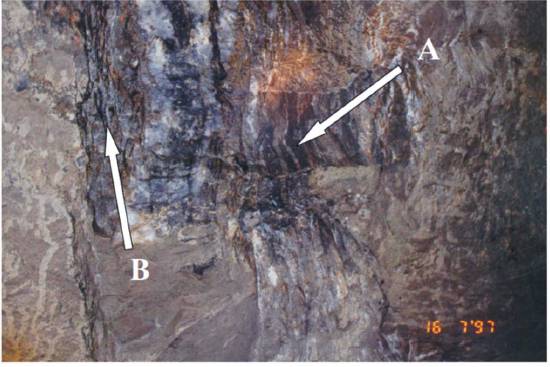
(Photo courtesy of PFV)
17-7
FIGURE 17-4 M1 VEIN SHOWING WELL DEVELOPED BRECCIA TEXTURE DEFINED BY TOURMALINE STOCKWORK
Rock Bolt (A) For Scale. -150 m Level.
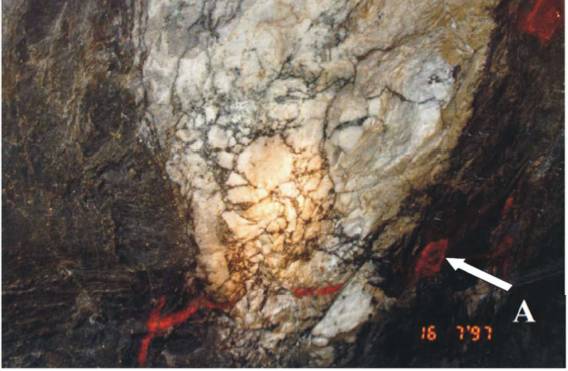
Photo taken from Pressacco (1999)
17-8
FIGURE 17-5 M1 VEIN SHOWING TOURMALINE STOCKWORK AND
ALTERED MAFIC VOLCANIC WALL ROCK INCLUSIONS (A)
Note: Coarse Disseminated Pyrite In Wall Rock (B). -150m Level, View of the Back.
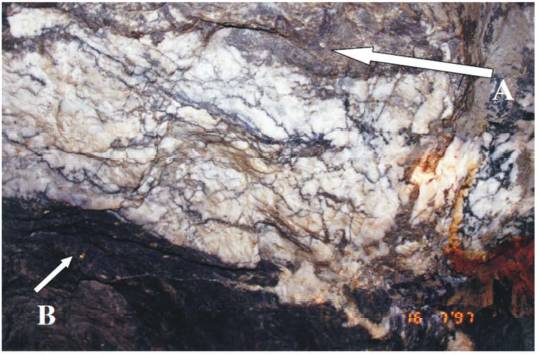
Photo taken from Pressacco (1999)
Interpretation of the geological and mineralization features associated with the gold mineralization found at the Marlhill deposit was carried out according to the most current understanding and level of knowledge by Ralph Koch, Chief Geologist, Bell Creek Mine. The interpretation was reviewed by Reno Pressacco, Senior Consulting Geologist, Scott Wilson RPA, for accuracy and validity in light of the current understanding of the vein geometries. In all, interpretation of the position of the M1 vein was carried out on a total of 56 cross sections oriented in a northeast-southwest direction and spaced 15 m apart (± 7.5 m viewing window). The locations of the vein contacts were “snapped” to the observed location in the individual drill holes such that the sectional interpretations “wobbled” in three-dimensional space, to either side of the section plane. The position and geometry of the M1 vein was interpreted using all available information from such sources as detailed mapping in the open pit mine, detailed maps of the vein location obtained from the historical level plans of the Marlhill Mine, and information contained within the drill hole database. Attempts to model the locations and extents of the minor vein sets were not successful due to the limited areal extent of those veins as evidenced from the existing underground exposures and due to the limited amount of detailed drill
17-9
hole information. Following completion of the solid model of the M1 vein, a separate clipping polygon was created which was then used to remove that part of the domain model in and about the existing mine workings so as to ensure that no part of the Mineral Resource estimate falls within the area of the previous mine workings. A longitudinal view of the resulting solid volume of the M1 vein is presented in Figure 17-6.
HISTORICAL MINE WORKINGS
As described earlier in this report, mining activities have taken place at the Marlhill Mine through the 1989-1991 period. The mine was dewatered during the 1996-1997 period to permit the completion of underground-based diamond drilling programs, but no further gold-bearing material was excavated at that time. Underground access to the mine is via a ramp driven at a grade of —17%. Three main production levels were established at the -50 m, -100 m, and the -150 m elevations. Sublevels were established at 25 m intervals between levels to provide access to individual stoping blocks. Shrinkage stoping was the only mining method employed at the mine, and the ore was commingled with the Bell Creek Mine ore. No backfill was used and the stopes remained open upon their completion (Pressacco, 1999). Additional gold-bearing material was recovered from the crown pillar of the M1 vein by means of an open pit mine excavated in 2002.
A digital model of the underground voids was prepared by previous operators using all available survey information at the time. The underground mine was excavated using the Bell Creek mine grid as their survey control. A digital model of the open pit mine was prepared by Lake Shore Gold staff using survey information obtained from previous owners of the property, who used the Bell Creek engineering grid as their survey control.
17-10
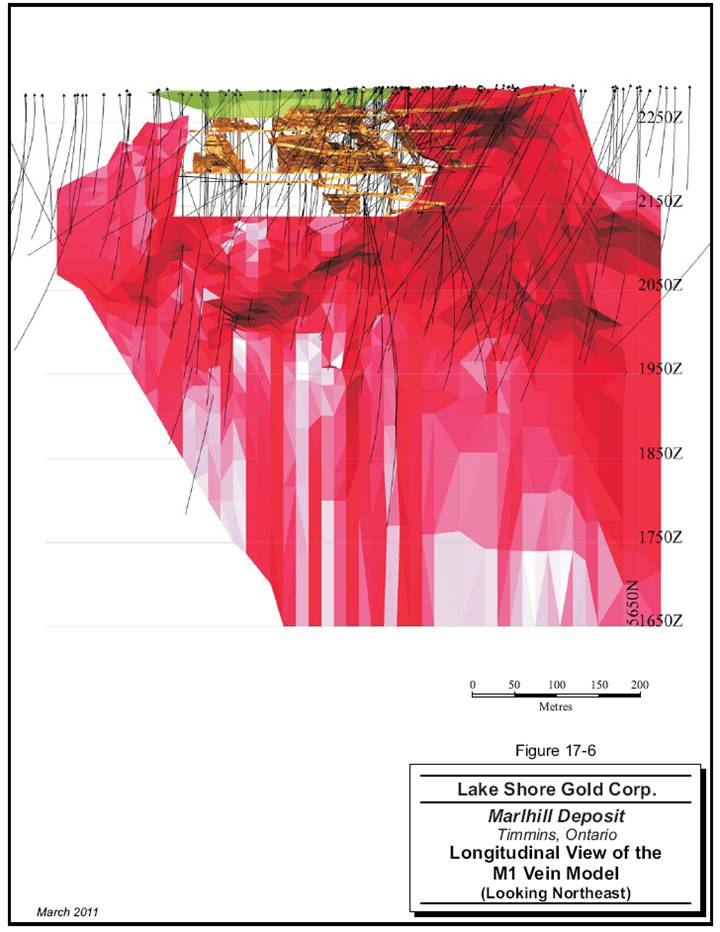
17-11
GRADE CAPPING
In Scott Wilson RPA’s experience, the influence of high grade assays must be addressed during the preparation of a mineral resource estimate, as many instances have occurred in the industry where the average grade of a deposit has been over-estimated due to the typically limited continuity of such high values. Several methods are currently in common use by industry practitioners and include grade capping (also known as top cutting), restricting the influence of high grade assays during the estimation of block grades, or indicator kriging methods. Scott Wilson RPA believes that application of a grade cap is an appropriate approach for this assignment to deal with high grade assay values in order to prevent undue bias in the average grade of the mineral resource estimate.
All samples contained within the three-dimensional solid model of the M1 vein domain model were coded in the database and extracted for analysis. A normal histogram was generated from this extraction file (Figure 17-7) and the descriptive statistics of the sample data set were generated.
FIGURE 17-7 HISTOGRAM OF RAW ASSAY VALUES, M1 VEIN
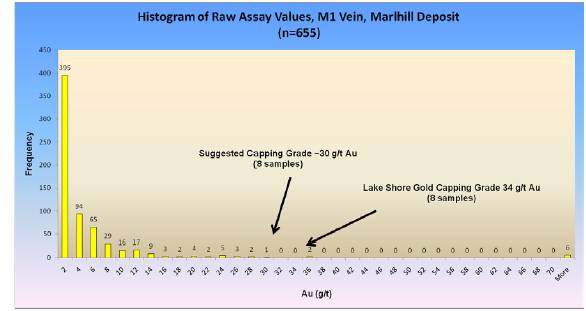
The grade caps were selected by examining the histogram for the grade at which outlier assays begin to occur. These are generally identified by breaks in slope of the probability plots or gaps in the bins of histograms. As can be seen, a capping value of
17-12
30 g/t Au is clearly indicated for the M1 vein data set, resulting in the grades of eight samples being capped. Lake Shore Gold has elected to apply a capping value of 34 g/t Au (approximately 1 oz/ton Au), which is the historical capping value that has been applied to the deposits in the Timmins camp over the past 100 years.
A comparison of the descriptive statistics for the capped and uncapped raw gold assays for the M1 vein domain model is presented in Table 17-3. It can be seen that the application of a capping grade of 34 g/t Au to the assays contained within the M1 vein domain model reduces the length-weighted average grade from 2.61 g/t Au to 1.94 g/t Au. Application of a capping value of 30 g/t Au to this data set reduces the length-weighted average grade to 1.91 g/t Au. Scott Wilson RPA believes that no material difference has resulted in the average grade of the data set as a result of application of this higher capping value of 34 g/t Au rather than 30 g/t Au as suggested from the histogram plot.
TABLE 17-3 SUMMARY STATISTICS FOR UNCAPPED AND CAPPED
ASSAYS
Lake Shore Gold Corp. — Marlhill Deposit
| | | | Capped | | Capped | |
Item | | Uncapped | | (34 g/t Au) | | (30 g/t Au) | |
Arithmetic Mean | | 4.43 | | 3.34 | | 3.29 | |
Length-Weighted Mean | | 4.09 | | 3.04 | | 3.00 | |
Standard Error | | 0.65 | | 0.23 | | 0.22 | |
Median | | 1.19 | | 1.19 | | 1.19 | |
Mode | | 0.01 | | 0.01 | | 0.01 | |
Standard Deviation | | 16.53 | | 5.74 | | 5.49 | |
Coefficient of Variation-Arithmetic | | 3.73 | | 1.72 | | 1.67 | |
Coefficient of Variation-Weighted | | 4.04 | | 1.89 | | 1.83 | |
Sample Variance | | 273.31 | | 32.99 | | 30.14 | |
Kurtosis | | 159.43 | | 11.81 | | 9.63 | |
Skewness | | 11.63 | | 3.19 | | 2.94 | |
Range | | 272.88 | | 34.00 | | 30.00 | |
Minimum | | 0.00 | | 0.00 | | 0.00 | |
Maximum | | 272.88 | | 34.00 | | 30.00 | |
Sum | | 2856.37 | | 2155.21 | | 2123.21 | |
Count | | 645 | | 645 | | 645 | |
17-13
COMPOSITING METHODS
All samples contained within the M1 vein domain model were composited using the fixed-length method. In this method, the composite sample lengths for a given drill hole intersection are adjusted so as to yield a set of equal length composite samples across the width of a mineralized zone. By comparison, the traditional method of applying a constant composite sample length downhole along the length of the drill hole (e.g., 1.5 m) typically results in one sample along the footwall contact which will not be a full length sample. This outcome is avoided by using the fixed-length method and Scott Wilson RPA believes that this method is appropriate for use in such narrow-vein types of deposit types. A histogram of the resulting fixed-length composite sample lengths is provided in Figure 17-8. A comparison of the descriptive statistics for the capped and uncapped composited gold assays for the M1 vein domain is presented in Table 17-4.
TABLE 17-4 SUMMARY STATISTICS FOR COMPOSITED GOLD ASSAYS
WITHIN THE M1 VEIN DOMAIN MODEL
Lake Shore Gold Corp. — Marlhill Deposit
| | Uncapped | | Capped (34 g/t) | |
| | Composites | | Composites | |
Item | | (g/t Au) | | (g/t Au) | |
Arithmetic Mean | | 4.17 | | 3.07 | |
Length-Weighted Mean | | 4.19 | | 3.09 | |
Standard Error | | 0.67 | | 0.23 | |
Median | | 1.49 | | 1.49 | |
Mode | | 0.00 | | 0.00 | |
Standard Deviation | | 12.57 | | 4.38 | |
Coefficient of Variation-Arithmetic | | 3.01 | | 1.42 | |
Coefficient of Variation-Weighted | | 3.00 | | 1.42 | |
Sample Variance | | 158.00 | | 19.16 | |
Kurtosis | | 138.64 | | 7.35 | |
Skewness | | 10.51 | | 2.44 | |
Range | | 187.68 | | 30.41 | |
Minimum | | 0.00 | | 0.00 | |
Maximum | | 187.68 | | 30.41 | |
Sum | | 1,460.87 | | 1,075.75 | |
Count | | 350 | | 350 | |
17-14
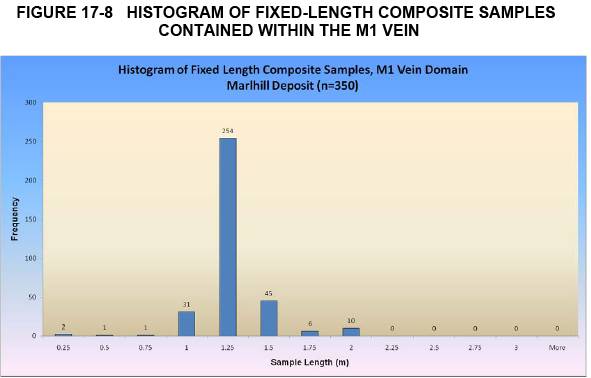
BULK DENSITY
Scott Wilson RPA has carried out a small program of bulk density measurements on samples of the M1 vein mineralized material taken from the remaining historical drill core. A total of 18 drill core samples from two drill holes were selected and shipped to the Acme facility located in Vancouver, British Columbia. The bulk densities of the samples were determined using Acme’s G8SG method based on water displacement. The numeric results are presented in Table 17-5 and are graphically illustrated in Figure 17-9.
It can be seen that an average bulk density of 2.73 t/m3 is suggested from this data set.
TABLE 17-5 BULK DENSITY RESULTS
Lake Shore Gold Corp. — Marlhill Deposit
Drill Hole | | Sample | | Type | | From | | To | | Au (g/t) | | Lithology | | Density | |
PM-6 | | 27704 | | Drill Core | | 353.5 | | 354.5 | | 0.00 | | MVOL | | 2.76 | |
PM-6 | | 27705 | | Drill Core | | 354.5 | | 355.5 | | 0.00 | | MVOL | | 2.70 | |
PM-6 | | 27706 | | Drill Core | | 355.5 | | 356.0 | | 1.82 | | Qbx-Carb | | 2.72 | |
PM-6 | | 27707 | | Drill Core | | 356.0 | | 356.5 | | 9.43 | | Qbx-Carb | | 2.61 | |
PM-6 | | 27708 | | Drill Core | | 356.5 | | 357.0 | | 0.84 | | MVOL | | 2.59 | |
17-15
PM-6 | | 27709 | | Drill Core | | 357.0 | | 357.5 | | 1.78 | | MVOL | | 2.86 | |
PM-6 | | 27710 | | Drill Core | | 357.5 | | 358.0 | | 1.65 | | MVOL | | 2.71 | |
PM-6 | | 27711 | | Drill Core | | 358.0 | | 359.0 | | 0.15 | | MVOL | | 2.71 | |
PM-125-1 | | T502851 | | Drill Core | | 172.0 | | 172.5 | | | | MVOL | | 2.72 | |
PM-125-1 | | T502852 | | Drill Core | | 172.5 | | 173.0 | | | | MVOL | | 2.76 | |
PM-125-1 | | R19048 | | Drill Core | | 173.0 | | 173.5 | | 9.72 | | MVOL | | 2.90 | |
PM-125-1 | | R19049 | | Drill Core | | 173.5 | | 174.0 | | 0.73 | | MVOL | | 2.80 | |
PM-125-1 | | R19050 | | Drill Core | | 174.0 | | 174.5 | | 1.13 | | MVOL | | 2.58 | |
PM-125-1 | | R19051 | | Drill Core | | 174.5 | | 175.0 | | 5.24 | | MVOL | | 2.72 | |
PM-125-1 | | R19052 | | Drill Core | | 175.0 | | 175.5 | | 3.09 | | MVOL | | 2.68 | |
PM-125-1 | | R19053 | | Drill Core | | 175.5 | | 176.0 | | 9.50 | | MVOL | | 2.66 | |
PM-125-1 | | T502853 | | Drill Core | | 176.0 | | 176.5 | | | | MVOL | | 2.79 | |
PM-125-1 | | T502854 | | Drill Core | | 176.5 | | 177.0 | | | | MVOL | | 2.83 | |
FIGURE 17-9 HISTOGRAM OF BULK DENSITY RESULTS, M1 VEIN

TREND ANALYSIS
As an aid in carrying out a variography study of the continuity of the gold grades at the M1 vein, Scott Wilson RPA conducted a short study of the overall trends that may be present. For this exercise, a data file was prepared that contained the average gold grade across the entire width of the mineralized vein for each drill hole that pierced the M1 vein domain model. The resulting gold grades were hand-contoured on a longitudinal projection and the results are shown in Figure 17-10.
17-16
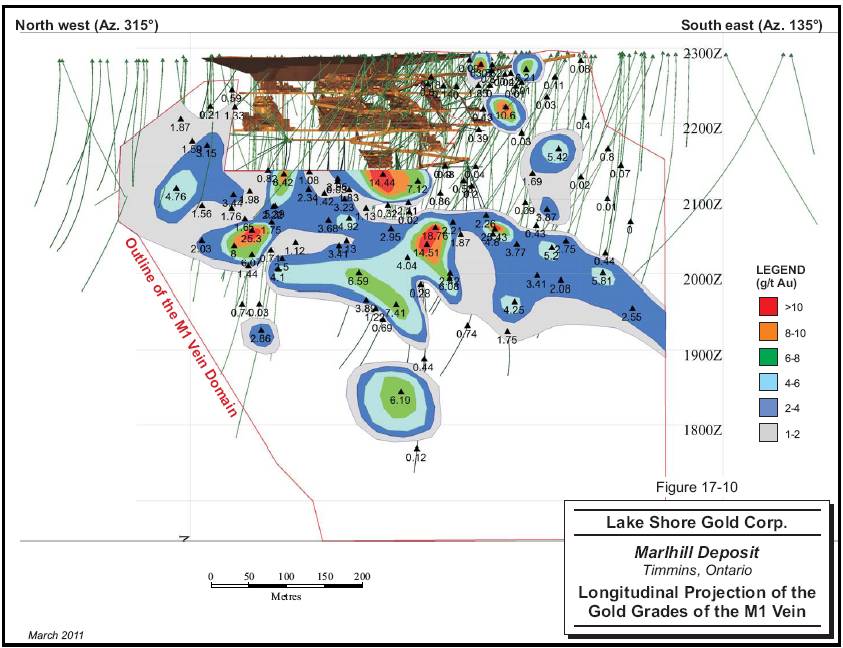
17-17
By their nature, hand-contoured plots are subjective interpretations of the continuity of gold mineralization between adjacent observation points, and alternate interpretations are always possible. In regard to the M1 vein, an attempt was made at the outset of the contouring exercise to prepare the contours based on the pre-existing understanding of the continuity of the gold grades (i.e., steeply southeast plunging shoots). However, it quickly became clear that an alternate trend is apparent in the gold grades. The outline of the 1 g/t Au contour, and, to a lesser degree, the 2 g/t Au contour, indicates that a shallow southeast orientation (approximately -20° to azimuth 135°) is present in the gold grades contained within the M1 vein below the lowermost level of the Marlhill Mine. At first glance, this orientation appears discordant with the observed trends at many of the gold deposits in the Timmins area, however, examination of the structural information presented in Pressacco (1999) suggests that the observed shallow southeast plunge may be paralleling an F1 fold axis. A second, more steeply southeast plunging orientation is suggested by the higher grade contours.
VARIOGRAPHY
The analysis of the variographic parameters of the mineralization found in the mineralized domains for the M1 vein domain model began with the construction of downhole and omni-directional variograms using the capped, composited sample data with the objective of determining an appropriate value for the global nugget (C0). An evaluation of other anisotropies that may be present in the data resulted in successful variograms for the down-plunge direction for the M1 vein domain with a good model fit that identified a range of approximately 40 m. Efforts to identify the across-plunge anisotropy did not result in a successful variogram model.
BLOCK MODEL CONSTRUCTION
An upright, rotated, partial percentage block model (i.e., the percentage of any block that is contained within the domain model is used to weight the volume and tonnage reports) with the long axis of the blocks oriented along an azimuth 135° (Figure 17-11) and dipping vertically (i.e., -90°) was constructed using the GEMS v.6.2.3 software package and the parameters presented in Table 17-6. A number of attributes were also created to store such information as metal grades by the various interpolation methods, distances to and number of informing samples, domain codes, and resource classification codes. These are presented in Table 17-7.
17-18
TABLE 17-6 SUMMARY OF BLOCK MODEL LIMITS
Lake Shore Gold Corp. — Marlhill Deposit
Type | | Y (Northing) | | X (Easting) | | Z (Elevation) | |
Minimum Coordinates | | 6420 | | 5760 | | 1640 | |
Maximum Coordinates | | 6690 | | 6510 | | 2300 | |
User Block Size | | 1.5 | | 3 | | 3 | |
Min. Block Size | | 1.5 | | 3 | | 3 | |
Rotation | | 45.000 (az 135o) | | 0.000 | | 0.000 | |
TABLE 17-7 SUMMARY OF BLOCK MODEL ATTRIBUTES
Lake Shore Gold Corp. — Marlhill Deposit
Attribute
Name | | Type | | Decimals | | Background | | Description | |
area | | Integer | | — | | 0 | | 1=Upper, 2=Lower, 3=PM125_5 | |
au_34 | | Real | | 2 | | 0 | | Au Capped to 34 g/t | |
au_uncut | | Real | | 2 | | 0 | | Au Raw | |
avg_dist | | Real | | 2 | | 0 | | Average Distance of Informing Samples | |
classification | | Integer | | — | | 0 | | 1=Measured, 2=Indicated, 3=Inferred | |
density | | Real | | 2 | | 0 | | Average Bulk Density | |
m1vein_pp | | Real | | 2 | | 0 | | Partial Percentage for M1 Vein Model | |
nsamp_search | | Integer | | — | | 0 | | Number of sample in the search ellipse | |
nsamp_used | | Integer | | — | | 0 | | Number of samples used | |
rock_type | | Integer | | — | | 0 | | | |
It is important to note that given the early stage of delineation of the mineralization contained within the M1 vein, little information relating to the most appropriate mining method(s) which would ultimately be employed is available. Consequently, the selection of block dimensions is preliminary in nature and may need to be revised at a later date as new information permits the identification of the most appropriate mining method(s) and as data density increases.
Gold grades were interpolated into the individual blocks for the M1 vein mineralized domain using the Inverse Distance Squared (ID2) interpolation method. A single-pass approach was used where the size of the search ellipse was governed from the average strike length of the stopes that were excavated along the M1 vein in the underground mine.
17-19
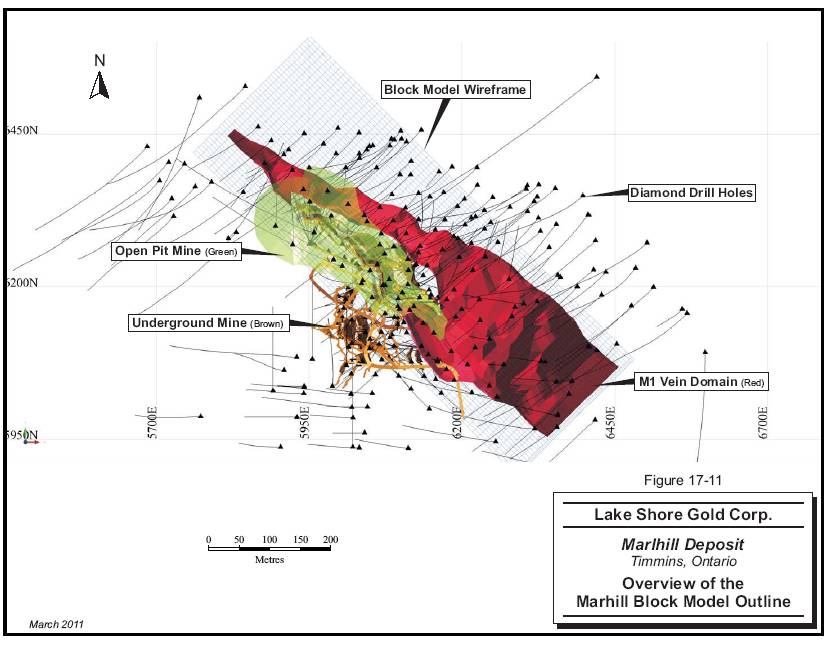
17-20
“Hard” domain boundaries were used along the contacts of the mineralized domain model in which only data contained within the M1 vein domain model were allowed to be used to estimate the grades of the blocks in the M1 vein domain, and only those blocks within the domain limits were allowed to receive grade estimates. Both the uncapped and capped, composited grades of all the drill hole intersections were used to derive an estimate of a block’s grade.
CUT-OFF GRADE
Given the hiatus in the development and exploitation of the gold mineralization contained within the M1 vein mineralization, no recent studies have been undertaken that have contemplated potential operating scenarios. For the purposes of this assignment, a conceptual operating scenario was developed wherein gold-bearing material could be excavated using underground mining methods (with or without backfill, as conditions permit) and the muck processed at the Bell Creek processing plant located nearby which employs a flowsheet that incorporates a Carbon-in-Pulp flowsheet to produce doré bars. These doré bars are then sold into the commercial market. This conceptual scenario will likely change as more information becomes available for this deposit.
The price of gold is cyclical, responding to the supply and demand relationship and influenced to a degree by market speculation and technical analyses. The gold metal prices have varied widely since the year 2000 and have recently increased to new record high levels. While Scott Wilson RPA is not in the business of predicting future metal prices, it does conduct reviews of the market’s outlook for future metal prices on a regular basis. As a result of its activities, Scott Wilson RPA suggests that a gold price of US$1,125/oz, in conjunction with an exchange rate of 0.95 (US$:C$), is an appropriate value for use in the estimation of a cut-off grade for this assignment.
Given the early stage of the project’s history, no detailed information is available in respect of many of the input parameters such as operating costs for mining, processing, general and administration, and the like in respect of a potential underground mining operation. No information regarding the metallurgical recoveries that were achieved during previous mining operations is available, as the ore was commingled with feedstock obtained from the Bell Creek mill.
17-21
Scott Wilson RPA derived estimates for these items as shown in Table 17-8 on the basis of its experience in the region, from publicly available information for comparable operations and projects in the region, and from general knowledge. It is stressed that the estimates presented are only for the purpose of developing a cut-off grade to aid in the preparation of domain models and mineral resource reporting criteria. The assumed values will likely change as new information is obtained as a result of further work. For further clarity, these parameters are not intended for use in mine planning and scheduling, or the preparation of cash flow models. Application of these input parameters suggests that a cut-off grade of 2.9 g/t Au is appropriate for use in preparation of mineral resource estimates.
TABLE 17-8 SUMMARY OF CUT-OFF GRADE INPUT PARAMETERS
ESTIMATES
Lake Shore Gold Corp. — Marlhill Deposit
Item | | Parameter Value |
Operating Costs | | C$100/tonne |
Metallurgical Recoveries | | 90% |
Gold Price | | US$1,125/oz (38.08/g) |
Exchange Rate (C$:US$) | | 1.00 : 0.95 |
MINERAL RESOURCE CLASSIFICATION CRITERIA
The mineral resources in this report were estimated in accordance with the definitions contained in the Canadian Institute of Mining, Metallurgy and Petroleum (CIM) Definition Standards on Mineral Resources and Mineral Reserves that were prepared by the CIM Standing Committee on Reserve Definitions and adopted by the CIM Council on December 11, 2005.
The mineralized material was classified into either the Indicated or Inferred Mineral Resource category on the basis of the search ellipse range obtained from the preliminary variography study, the demonstrated continuity of the gold mineralization above the suggested cut-off grade, and the density of drill hole information.
17-22
RESPONSIBILITY FOR ESTIMATION
The estimate of the Mineral Resources for the Marlhill gold deposit presented in this report was prepared by Mr. Reno Pressacco, M.Sc.(A), P.Geo., who is a qualified person as defined in NI 43-101, and is independent of Lake Shore Gold.
MINERAL RESOURCE ESTIMATE
As a result of the concepts and processes described in this report, the Mineral Resources for the Marlhill gold deposit include all blocks that are located within the M1 vein domain model, within that portion of the vein that contains gold values above the estimated cut-off grade, inclusive of internal dilution. The estimated Mineral Resources are set out in Table 17-9 and are shown in longitudinal view in Figure 17-12.
TABLE 17-9 SUMMARY OF THE ESTIMATED MINERAL RESOURCES FOR
THE M1 VEIN
Lake Shore Gold Corp. — Marlhill Deposit
| | | | Capped Grade | | | |
Category | | Tonnes | | (g/t Au) | | Oz Au | |
Measured | | — | | — | | — | |
Indicated | | 395,000 | | 4.52 | | 57,400 | |
Measured & Indicated | | 395,000 | | 4.52 | | 57,400 | |
| | | | | | | |
Inferred | | — | | — | | — | |
Notes:
1. CIM definitions were followed for classification of Mineral Resources.
2. Mineral Resources are estimated at a cut-off grade of 2.9 g/t Au.
3. Mineral Resources are estimated using an average long-term gold price of US$1,125 per ounce, and a US$/C$ exchange rate of 0.95.
4. A minimum mining width of approximately two metres was used.
5. Capped gold grades are used in estimating the Mineral Resource average grade.
6. Sums may not add due to rounding.
7. Mr. Reno Pressacco, M.Sc.(A), P.Geo., is the Qualified Person for this resource estimate.
17-23
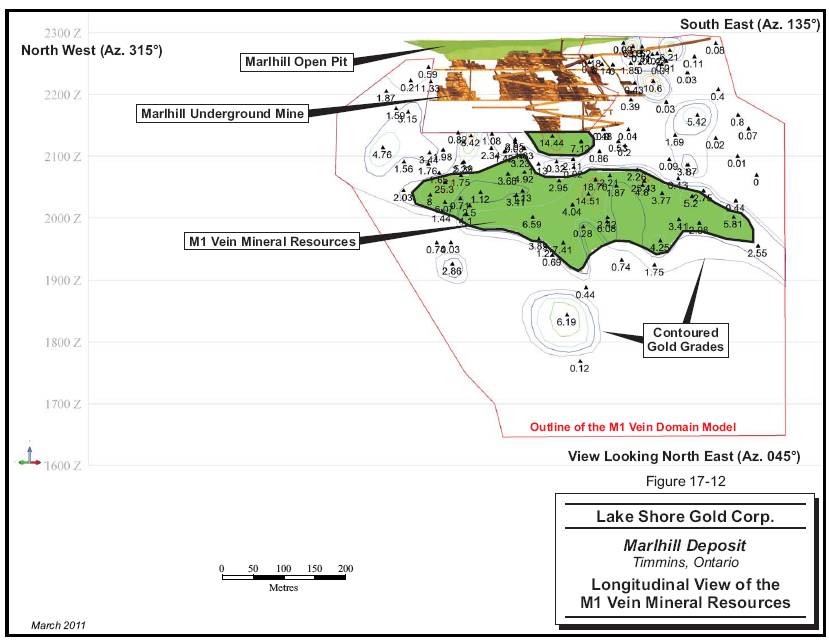
17-24
There is a degree of uncertainty associated with the estimation of mineral resources and mineral reserves and their corresponding metal grades. The estimation of mineralization is a somewhat subjective process, the accuracy of which is a function of the accuracy, quantity and quality of available data, the accuracy of statistical computations, and the assumptions used and judgments made in interpreting engineering and geological information. Until mineral reserves or mineral resources are actually mined and processed, and the characteristics of the deposit fully assessed, their quantity and grade should be considered as estimates only. In addition, the quantity of mineral reserves and mineral resources may vary, depending on many factors such as exchange rates, energy costs, and metal prices. Fluctuation in metal or commodity prices, results of additional drilling, metallurgical testing, receipt of new information and production, and the evaluation of mine plans subsequent to the date of any mineral resource estimate may require revision of such an estimate.
Scott Wilson RPA has considered the mineral resource estimates in light of known environmental, permitting, legal, title, taxation, socio-economic, marketing, political, and other relevant issues and has no reason to believe at this time that the mineral resources will be materially affected by these items. Given the time which has elapsed since completion of past mining activities at the Marlhill gold deposit, no current studies have been completed that examine whether the mineral resources may be materially affected by mining, infrastructure, or other relevant factors. Preliminary metallurgical testing has been completed on samples taken from the Marlhill gold deposit.
BLOCK MODEL VALIDATION
Validation efforts for the mineral resource estimate at the Marlhill deposit consisted of a comparison of the average block grades for the capped gold grades against the respective informing composite samples contained within the boundaries of the clipped mineral resource outline. As well, the volumes reported from the block model were compared to the volumes of the clipped mineral resource domain model of the M1 vein. The reconciliation report is presented in Table 17-10. It can be seen that there is a good correlation between the reported volumes for the resource outline, with the block model reporting a slightly less volume (i.e., tonnage). In respect of the average grade, it can be seen that the block model is reporting an average grade approximately 1 g/t Au less than is suggested by the informing capped composited samples.
17-25
TABLE 17-10 BLOCK MODEL RECONCILIATION REPORT, M1 VEIN
MINERAL RESOURCE ESTIMATE
Lake Shore Gold Corp. — Marlhill Deposit
| | Volume | | | | Capped Au | | Contained | |
Item | | (m3) | | Tonnes | | (g/t Au) | | Oz | |
Block Model Report | | 145,000 | | 395,000 | | 4.52 | | 57,400 | |
Cross Check | | 146,000 | | 397,000 | | 5.40 | | 69,000 | |
Difference (BM-Check) | | -1,000 | | -2,000 | | | | -11,600 | |
Percent Difference | | -0.7 | % | -0.5 | % | | | -17 | % |
17-26
18 OTHER RELEVANT DATA AND INFORMATION
No additional information or explanation is necessary to make this Technical Report understandable and not misleading.
18-1
19 INTERPRETATION AND CONCLUSIONS
The Marlhill Mine has produced a small amount of gold during the 1981 to 1989 by means of underground mining methods and during the 2002 to 2003 period by means of open pit mining methods. While a number of gold-bearing quartz veins are known to be present in the immediate vicinity of the mine workings, much of the gold production has been derived from the M1 vein system. Diamond drilling programs that were conducted by previous operators on the property have been successful in tracing the M1 vein along a strike length of 500 m to 600 m and to a vertical depth of 400 m to 500 m from surface. While mining activity has excavated portions of the M1 vein to a vertical depth of approximately 150 m, additional gold mineralization has been shown to be present beneath the existing underground mine workings.
A Mineral Resource estimate has been prepared using the historical drill hole information, as Lake Shore Gold has not completed any new drilling to test the M1 vein system except for drilling of four holes in the fall 2010 that are reported to have essentially no impact on the current resource estimate. Spot checking of the accuracy of the drill hole collar information and the assay information contained in the historical drill hole database has shown that this historical information can be used in the preparation of a Mineral Resource estimate with confidence.
The Mineral Resource estimate has been prepared for the M1 vein only, as modeling the minor vein sets were not successful due to the limited areal extent of those veins (as evidenced from the existing underground exposures) and due to the limited amount of detailed drill hole information. Following completion of the solid model of the M1 Vein, a separate clipping polygon was created which was then used to remove that part of the domain model in and about the existing mine workings. The M1 vein strikes in a northwesterly direction and dips steeply to the north near surface. The dip of the vein increases with depth such that the vein is interpreted to have a sub-vertical orientation at depth.
A domain model of the distribution of the M1 vein was prepared using a series of cross sections that were spaced at a distance of 15 m (+/- 7.5 m viewing window). While Lake Shore Gold applied a capping factor of 34 g/t Au to the assays within the vein model, analysis of the statistics suggested that a value of 30 g/t Au may be more appropriate. A
19-1
comparative analysis of the impact of the lower capping grade reveals that no material difference will result in the average grade of the data set. Density measurements on a small number of M1 vein samples resulted in a bulk density of 2.73 t/m3.
Analysis of the trends of the gold distribution within the M1 vein shows that at a grade of 1 g/t Au, and, to a lesser degree, 2 g/t Au, a shallow southeast orientation (approximately -20o to azimuth 135o) is present in the gold grades contained within that portion of the M1 vein below the lowermost level of the Marlhill Mine. At first glance, this orientation appears discordant with the observed trends at many of the gold deposits in the Timmins area. Examination of the structural information presented in Pressacco (1999), however, suggests that the observed shallow southeast plunge may be paralleling an F1 fold axis. A second, more steeply southeast plunging orientation is suggested by the higher grade contours and is consistent with the observed trends in the mined-out areas.
An upright, rotated, whole-block model with the long axis of the blocks oriented along an azimuth 135° and dipping vertically was constructed using the GEMS v.6.2.3 software package. Gold grades were interpolated into the individual blocks for the M1 vein mineralized domain using the ID2 interpolation method. A single-pass approach was used where the size of the search ellipse was governed by the average strike length of the stopes that were excavated along the M1 vein in the underground mine.
An estimate of an appropriate cut-off grade was derived using a gold price of US$1,125/oz, an exchange rate of 0.95 (US$:C$), and estimates of operating costs derived from Scott Wilson RPA’s experience in the area. The input parameters suggest that a cut-off grade of 2.9 g/t Au is appropriate for use in preparation of the Mineral Resource estimate for the M1 vein.
The mineralized material was classified into the Indicated Mineral Resource category on the basis of the search ellipse range obtained from the preliminary variography study, the demonstrated continuity of the gold mineralization above the suggested cut-off grade, and the density of drill hole information. The Mineral Resources for the Marlhill gold deposit include all blocks that are located within the M1 vein domain model, within that portion of the vein that contains gold values above the estimated cut-off grade, inclusive of internal dilution. The estimated Mineral Resources are set out in Table 19-1.
19-2
TABLE 19-1 SUMMARY OF THE ESTIMATED MINERAL RESOURCES FOR
THE M1 VEIN
Lake Shore Gold Corp. — Marlhill Deposit
| | | | Capped Grade | | | |
Category | | Tonnes | | (g/t Au) | | Oz Au | |
Measured | | — | | — | | — | |
Indicated | | 395,000 | | 4.52 | | 57,400 | |
Measured & Indicated | | 395,000 | | 4.52 | | 57,400 | |
| | | | | | | |
Inferred | | — | | — | | — | |
Notes:
1. CIM definitions were followed for classification of Mineral Resources.
2. Mineral Resources are estimated at a cut-off grade of 2.9 g/t Au.
3. Mineral Resources are estimated using an average long-term gold price of US$1,125 per ounce, and a US$/C$ exchange rate of 0.95.
4. A minimum mining width of approximately two metres was used.
5. Capped gold grades are used in estimating the Mineral Resource average grade.
6. Sums may not add due to rounding.
7. Mr. Reno Pressacco, M.Sc.(A), P.Geo., is the Qualified Person for this resource estimate.
There are no Mineral Reserves estimated for the Marlhill property.
19-3
20 RECOMMENDATIONS
It is clear that the depth extents of the gold mineralization within the M1 vein have not been defined by drilling, and the strike extents of the M1 vein remain open. There is also potential to discover additional en-echelon vein systems on the property. Further work to better define the M2 and M3 veins is also warranted.
Scott Wilson RPA believes that Lake Shore Gold would be justified in carrying out exploration programs that are designed to test these areas for the presence of additional gold mineralization.
20-1
21 REFERENCES
Aitken, S.A., 1990: The Pamour One Mine-Site Investigation, Timmins, Ontario: Unpublished M.Sc Thesis, Queen’s University, Kingston, Ontario, 194 p.
Backman O. L. (1958). Report on Examination of Surface Showings. Unpublished Report, Broulan Reef Mines Ltd. Ministry of Northern Development, Mines and Forestry , South Porcupine, Ontario. File number 42A11SE0062
Barclay, W. A., 1994, Report on a Review of Plans and Sections and Surface Mapping on the Marlhill Mine Property, with Drill Recommendations: Unpublished Pentland Firth Internal Document, 31 p.
Berger, B.R., 1998: Precambrian Geology, Hoyle and Gowan Townships, Ontario Geological Survey, Report 299, 49 p.
Brisbin, D.I., 1997: Geological Setting of Gold Deposits in the Porcupine Mining District, Timmins, Ontario; unpublished PhD Thesis, Queen’s University, Kingston, Ontario, 523 p.
Burns, L.P., 1993; An Investigation of the Structural controls on Mineralization at the Marlhill Mine, Hoyle Township, NTS 42A11, Falconbridge Gold Corp.
Butler, H.R., 2008: Technical (Geological) Report on Bell Creek Complex, Hoyle Township, Porcupine Mining Division, Ontario, Canada., Prepared for Lake Shore Gold Corp.; Unpublished Document available on the SEDAR web site at www.sedar.com, 63 p.
Kent, G., 1990, Bell Creek and Marlhill Mine Area: in Field Trip Guidebook, 8th IAGOD Symposium, J. A. Fyon and A. H. Green eds., Geological Survey of Canada Open File 2161, p. 1124 — 1128.
Lakefield Research of Canada Limited, 1986: The Investigation of the Recovery of Gold From Samples Submitted by Canamax Resources Incorporated. Progress Report No. 2. Project No. LR2998, August 29, 1986
Powers, D.H.R., 2009: A Technical Review and Report for the Bell Creek Complex Properties, Exploration Diamond Drill Programs, August 2005 to July 31, 2009. Prepared for Lake Shore Gold Corp. September 30, 2009; Unpublished Document available on the SEDAR web site at www.SEDAR.com, 225 p.
Pressacco, R., ed., 1999, Economic Geology and Mineralization of the Marlhill Mine in Special Project: Timmins Ore Deposits Descriptions: Ontario Geological Survey, Open File Report 5985, 189 p.
Pressacco, R., 2011, Technical Report on the Initial Mineral Resource Estimate for the Bell Creek Mine, Hoyle Township, Timmins, Ontario, Canada., Prepared for Lake Shore Gold Corp., Available on the SEDAR web site at www.sedar.com. 202 p.
21-1
Rhys, D.A., 2003: Structural Mapping Study of the Surface Outcrops of the Holmer Gold Deposit, Timmins, Ontario, Internal Lake Shore Gold Corp. Report by Panterra Geoservices Inc, Surrey, British Columbia.
Rhys, D., Lewis, P., 2004: Gold Vein Deposits: Turning Geology into Discovery, BC & Yukon Chamber of Mines, Cordilleran Exploration Round-Up, short course notes.
21-2
22 DATE AND SIGNATURE PAGE
This report titled “Technical Report on the Marlhill Project, Hoyle Township, Timmins, Ontario, Canada” and dated March 1, 2011, was prepared and signed by the following authors:
| | (Signed & Sealed) “Reno Pressacco” |
| | |
| | |
Dated at Toronto, Ontario | | |
March 1, 2011 | | Reno Pressacco, M.Sc.(A), P.Geo. |
| | Associate Consulting Geologist |
22-1
23 CERTIFICATE OF QUALIFIED PERSON
RENO PRESSACCO
I, Reno Pressacco, M.Sc.(A), P.Geo., as author of this report entitled “Technical Report on the Marlhill Project, Hoyle Township, Timmins, Ontario, Canada” prepared for Lake Shore Gold Corp. and dated March 1, 2011, do hereby certify that:
1. I am an Associate Consulting Geologist with Scott Wilson Roscoe Postle Associates Inc. of Suite 501, 55 University Ave., Toronto, ON, M5J 2H7. I was Senior Consulting Geologist with Scott Wilson RPA at the time of preparation of the Mineral Resource estimate.
2. I am a graduate of Cambrian College of Applied Arts and Technology, Sudbury, Ontario, in 1982 with a CET Diploma in Geological Technology, Lake Superior State College, Sault Ste. Marie, Michigan, in 1984, with a B.Sc. degree in Geology and McGill University, Montréal, Québec, in 1986 with a M.Sc.(A) degree in Mineral Exploration.
3. I am registered as a Professional Geologist in the Province of Ontario (Reg.# 939). I have worked as a professional geologist for a total of 25 years since my graduation. My relevant experience for the purpose of the Technical Report is:
· Review and report as a consultant on numerous exploration and mining projects around the world for due diligence and regulatory requirements, including preparation of Mineral Resource estimates and NI 43-101 Technical Reports.
· Numerous assignments in North, Central and South America, Finland, Russia, Armenia and China in a variety of deposit types and in a variety of geological environments; commodities including Au, Ag, Cu, Zn, Pb, Ni, Mo, U, PGM and industrial minerals.
· A senior position with an international consulting firm.
4. I have read the definition of “qualified person” set out in National Instrument 43-101 (NI 43-101) and certify that by reason of my education, affiliation with a professional association (as defined in NI 43-101) and past relevant work experience, I fulfill the requirements to be a “qualified person” for the purposes of NI 43-101.
5. I visited the Marlhill property on April 19 to April 21, 2010.
6. I am responsible for overall preparation of the Technical Report.
7. I am independent of the Issuer applying the test set out in Section 1.4 of NI 43-101.
8. I have had prior involvement with the property that is the subject of the Technical Report, being the activities described in Pressacco, 1999.
9. I have read NI 43-101, and the Technical Report has been prepared in compliance with NI 43-101 and Form 43-101F1.
23-1
10. To the best of my knowledge, information, and belief, the Technical Report contains all scientific and technical information that is required to be disclosed to make the Technical Report not misleading.
Dated this 1st day of March, 2011.
(Signed & Sealed) “Reno Pressacco”
Reno Pressacco, M.Sc.(A)., P.Geo.
23-2