Exhibit (c)(13)
| Project Copal Discussion Materials Goldman, Sachs & Co. October 17, 2013 |
| Disclaimer Goldman, Sachs & Co. (“GS”) has prepared and provided these materials and GS’s related presentation (the “Confidential Information”) solely for the information and assistance of the Board of Directors and senior management of Roger (the "Company") in connection with their consideration of the matters referred to herein. Without GS’s prior written consent, the Confidential Information may not be circulated or referred to publicly, disclosed to or relied upon by any other person, or used or relied upon for any other purpose. Notwithstanding anything hereinto the contrary, the Company may disclose to any person the US federal income and state income tax treatment and tax structure of any transaction described herein and all materials of any kind (including tax opinions and other tax analyses) that are provided to the Company relating to such tax treatment and tax structure, without GS imposing any limitation of any kind. The Confidential Information, including this disclaimer, is subject to, and governed by, any written agreement between the Company, the Board and/or any committee thereof, on the one hand, and GS, on the other hand. GS and its affiliates are engaged in investment banking, commercial banking and financial advisory services, securities trading, investment management, principal investment, financial planning, benefits counseling, risk management, hedging, financing, brokerage activities and other financial and non-financial activities and services for various persons and entities. In the ordinary course of these activities and services, GS and its affiliates may at any time make or hold long or short positions and investments, as well as actively trade or effect transactions, in the equity, debt and other securities (or related derivative securities) and financial instruments (including bank loans and other obligations) of third parties, the Company, any other party to any transaction and any of their respective affiliates or any currency or commodity that may be involved in any transaction for their own account and for the accounts of their customers. The Confidential Information has been prepared and based on information obtained by GS from publicly available sources, the Company’s management and/or other sources. In preparing the Confidential Information, GS has relied upon and assumed, without assuming any responsibility for independent verification, the accuracy and completeness of all of the financial, legal, regulatory, tax, accounting and other information provided to, discussed with or reviewed by GS, and GS does not assume any liability for any such information discussed with or reviewed by GS. GS has assumed that all forecasts provided to, discussed with or reviewed by GS have been reasonably prepared and reflect the best currently available estimates and judgments of the Company. GS does not provide accounting, tax, legal or regulatory advice. GS’s role in any due diligence review is limited solely to performing such a review as it shall deem necessary to support its own advice and analysis and shall not be on behalf of the Company. Analyses based upon forecasts of future results are not necessarily indicative of actual future results, which may be significantly more or less favorable than suggested by these analyses, and GS does not assume responsibility if future results are materially different from those forecast. GS has not made an independent evaluation or appraisal of the assets and liabilities of the Company or any other person and has no obligation to evaluate the solvency of the Company or any person under any law. The analyses in the Confidential Information are not appraisals nor do they necessarily reflect the prices at which businesses or securities actually may be sold or purchased. The Confidential Information does not address the underlying business decision of the Company to engage in any transaction, or the relative merits of any strategic alternative referred to herein as compared to any other alternative that may be available to the Company. The Confidential Information is necessarily based on economic, monetary, market and other conditions as in effect on, and the information made available to GS as of, the date of such Confidential Information and GS assumes no responsibility for updating or revising the Confidential Information. |
| Table of Contents I. Proposed Balance Sheet Fair Value Adjustments II. Public Markets Trading III. Credit Considerations IV. Illustrative Merger Plans V. Selected Precedent Transactions VI. Shareholder Analysis Appendix A: Select Precedent Transaction Detail Appendix B: Select Transaction Synopses |
| I. Proposed Balance Sheet Fair Value Adjustments |
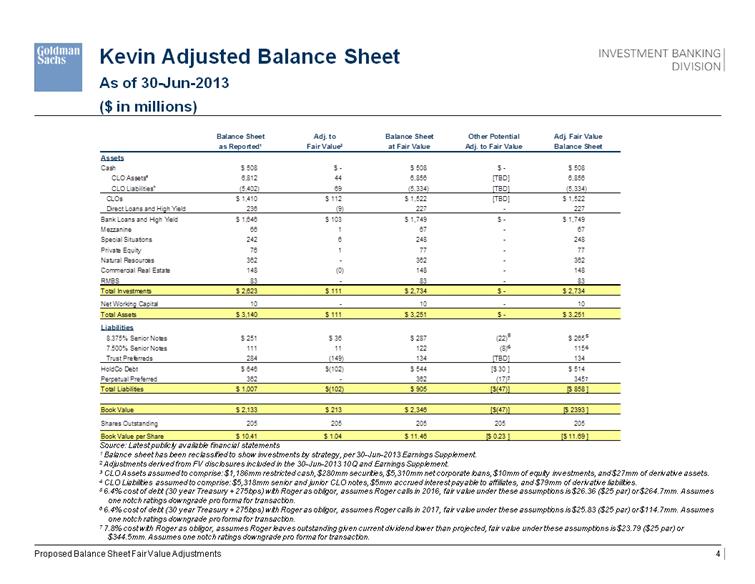
| Kevin Adjusted Balance Sheet As of 30-Jun-2013 ($ in millions) Source: Latest publicly available financial statements 1 Balance sheet has been reclassified to show investments by strategy, per 30-Jun-2013 Earnings Supplement. 2 Adjustments derived from FV disclosures included in the 30-Jun-2013 10Q and Earnings Supplement. 3 CLO Assets assumed to comprise: $1,186mm restricted cash, $280mm securities, $5,310mm net corporate loans, $10mm of equity investments, and $27mm of derivative assets. 4 CLO Liabilities assumed to comprise: $5,318mm senior and junior CLO notes, $5mm accrued interest payable to affiliates, and $79mm of derivative liabilities. 5 6.4% cost of debt (30 year Treasury + 275bps) with Roger as obligor, assumes Roger calls in 2016, fair value under these assumptions is $26.36 ($25 par) or $264.7mm. Assumes one notch ratings downgrade pro forma for transaction. 6 6.4% cost of debt (30 year Treasury + 275bps) with Roger as obligor, assumes Roger calls in 2017, fair value under these assumptions is $25.83 ($25 par) or $114.7mm. Assumes one notch ratings downgrade pro forma for transaction. 7 7.8% cost with Roger as obligor, assumes Roger leaves outstanding given current dividend lower than projected, fair value under these assumptions is $23.79 ($25 par) or $344.5mm. Assumes one notch ratings downgrade pro forma for transaction. Proposed Balance Sheet Fair Value Adjustments 5 6 7 5 6 7 Balance Sheet Adj. to Balance Sheet Other Potential Adj. Fair Value as Reported 1 Fair Value 2 at Fair Value Adj. to Fair Value Balance Sheet Assets Cash $ 508 $ - $ 508 $ - $ 508 CLO Assets 3 6,812 44 6,856 [TBD] 6,856 CLO Liabilities 4l (5,402) 69 (5,334) [TBD] (5,334) CLOs $ 1,410 $ 112 $ 1,522 [TBD] $ 1,522 Direct Loans and High Yield 236 (9) 227 - 227 Bank Loans and High Yield $ 1,646 $ 103 $ 1,749 $ - $ 1,749 Mezzanine 66 1 67 - 67 Special Situations 242 6 248 - 248 Private Equity 76 1 77 - 77 Natural Resources 362 - 362 - 362 Commercial Real Estate 148 (0) 148 - 148 RMBS 83 - 83 - 83 Total Investments $ 2,623 $ 111 $ 2,734 $ - $ 2,734 Net Working Capital 10 - 10 - 10 Total Assets $ 3,140 $ 111 $ 3,251 $ - $ 3,251 Liabilities 8.375% Senior Notes $ 251 $ 36 $ 287 (22) $ 265 7.500% Senior Notes 111 11 122 (8) 115 Trust Preferreds 284 (149) 134 [TBD] 134 HoldCo Debt $ 646 $(102) $ 544 [$ 30 ] $ 514 Perpetual Preferred 362 - 362 (17) 345 Total Liabilities $ 1,007 $(102) $ 905 [$(47)] [$ 858 ] Book Value $ 2,133 $ 213 $ 2,346 [$(47)] [$ 2393 ] Shares Outstanding 205 205 205 205 205 Book Value per Share $ 10.41 $ 1.04 $ 11.46 [$ 0.23 ] [$ 11.69 ] |
| II. Public Markets Trading |

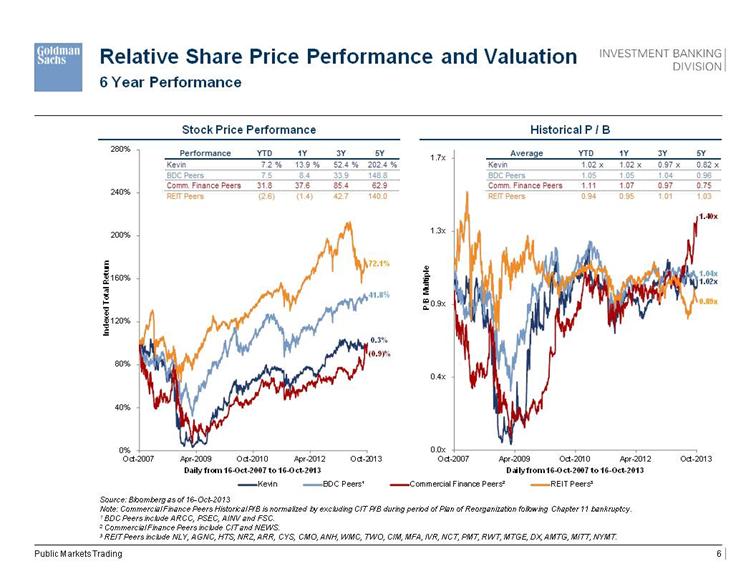
| Relative Share Price Performance and Valuation 6 Year Performance Stock Price Performance Historical P / B Source: Bloomberg as of 16-Oct-2013 Note: Commercial Finance Peers Historical P/B is normalized by excluding CIT P/B during period of Plan of Reorganization following Chapter 11 bankruptcy. 1 BDC Peers include ARCC, PSEC, AINV and FSC. 2 Commercial Finance Peers include CIT and NEWS. 3 REIT Peers include NLY, AGNC, HTS, NRZ, ARR, CYS, CMO, ANH, WMC, TWO, CIM, MFA, IVR, NCT, PMT, RWT, MTGE, DX, AMTG, MITT, NYMT. Public Markets Trading 1.02x 1.04x 1.40x 0.89x 0.0x 0.4x 0.9x 1.3x 1.7x Oct-2007 Apr-2009 Oct-2010 Apr-2012 Oct-2013 P/B Multiple Daily from 16 - Oct - 2007 to 16 - Oct - 2013 0% 40% 80% 120% 160% 200% 240% 280% Oct-2007 Apr-2009 Oct-2010 Apr-2012 Oct-2013 Indexed Total Return Daily from 16 - Oct - 2007 to 16 - Oct - 2013 72.1% 41.8 % 0.3% (0.9)% 1.0x 1.0x 1.4x 0.9x 0.0x 0.4x 0.9x 1.3x 1.7x Oct-2007 Oct-2008 Oct-2009 Oct-2010 Oct-2011 Oct-2012 Oct-2013 P/B Multiple Daily from 16 - Oct - 2007 to 16 - Oct - 2013 Kevin BDC Peers1 Commercial Finance Peers2 REIT Peers3 Performance YTD 1Y 3Y 5Y Kevin 7.2 % 13.9 % 52.4 % 202.4 % BDC Peers 7.5 8.4 33.9 148.8 Comm. Finance Peers 31.8 37.6 85.4 62.9 REIT Peers (2.6) (1.4) 42.7 140.0 Average YTD 1Y 3Y 5Y Kevin 1.02 x 1.02 x 0.97 x 0.82 x BDC Peers 1.05 1.05 1.04 0.96 Comm. Finance Peers 1.11 1.07 0.97 0.75 REIT Peers 0.94 0.95 1.01 1.03 |
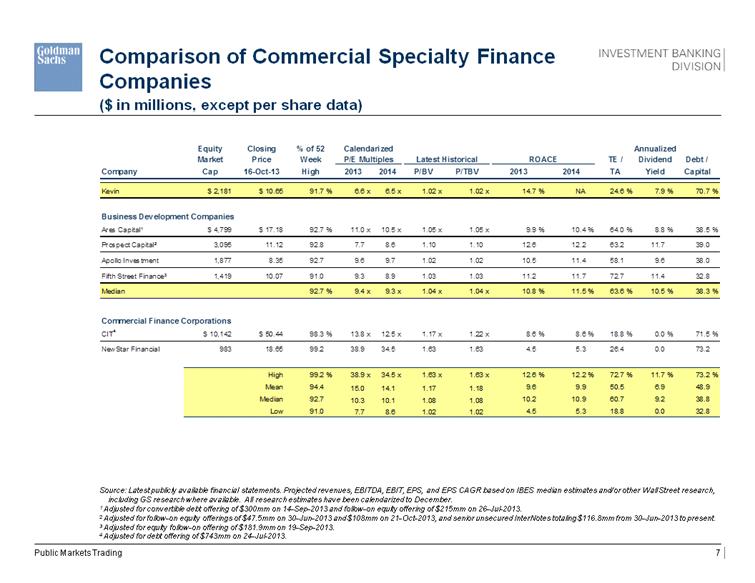
| Comparison of Commercial Specialty Finance Companies Source: Latest publicly available financial statements. Projected revenues, EBITDA, EBIT, EPS, and EPS CAGR based on IBES median estimates and/or other Wall Street research, including GS research where available. All research estimates have been calendarized to December. 1 Adjusted for convertible debt offering of $300mm on 14-Sep-2013 and follow-on equity offering of $215mm on 26-Jul-2013. 2 Adjusted for follow-on equity offerings of $47.5mm on 30-Jun-2013 and $108mm on 21-Oct-2013, and senior unsecured InterNotes totaling $116.8mm from 30-Jun-2013 to present. 3 Adjusted for equity follow-on offering of $181.9mm on 19-Sep-2013. 4 Adjusted for debt offering of $743mm on 24-Jul-2013. Public Markets Trading Equity Closing % of 52 Calendarized Annualized Market Price Week P/E Multiples Latest Historical ROACE TE / Dividend Debt / Company Cap 16-Oct-13 High 2013 2014 P/BV P/TBV 2013 2014 TA Yield Capital Kevin $ 2,181 $ 10.65 91.7 % 6.6 x 6.5 x 1.02 x 1.02 x 14.7 % NA 24.6 % 7.9 % 70.7 % Business Development Companies Ares Capital1 $ 4,799 $ 17.18 92.7 % 11.0 x 10.5 x 1.05 x 1.05 x 9.9 % 10.4 % 64.0 % 8.8 % 38.5 % Prospect Capital2 3,095 11.12 92.8 7.7 8.6 1.10 1.10 12.6 12.2 63.2 11.7 39.0 Apollo Investment 1,877 8.35 92.7 9.6 9.7 1.02 1.02 10.5 11.4 58.1 9.6 38.0 Fifth Street Finance3 1,419 10.07 91.0 9.3 8.9 1.03 1.03 11.2 11.7 72.7 11.4 32.8 Median 92.7 % 9.4 x 9.3 x 1.04 x 1.04 x 10.8 % 11.5 % 63.6 % 10.5 % 38.3 % Commercial Finance Corporations CIT 4 $ 10,142 $ 50.44 98.3 % 13.8 x 12.5 x 1.17 x 1.22 x 8.6 % 8.6 % 18.8 % 0.0 % 71.5 % NewStar Financial 983 18.65 99.2 38.9 34.5 1.63 1.63 4.5 5.3 26.4 0.0 73.2 High 99.2 % 38.9 x 34.5 x 1.63 x 1.63 x 12.6 % 12.2 % 72.7 % 11.7 % 73.2 % Mean 94.4 15.0 14.1 1.17 1.18 9.6 9.9 50.5 6.9 48.9 Median 92.7 10.3 10.1 1.08 1.08 10.2 10.9 60.7 9.2 38.8 Low 91.0 7.7 8.6 1.02 1.02 4.5 5.3 18.8 0.0 32.8 |
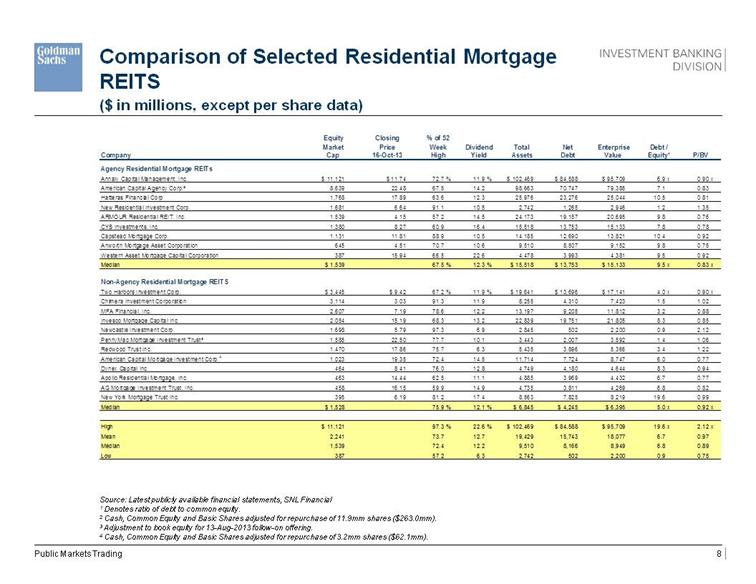
| Comparison of Selected Residential Mortgage REITS Source: Latest publicly available financial statements, SNL Financial 1 Denotes ratio of debt to common equity. 2 Cash, Common Equity and Basic Shares adjusted for repurchase of 11.9mm shares ($263.0mm). 3 Adjustment to book equity for 13-Aug-2013 follow-on offering. 4 Cash, Common Equity and Basic Shares adjusted for repurchase of 3.2mm shares ($62.1mm). Public Markets Trading Equity Closing % of 52 Market Price Week Dividend Total Net Enterprise Debt / Company Cap 16-Oct-13 High Yield Assets Debt Value Equity ¹ P/BV Agency Residential Mortgage REITs Annaly Capital Management, Inc. $ 11,121 $ 11.74 72.7 % 11.9 % $ 102,469 $ 84,588 $ 95,709 6.9 x 0.90 x American Capital Agency Corp . ² 8,639 22.48 67.5 14.2 98,663 70,747 79,385 7.1 0.83 Hatteras Financial Corp 1,768 17.89 63.6 12.3 25,976 23,276 25,044 10.5 0.81 New Residential Investment Corp. 1,681 6.64 91.1 10.5 2,742 1,265 2,946 1.2 1.35 ARMOUR Residential REIT, Inc. 1,539 4.15 57.2 14.5 24,173 19,157 20,695 9.8 0.76 CYS Investments, Inc. 1,380 8.27 60.9 16.4 15,518 13,753 15,133 7.8 0.78 Capstead Mortgage Corp. 1,131 11.81 88.9 10.5 14,185 12,690 13,821 10.4 0.92 Anworth Mortgage Asset Corporation 645 4.51 70.7 10.6 9,510 8,507 9,152 9.8 0.75 Western Asset Mortgage Capital Corporation 387 15.94 66.5 22.6 4,478 3,993 4,381 9.5 0.92 Median $ 1,539 67.5 % 12.3 % $ 15,518 $ 13,753 $ 15,133 9.5 x 0.83 x Non-Agency Residential Mortgage REITS Two Harbors Investment Corp. $ 3,445 $ 9.42 67.2 % 11.9 % $ 19,641 $ 13,696 $ 17,141 4.0 x 0.90 x Chimera Investment Corporation 3,114 3.03 91.3 11.9 8,255 4,310 7,423 1.5 1.02 MFA Financial, Inc. 2,607 7.19 78.6 12.2 13,197 9,205 11,812 3.2 0.88 Invesco Mortgage Capital Inc. 2,054 15.19 68.3 13.2 22,839 19,751 21,805 8.3 0.85 Newcastle Investment Corp. 1,698 5.79 97.3 6.9 2,845 502 2,200 0.9 2.12 PennyMac Mortgage Investment Trust ³ 1,585 22.50 77.7 10.1 3,443 2,007 3,592 1.4 1.06 Redwood Trust Inc. 1,470 17.86 75.7 6.3 5,435 3,896 5,366 3.4 1.22 American Capital Mortgage Investment Corp . 4 1,023 19.35 72.4 14.5 11,714 7,724 8,747 6.0 0.77 Dynex Capital Inc. 464 8.41 76.0 12.8 4,749 4,180 4,644 8.3 0.94 Apollo Residential Mortgage, Inc. 463 14.44 62.5 11.1 4,885 3,969 4,432 6.7 0.77 AG Mortgage Investment Trust, Inc. 458 16.15 59.9 14.9 4,735 3,811 4,269 6.8 0.82 New York Mortgage Trust Inc. 395 6.19 81.2 17.4 8,563 7,825 8,219 19.6 0.99 Median $ 1,528 75.9 % 12.1 % $ 6,845 $ 4,245 $ 6,395 5.0 x 0.92 x High $ 11,121 97.3 % 22.6 % $ 102,469 $ 84,588 $ 95,709 19.6 x 2.12 x Mean 2,241 73.7 12.7 19,429 15,743 18,077 6.7 0.97 Median 1,539 72.4 12.2 9,510 8,166 8,949 6.8 0.89 Low 387 57.2 6.3 2,742 502 2,200 0.9 0.75 |
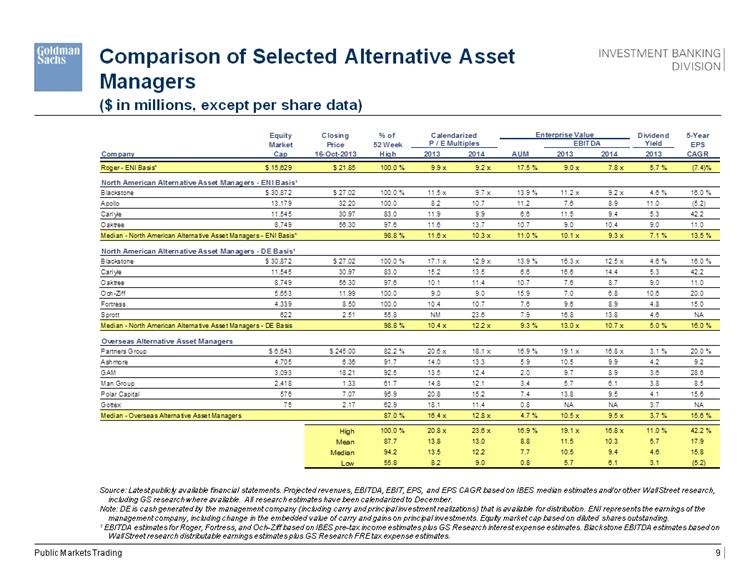
| Comparison of Selected Alternative Asset Managers1 Source: Latest publicly available financial statements. Projected revenues, EBITDA, EBIT, EPS, and EPS CAGR based on IBES median estimates and/or other Wall Street research, including GS research where available. All research estimates have been calendarized to December. Note: DE is cash generated by the management company (including carry and principal investment realizations) that is available for distribution. ENI represents the earnings of the management company, including change in the embedded value of carry and gains on principal investments. Equity market cap based on diluted shares outstanding. 1 EBITDA estimates for Roger, Fortress, and Och-Ziff based on IBES pre-tax income estimates plus GS Research interest expense estimates. Blackstone EBITDA estimates based on Wall Street research distributable earnings estimates plus GS Research FRE tax expense estimates. Public Markets Trading Equity Closing % of Calendarized Enterprise Value Dividend 5-Year Market Price 52 Week P / E Multiples EBITDA Yield EPS Company Cap 16-Oct-2013 High 2013 2014 AUM 2013 2014 2013 CAGR Roger - ENI Basis 1 $ 15,629 $ 21.85 100.0 % 9.9 x 9.2 x 17.5 % 9.0 x 7.8 x 5.7 % (7.4)% North American Alternative Asset Managers - ENI Basis 1 Blackstone $ 30,872 $ 27.02 100.0 % 11.5 x 9.7 x 13.9 % 11.2 x 9.2 x 4.6 % 16.0 % Apollo 13,179 32.20 100.0 8.2 10.7 11.2 7.6 8.9 11.0 (5.2) Carlyle 11,545 30.97 83.0 11.9 9.9 6.6 11.5 9.4 5.3 42.2 Oaktree 8,749 56.30 97.6 11.6 13.7 10.7 9.0 10.4 9.0 11.0 Median - North American Alternative Asset Managers - ENI Basis 1 98.8 % 11.6 x 10.3 x 11.0 % 10.1 x 9.3 x 7.1 % 13.5 % North American Alternative Asset Managers - DE Basis 1 Blackstone $ 30,872 $ 27.02 100.0 % 17.1 x 12.9 x 13.9 % 16.3 x 12.5 x 4.6 % 16.0 % Carlyle 11,545 30.97 83.0 15.2 13.5 6.6 16.6 14.4 5.3 42.2 Oaktree 8,749 56.30 97.6 10.1 11.4 10.7 7.6 8.7 9.0 11.0 Och-Ziff 5,653 11.99 100.0 9.0 9.0 15.9 7.0 6.8 10.6 20.0 Fortress 4,339 8.50 100.0 10.4 10.7 7.6 9.6 8.9 4.8 15.0 Sprott 622 2.51 55.8 NM 23.6 7.9 16.8 13.8 4.6 NA Median - North American Alternative Asset Managers - DE Basis 98.8 % 10.4 x 12.2 x 9.3 % 13.0 x 10.7 x 5.0 % 16.0 % Overseas Alternative Asset Managers Partners Group $ 6,643 $ 245.00 82.2 % 20.6 x 18.1 x 16.9 % 19.1 x 16.8 x 3.1 % 20.0 % Ashmore 4,705 6.36 91.7 14.0 13.3 5.9 10.5 9.9 4.2 9.2 GAM 3,093 18.21 92.5 13.5 12.4 2.0 9.7 8.9 3.6 28.6 Man Group 2,418 1.33 61.7 14.8 12.1 3.4 5.7 6.1 3.8 8.5 Polar Capital 576 7.07 95.9 20.8 15.2 7.4 13.8 9.5 4.1 15.6 Gottex 75 2.17 62.9 18.1 11.4 0.8 NA NA 3.7 NA Median - Overseas Alternative Asset Managers 87.0 % 16.4 x 12.8 x 4.7 % 10.5 x 9.5 x 3.7 % 15.6 % High 100.0 % 20.8 x 23.6 x 16.9 % 19.1 x 16.8 x 11.0 % 42.2 % Mean 87.7 13.8 13.0 8.8 11.5 10.3 5.7 17.9 Median 94.2 13.5 12.2 7.7 10.5 9.4 4.6 15.8 Low 55.8 8.2 9.0 0.8 5.7 6.1 3.1 (5.2) |
| III. Credit Considerations |
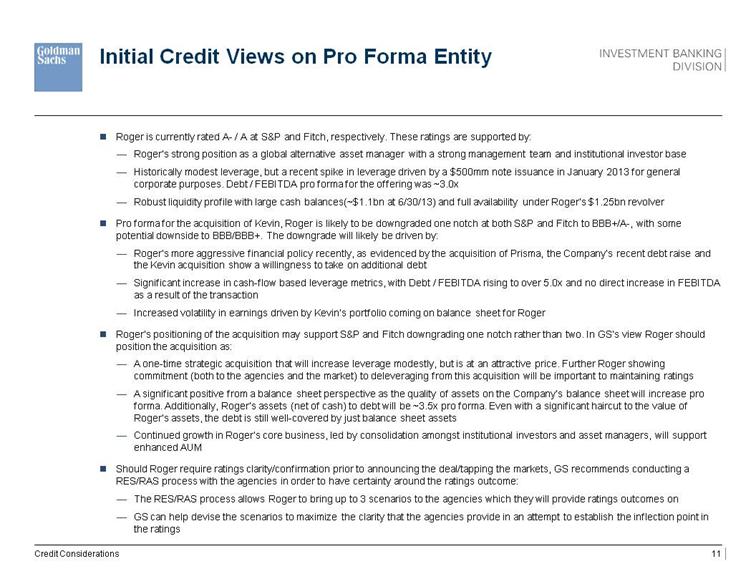
| Roger is currently rated A- / A at S&P and Fitch, respectively. These ratings are supported by: Roger’s strong position as a global alternative asset manager with a strong management team and institutional investor base Historically modest leverage, but a recent spike in leverage driven by a $500mm note issuance in January 2013 for general corporate purposes. Debt / FEBITDA pro forma for the offering was ~3.0x Robust liquidity profile with large cash balances(~$1.1bn at 6/30/13) and full availability under Roger’s $1.25bn revolver Pro forma for the acquisition of Kevin, Roger is likely to be downgraded one notch at both S&P and Fitch to BBB+/A-, with some potential downside to BBB/BBB+. The downgrade will likely be driven by: Roger’s more aggressive financial policy recently, as evidenced by the acquisition of Prisma, the Company’s recent debt raise and the Kevin acquisition show a willingness to take on additional debt Significant increase in cash-flow based leverage metrics, with Debt / FEBITDA rising to over 5.0x and no direct increase in FEBITDA as a result of the transaction Increased volatility in earnings driven by Kevin’s portfolio coming on balance sheet for Roger Roger’s positioning of the acquisition may support S&P and Fitch downgrading one notch rather than two. In GS’s view Roger should position the acquisition as: A one-time strategic acquisition that will increase leverage modestly, but is at an attractive price. Further Roger showing commitment (both to the agencies and the market) to deleveraging from this acquisition will be important to maintaining ratings A significant positive from a balance sheet perspective as the quality of assets on the Company’s balance sheet will increase pro forma. Additionally, Roger’s assets (net of cash) to debt will be ~3.5x pro forma. Even with a significant haircut to the value of Roger’s assets, the debt is still well-covered by just balance sheet assets Continued growth in Roger’s core business, led by consolidation amongst institutional investors and asset managers, will support enhanced AUM Should Roger require ratings clarity/confirmation prior to announcing the deal/tapping the markets, GS recommends conducting a RES/RAS process with the agencies in order to have certainty around the ratings outcome: The RES/RAS process allows Roger to bring up to 3 scenarios to the agencies which they will provide ratings outcomes on GS can help devise the scenarios to maximize the clarity that the agencies provide in an attempt to establish the inflection point in the ratings Initial Credit Views on Pro Forma Entity Credit Considerations |
| IV. Illustrative Merger Plans |
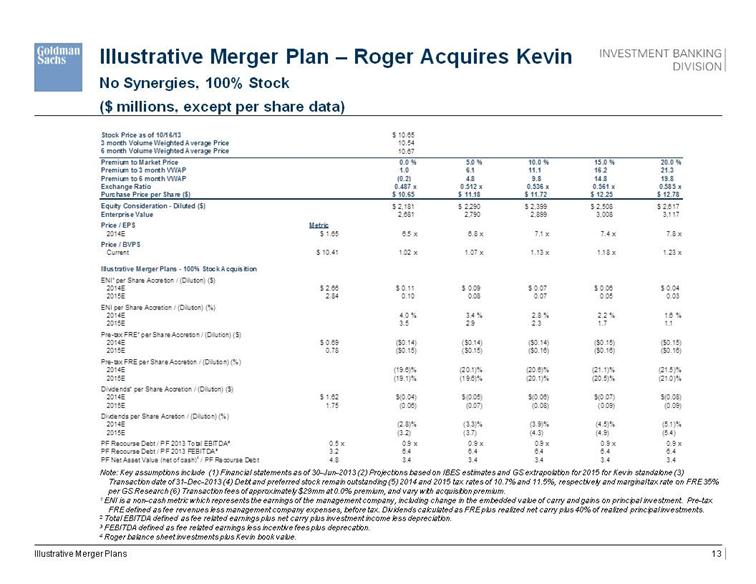
| Illustrative Merger Plan – Roger Acquires Kevin No Synergies, 100% Stock ($ millions, except per share data) Note: Key assumptions include (1) Financial statements as of 30-Jun-2013 (2) Projections based on IBES estimates and GS extrapolation for 2015 for Kevin standalone (3) Transaction date of 31-Dec-2013 (4) Debt and preferred stock remain outstanding (5) 2014 and 2015 tax rates of 10.7% and 11.5%, respectively and marginal tax rate on FRE 35% per GS Research (6) Transaction fees of approximately $29mm at 0.0% premium, and vary with acquisition premium. 1 ENI is a non-cash metric which represents the earnings of the management company, including change in the embedded value of carry and gains on principal investment. Pre-tax FRE defined as fee revenues less management company expenses, before tax. Dividends calculated as FRE plus realized net carry plus 40% of realized principal investments. 2 Total EBITDA defined as fee related earnings plus net carry plus investment income less depreciation. 3 FEBITDA defined as fee related earnings less incentive fees plus deprecation. 4 Roger balance sheet investments plus Kevin book value. Illustrative Merger Plans Stock Price as of 10/16/13 $ 10.65 3 month Volume Weighted Average Price 10.54 6 month Volume Weighted Average Price 10.67 Premium to Market Price 0.0 % 5.0 % 10.0 % 15.0 % 20.0 % Premium to 3 month VWAP 1.0 6.1 11.1 16.2 21.3 Premium to 6 month VWAP (0.2) 4.8 9.8 14.8 19.8 Exchange Ratio 0.487 x 0.512 x 0.536 x 0.561 x 0.585 x Purchase Price per Share ($) $ 10.65 $ 11.18 $ 11.72 $ 12.25 $ 12.78 Equity Consideration - Diluted ($) $ 2,181 $ 2,290 $ 2,399 $ 2,508 $ 2,617 Enterprise Value 2,681 2,790 2,899 3,008 3,117 Price / EPS Metric 2014E $ 1.65 6.5 x 6.8 x 7.1 x 7.4 x 7.8 x Price / BVPS Current $ 10.41 1.02 x 1.07 x 1.13 x 1.18 x 1.23 x Illustrative Merger Plans - 100% Stock Acquisition ENI ¹ per Share Accretion / (Dilution) ( $ ) 2014E $ 2.66 $ 0.11 $ 0.09 $ 0.07 $ 0.06 $ 0.04 2015E 2.84 0.10 0.08 0.07 0.05 0.03 ENI per Share Accretion / (Dilution) (%) 2014E 4.0 % 3.4 % 2.8 % 2.2 % 1.6 % 2015E 3.5 2.9 2.3 1.7 1.1 Pre-tax FRE 1 per Share Accretion / (Dilution) ($) 2014E $ 0.69 ($0.14) ($0.14) ($0.14) ($0.15) ($0.15) 2015E 0.78 ($0.15) ($0.15) ($0.16) ($0.16) ($0.16) Pre-tax FRE per Share Accretion / (Dilution) (%) 2014E (19.6)% (20.1)% (20.6)% (21.1)% (21.5)% 2015E (19.1)% (19.6)% (20.1)% (20.5)% (21.0)% Dividends 1 per Share Accretion / (Dilution) ($) 2014E $ 1.62 $(0.04) $(0.05) $(0.06) $(0.07) $(0.08) 2015E 1.75 (0.06) (0.07) (0.08) (0.09) (0.09) Divdends per Share Acretion / (Dilution) (%) 2014E (2.8)% (3.3)% (3.9)% (4.5)% (5.1)% 2015E (3.2) (3.7) (4.3) (4.9) (5.4) PF Recourse Debt / PF 2013 Total EBITDA 2 0.5 x 0.9 x 0.9 x 0.9 x 0.9 x 0.9 x PF Recourse Debt / PF 2013 FEBITDA 3 3.2 6.4 6.4 6.4 6.4 6.4 PF Net Asset Value (net of cash) 4 / PF Recourse Debt 4.8 3.4 3.4 3.4 3.4 3.4 |
| V. Selected Precedent Transactions |
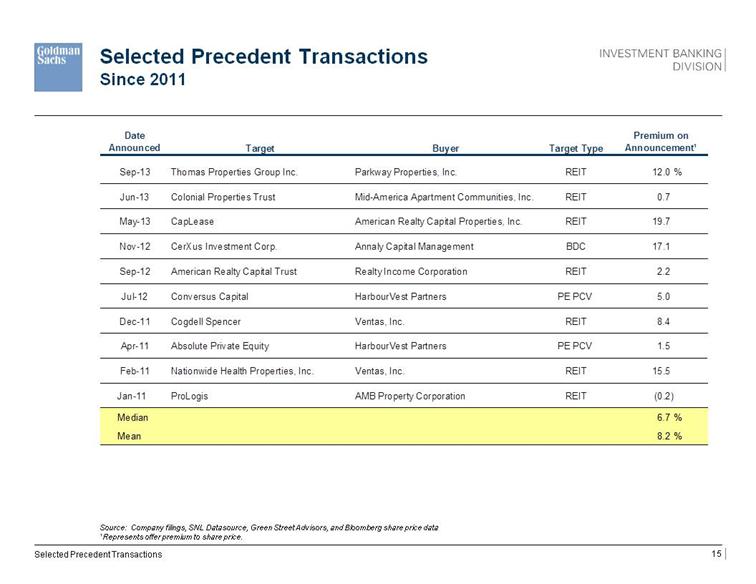
| 3 4 Selected Precedent Transactions Since 2011 Source: Company filings, SNL Datasource, Green Street Advisors, and Bloomberg share price data ¹ Represents offer premium to share price. Selected Precedent Transactions Date Announced Target Buyer Target Type Premium on Announcement¹ Sep-13 Thomas Properties Group Inc. Parkway Properties, Inc. REIT 12.0 % Jun-13 Colonial Properties Trust Mid-America Apartment Communities, Inc. REIT 0.7 May-13 CapLease American Realty Capital Properties, Inc. REIT 19.7 Nov-12 CerXus Investment Corp. Annaly Capital Management BDC 17.1 Sep-12 American Realty Capital Trust Realty Income Corporation REIT 2.2 Jul-12 Conversus Capital HarbourVest Partners PE PCV 5.0 Dec-11 Cogdell Spencer Ventas, Inc. REIT 8.4 Apr-11 Absolute Private Equity HarbourVest Partners PE PCV 1.5 Feb-11 Nationwide Health Properties, Inc. Ventas, Inc. REIT 15.5 Jan-11 ProLogis AMB Property Corporation REIT (0.2) Median 6.7 % Mean 8.2 % |
| VI. Shareholder Analysis |
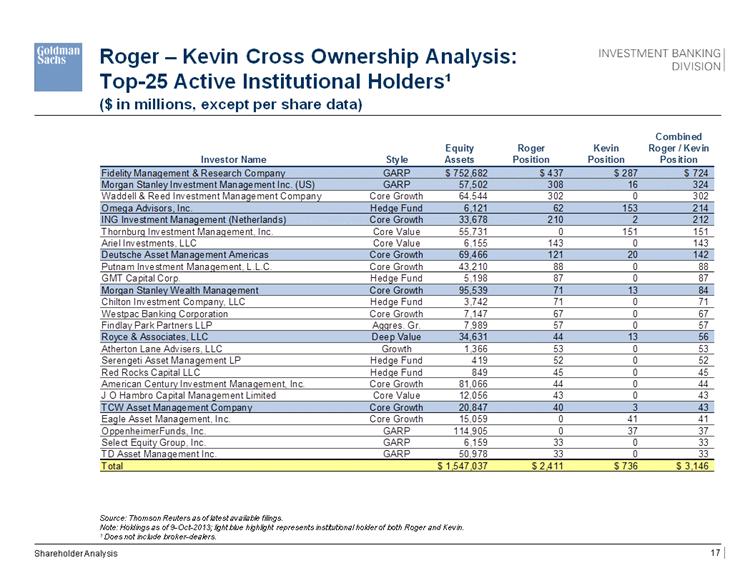
| ($ in millions, except per share data)1 2 3 4 Roger – Kevin Cross Ownership Analysis: Top-25 Active Institutional Holders¹ Source: Thomson Reuters as of latest available filings. Note: Holdings as of 9-Oct-2013; light blue highlight represents institutional holder of both Roger and Kevin. 1 Does not include broker-dealers. Shareholder Analysis Combined Equity Roger Kevin Roger / Kevin Investor Name Style Assets Position Position Position Fidelity Management & Research Company GARP $ 752,682 $ 437 $ 287 $ 724 Morgan Stanley Investment Management Inc. (US) GARP 57,502 308 16 324 Waddell & Reed Investment Management Company Core Growth 64,544 302 0 302 Omega Advisors, Inc. Hedge Fund 6,121 62 153 214 ING Investment Management (Netherlands) Core Growth 33,678 210 2 212 Thornburg Investment Management, Inc. Core Value 55,731 0 151 151 Ariel Investments, LLC Core Value 6,155 143 0 143 Deutsche Asset Management Americas Core Growth 69,466 121 20 142 Putnam Investment Management, L.L.C. Core Growth 43,210 88 0 88 GMT Capital Corp. Hedge Fund 5,198 87 0 87 Morgan Stanley Wealth Management Core Growth 95,539 71 13 84 Chilton Investment Company, LLC Hedge Fund 3,742 71 0 71 Westpac Banking Corporation Core Growth 7,147 67 0 67 Findlay Park Partners LLP Aggres. Gr. 7,989 57 0 57 Royce & Associates, LLC Deep Value 34,631 44 13 56 Atherton Lane Advisers, LLC Growth 1,366 53 0 53 Serengeti Asset Management LP Hedge Fund 419 52 0 52 Red Rocks Capital LLC Hedge Fund 849 45 0 45 American Century Investment Management, Inc. Core Growth 81,066 44 0 44 J O Hambro Capital Management Limited Core Value 12,056 43 0 43 TCW Asset Management Company Core Growth 20,847 40 3 43 Eagle Asset Management, Inc. Core Growth 15,059 0 41 41 OppenheimerFunds, Inc. GARP 114,905 0 37 37 Select Equity Group, Inc. GARP 6,159 33 0 33 TD Asset Management Inc. GARP 50,978 33 0 33 Total $ 1,547,037 $ 2,411 $ 736 $ 3,146 |
| Appendix A: Select Precedent Transaction Detail |
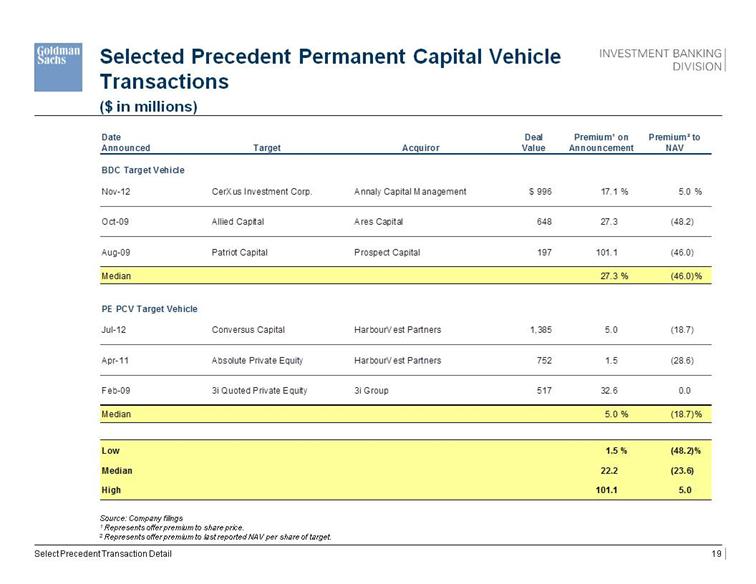
| Source: Company filings 1 Represents offer premium to share price. 2 Represents offer premium to last reported NAV per share of target. Selected Precedent Permanent Capital Vehicle Transactions ($ in millions) Select Precedent Transaction Detail Date Deal Premium ¹ on Premium ² to Announced Target Acquiror Value Announcement NAV BDC Target Vehicle Nov-12 CerXus Investment Corp. Annaly Capital Management $ 996 17.1 % 5.0 % Oct-09 Allied Capital Ares Capital 648 27.3 (48.2) Aug-09 Patriot Capital Prospect Capital 197 101.1 (46.0) Median 27.3 % (46.0)% PE PCV Target Vehicle Jul-12 Conversus Capital HarbourVest Partners 1,385 5.0 (18.7) Apr-11 Absolute Private Equity HarbourVest Partners 752 1.5 (28.6) Feb-09 3i Quoted Private Equity 3i Group 517 32.6 0.0 Median 5.0 % (18.7)% Low 1.5 % (48.2)% Median 22.2 (23.6) High 101.1 5.0 |
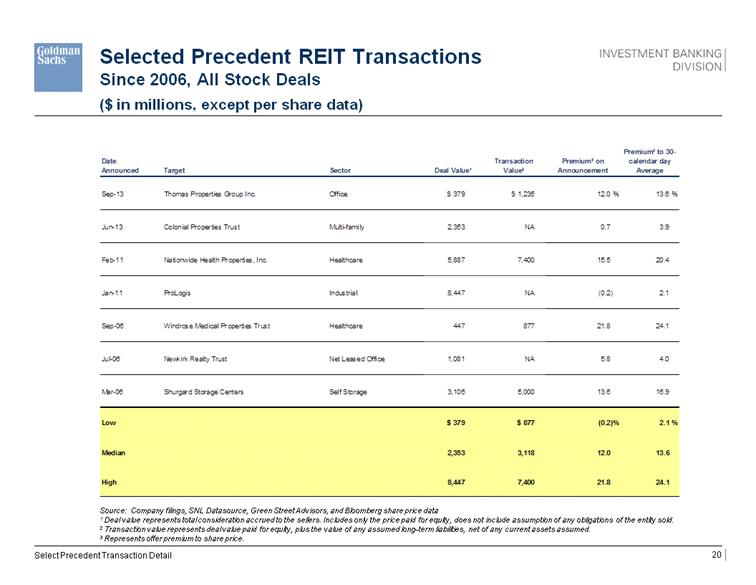
| ($ in millions, except per share data)1 2 3 4 Selected Precedent REIT Transactions Since 2006, All Stock Deals Source: Company filings, SNL Datasource, Green Street Advisors, and Bloomberg share price data 1 Deal value represents total consideration accrued to the sellers. Includes only the price paid for equity, does not include assumption of any obligations of the entity sold. 2 Transaction value represents deal value paid for equity, plus the value of any assumed long-term liabilities, net of any current assets assumed. 3 Represents offer premium to share price. Select Precedent Transaction Detail Date Announced Target Sector Deal Value ¹ Transaction Value 2 Premium 3 on Announcement Premium 3 to 30-calendar day Average Sep-13 Thomas Properties Group Inc. Office $ 379 $ 1,235 12.0 % 13.6 % Jun-13 Colonial Properties Trust Multi-family 2,353 NA 0.7 3.9 Feb-11 Nationwide Health Properties, Inc. Healthcare 5,887 7,400 15.5 20.4 Jan-11 ProLogis Industrial 8,447 NA (0.2) 2.1 Sep-06 Windrose Medical Properties Trust Healthcare 447 877 21.8 24.1 Jul-06 Newkirk Realty Trust Net Leased Office 1,081 NA 5.8 4.0 Mar-06 Shurgard Storage Centers Self Storage 3,106 5,000 13.6 16.9 Low $ 379 $ 877 (0.2)% 2.1 % Median 2,353 3,118 12.0 13.6 High 8,447 7,400 21.8 24.1 |
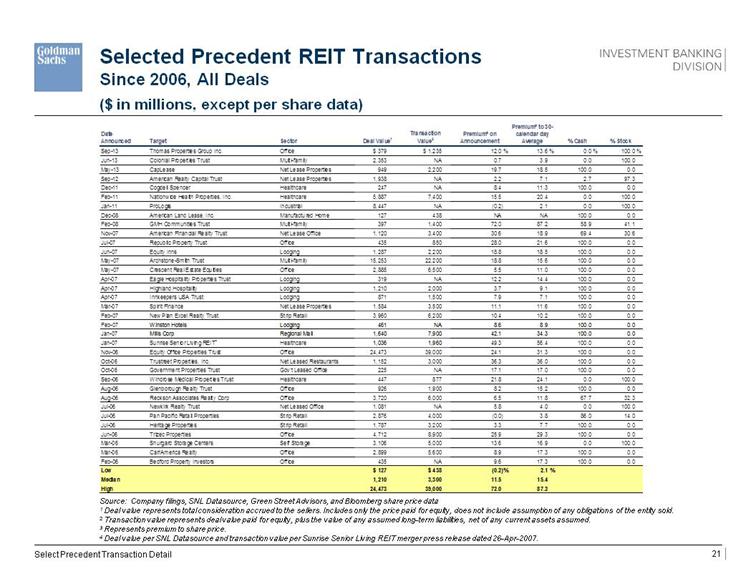
| Selected Precedent REIT Transactions Since 2006, All Deals ($ in millions, except per share data)1 2 3 4 Source: Company filings, SNL Datasource, Green Street Advisors, and Bloomberg share price data 1 Deal value represents total consideration accrued to the sellers. Includes only the price paid for equity, does not include assumption of any obligations of the entity sold. 2 Transaction value represents deal value paid for equity, plus the value of any assumed long-term liabilities, net of any current assets assumed. 3 Represents premium to share price. 4 Deal value per SNL Datasource and transaction value per Sunrise Senior Living REIT merger press release dated 26-Apr-2007. Select Precedent Transaction Detail Date Announced Target Sector Deal Value 1 Transaction Value 2 Premium 3 on Announcement Premium 3 to 30-calendar day Average % Cash % Stock Sep-13 Thomas Properties Group Inc. Office $ 379 $ 1,235 12.0 % 13.6 % 0.0 % 100.0 % Jun-13 Colonial Properties Trust Multi-family 2,353 NA 0.7 3.9 0.0 100.0 May-13 CapLease Net Lease Properties 949 2,200 19.7 18.5 100.0 0.0 Sep-12 American Realty Capital Trust Net Lease Properties 1,938 NA 2.2 7.1 2.7 97.3 Dec-11 Cogdell Spencer Healthcare 247 NA 8.4 11.3 100.0 0.0 Feb-11 Nationwide Health Properties, Inc. Healthcare 5,887 7,400 15.5 20.4 0.0 100.0 Jan-11 ProLogis Industrial 8,447 NA (0.2) 2.1 0.0 100.0 Dec-08 American Land Lease, Inc. Manufactured Home 127 438 NA NA 100.0 0.0 Feb-08 GMH Communities Trust Multi-family 397 1,400 72.0 87.2 58.9 41.1 Nov-07 American Financial Realty Trust Net Lease Office 1,120 3,400 30.6 18.9 69.4 30.6 Jul-07 Republic Property Trust Office 435 850 28.0 21.6 100.0 0.0 Jun-07 Equity Inns Lodging 1,287 2,200 18.8 18.5 100.0 0.0 May-07 Archstone-Smith Trust Multi-family 15,253 22,200 18.8 15.6 100.0 0.0 May-07 Crescent Real Estate Equities Office 2,885 6,500 5.5 11.0 100.0 0.0 Apr-07 Eagle Hospitality Properties Trust Lodging 319 NA 12.2 14.4 100.0 0.0 Apr-07 Highland Hospitality Lodging 1,210 2,000 3.7 9.1 100.0 0.0 Apr-07 Innkeepers USA Trust Lodging 871 1,500 7.9 7.1 100.0 0.0 Mar-07 Spirit Finance Net Lease Properties 1,584 3,500 11.1 11.6 100.0 0.0 Feb-07 New Plan Excel Realty Trust Strip Retail 3,960 6,200 10.4 10.2 100.0 0.0 Feb-07 Winston Hotels Lodging 461 NA 8.6 8.9 100.0 0.0 Jan-07 Mills Corp Regional Mall 1,640 7,900 42.1 34.3 100.0 0.0 Jan-07 Sunrise Senior Living REIT 4 Healthcare 1,036 1,960 49.3 56.4 100.0 0.0 Nov-06 Equity Office Properties Trust Office 24,473 39,000 24.1 31.3 100.0 0.0 Oct-06 Trustreet Properties, Inc. Net Leased Restaurants 1,152 3,000 36.3 36.0 100.0 0.0 Oct-06 Government Properties Trust Gov't Leased Office 225 NA 17.1 17.0 100.0 0.0 Sep-06 Windrose Medical Properties Trust Healthcare 447 877 21.8 24.1 0.0 100.0 Aug-06 Glenborough Realty Trust Office 926 1,900 8.2 15.2 100.0 0.0 Aug-06 Reckson Associates Realty Corp Office 3,720 6,000 6.5 11.8 67.7 32.3 Jul-06 Newkirk Realty Trust Net Leased Office 1,081 NA 5.8 4.0 0.0 100.0 Jul-06 Pan Pacific Retail Properties Strip Retail 2,876 4,000 (0.0) 3.8 86.0 14.0 Jul-06 Heritage Properties Strip Retail 1,787 3,200 3.3 7.7 100.0 0.0 Jun-06 Trizec Properties Office 4,712 8,900 25.9 29.3 100.0 0.0 Mar-06 Shurgard Storage Centers Self Storage 3,106 5,000 13.6 16.9 0.0 100.0 Mar-06 CarrAmerica Realty Office 2,899 5,600 8.9 17.3 100.0 0.0 Feb-06 Bedford Property Investors Office 435 NA 9.6 17.3 100.0 0.0 Low $ 127 $ 438 (0.2)% 2.1 % Median 1,210 3,300 11.5 15.4 High 24,473 39,000 72.0 87.2 |
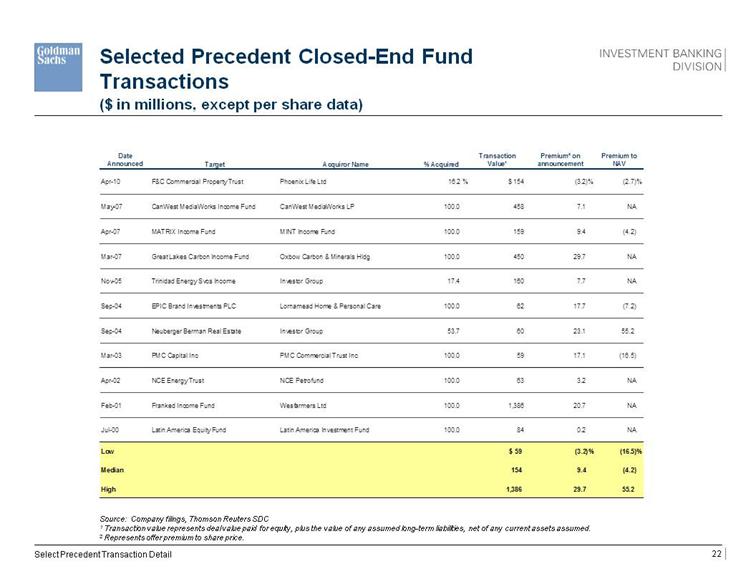
| ($ in millions, except per share data)1 2 3 4 Selected Precedent Closed-End Fund Transactions Source: Company filings, Thomson Reuters SDC 1 Transaction value represents deal value paid for equity, plus the value of any assumed long-term liabilities, net of any current assets assumed. 2 Represents offer premium to share price. Select Precedent Transaction Detail Date Announced Target Acquiror Name % Acquired Transaction Value1 Premium1 on announcement Premium to NAV Apr-10 F&C Commercial Property Trust Phoenix Life Ltd 16.2 % $ 154 (3.2)% (2.7)% May-07 CanWest MediaWorks Income Fund CanWest MediaWorks LP 100.0 458 7.1 NA Apr-07 MATRIX Income Fund MINT Income Fund 100.0 159 9.4 (4.2) Mar-07 Great Lakes Carbon Income Fund Oxbow Carbon & Minerals Hldg 100.0 450 29.7 NA Nov-05 Trinidad Energy Svcs Income Investor Group 17.4 160 7.7 NA Sep-04 EPIC Brand Investments PLC Lornamead Home & Personal Care 100.0 62 17.7 (7.2) Sep-04 Neuberger Berman Real Estate Investor Group 53.7 60 23.1 55.2 Mar-03 PMC Capital Inc PMC Commercial Trust Inc 100.0 59 17.1 (16.5) Apr-02 NCE Energy Trust NCE Petrofund 100.0 63 3.2 NA Feb-01 Franked Income Fund Wesfarmers Ltd 100.0 1,386 20.7 NA Jul-00 Latin America Equity Fund Latin America Investment Fund 100.0 84 0.2 NA Low $ 59 (3.2)% (16.5)% Median 154 9.4 (4.2) High 1,386 29.7 55.2 |
| Appendix B: Select Transaction Synopses |
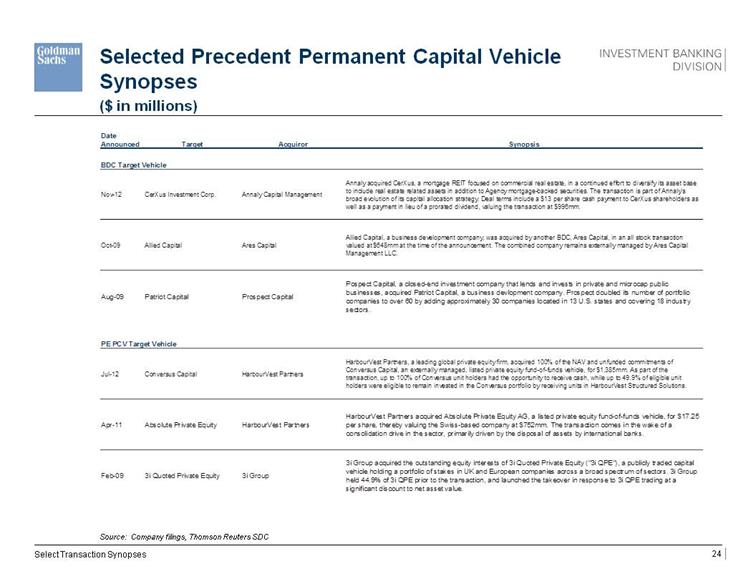
| ($ in millions)1 2 3 4 Selected Precedent Permanent Capital Vehicle Synopses Source: Company filings, Thomson Reuters SDC Select Transaction Synopses Date Announced Target Acquiror Synopsis BDC Target Vehicle Nov-12 CerXus Investment Corp. Annaly Capital Management Annaly acquired CerXus, a mortgage REIT focused on commercial real estate, in a continued effort to diversify its asset base to include real estate related assets in addition to Agency mortgage-backed securities. The transaction is part of Annaly's broad evolution of its capital allocation strategy. Deal terms include a $13 per share cash payment to CerXus shareholders as well as a payment in lieu of a prorated dividend, valuing the transaction at $996mm. Oct-09 Allied Capital Ares Capital Allied Capital, a business development company, was acquired by another BDC, Ares Capital, in an all stock transaction valued at $648mm at the time of the announcement. The combined company remains externally managed by Ares Capital Management LLC. Aug-09 Patriot Capital Prospect Capital Pospect Capital, a closed-end investment company that lends and invests in private and microcap public businesses, acquired Patriot Capital, a business devlopment company. Prospect doubled its number of portfolio companies to over 60 by adding approximately 30 companies located in 13 U.S. states and covering 18 industry sectors. PE PCV Target Vehicle Jul-12 Conversus Capital HarbourVest Partners HarbourVest Partners, a leading global private equity firm, acquired 100% of the NAV and unfunded commitments of Conversus Capital, an externally managed, listed private equity fund-of-funds vehicle, for $1,385mm. As part of the transaction, up to 100% of Conversus unit holders had the opportunity to receive cash, while up to 49.9% of eligible unit holders were eligible to remain invested in the Conversus portfolio by receiving units in HarbourVest Structured Solutions. Apr-11 Absolute Private Equity HarbourVest Partners HarbourVest Partners acquired Absolute Private Equity AG, a listed private equity fund-of-funds vehicle, for $17.25 per share, thereby valuing the Swiss-based company at $752mm. The transaction comes in the wake of a consolidation drive in the sector, primarily driven by the disposal of assets by international banks. Feb-09 3i Quoted Private Equity 3i Group 3i Group acquired the outstanding equity interests of 3i Quoted Private Equity ("3i QPE"), a publicly traded capital vehicle holding a portfolio of stakes in UK and European companies across a broad spectrum of sectors. 3i Group held 44.9% of 3i QPE prior to the transaction, and launched the takeover in response to 3i QPE trading at a significant discount to net asset value. |
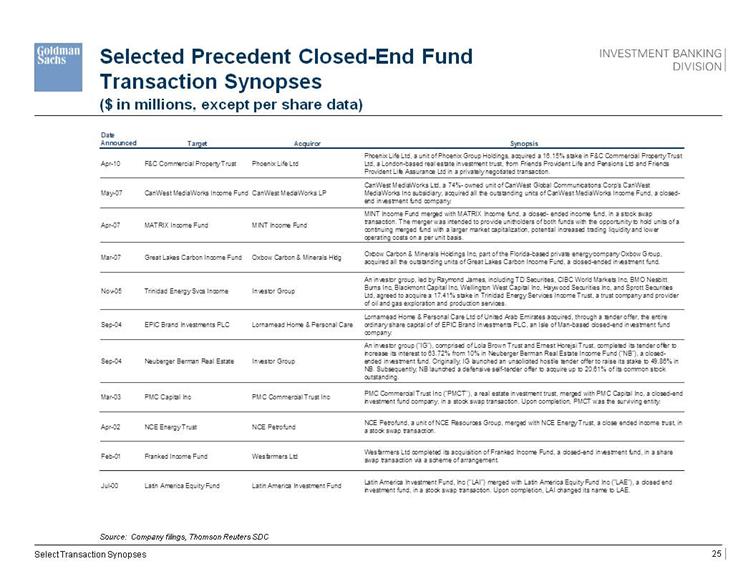
| ($ in millions, except per share data)1 2 3 4 Selected Precedent Closed-End Fund Transaction Synopses Source: Company filings, Thomson Reuters SDC Select Transaction Synopses Date Announced Target Acquiror Synopsis Apr-10 F&C Commercial Property Trust Phoenix Life Ltd Phoenix Life Ltd, a unit of Phoenix Group Holdings, acquired a 16.15% stake in F&C Commercial Property Trust Ltd, a London-based real estate investment trust, from Friends Provident Life and Pensions Ltd and Friends Provident Life Assurance Ltd in a privately negotiated transaction. May-07 CanWest MediaWorks Income Fund CanWest MediaWorks LP CanWest MediaWorks Ltd, a 74%- owned unit of CanWest Global Communications Corp's CanWest MediaWorks Inc subsidiary, acquired all the outstanding units of CanWest MediaWorks Income Fund, a closed- end investment fund company. Apr-07 MATRIX Income Fund MINT Income Fund MINT Income Fund merged with MATRIX Income fund, a closed- ended income fund, in a stock swap transaction. The merger was intended to provide unitholders of both funds with the opportunity to hold units of a continuing merged fund with a larger market capitalization, potential increased trading liquidity and lower operating costs on a per unit basis. Mar-07 Great Lakes Carbon Income Fund Oxbow Carbon & Minerals Hldg Oxbow Carbon & Minerals Holdings Inc, part of the Florida-based private energy company Oxbow Group, acquired all the outstanding units of Great Lakes Carbon Income Fund, a closed-ended investment fund. Nov-05 Trinidad Energy Svcs Income Investor Group An investor group, led by Raymond James, including TD Securities, CIBC World Markets Inc, BMO Nesbitt Burns Inc, Blackmont Capital Inc, Wellington West Capital Inc, Haywood Securities Inc, and Sprott Securities Ltd, agreed to acquire a 17.41% stake in Trinidad Energy Services Income Trust, a trust company and provider of oil and gas exploration and production services. Sep-04 EPIC Brand Investments PLC Lornamead Home & Personal Care Lornamead Home & Personal Care Ltd of United Arab Emirates acquired, through a tender offer, the entire ordinary share capital of of EPIC Brand Investments PLC, an Isle of Man-based closed-end investment fund company. Sep-04 Neuberger Berman Real Estate Investor Group An investor group ("IG"), comprised of Lola Brown Trust and Ernest Horejsi Trust, completed its tender offer to increase its interest to 63.72% from 10% in Neuberger Berman Real Estate Income Fund ("NB"), a closed- ended investment fund. Originally, IG launched an unsolicited hostile tender offer to raise its stake to 49.86% in NB. Subsequently, NB launched a defensive self-tender offer to acquire up to 20.61% of its common stock outstanding. Mar-03 PMC Capital Inc PMC Commercial Trust Inc PMC Commercial Trust Inc ("PMCT"), a real estate investment trust, merged with PMC Capital Inc, a closed-end investment fund company, in a stock swap transaction. Upon completion, PMCT was the surviving entity. Apr-02 NCE Energy Trust NCE Petrofund NCE Petrofund, a unit of NCE Resources Group, merged with NCE Energy Trust, a close ended income trust, in a stock swap transaction. Feb-01 Franked Income Fund Wesfarmers Ltd Wesfarmers Ltd completed its acquisition of Franked Income Fund, a closed-end investment fund, in a share swap transaction via a scheme of arrangement. Jul-00 Latin America Equity Fund Latin America Investment Fund Latin America Investment Fund, Inc ("LAI") merged with Latin America Equity Fund Inc ("LAE"), a closed end investment fund, in a stock swap transaction. Upon completion, LAI changed its name to LAE. |