Exhibit (c)(11)
| December 10, 2013 Presentation Regarding Project WILDCATS Strictly Private & Confidential SANDLER O’NEILL + PARTNERS, L.P. |

| GENERAL INFORMATION AND LIMITATIONS This presentation, and the oral or video presentation that supplements it, have been developed by and are proprietary to Sandler O'Neill & Partners, L.P. and were prepared exclusively for the benefit and internal use of the recipient. Neither the printed presentation nor the oral or video presentation that supplements it, nor any of their contents, may be reproduced, distributed or used for any other purpose without the prior written consent of Sandler O'Neill & Partners, L.P. The analyses contained herein rely upon information obtained from the recipient or from public sources, the accuracy of which has not been verified, and cannot be assured, by Sandler O'Neill & Partners, L.P. Moreover, many of the projections and financial analyses herein are based on estimated financial performance prepared by or in consultation with the recipient and are intended only to suggest reasonable ranges of results. Finally, the printed presentation is incomplete without the oral or video presentation that supplements it. Sandler O’Neill & Partners, L.P. prohibits employees from offering, directly or indirectly, favorable research, a specific rating or a specific price target, or offering or threatening to change research, a rating or a price target to a company as consideration or inducement for the receipt of business or compensation. The Firm also prohibits research analysts from being compensated for their involvement in, or based upon, specific investment banking transactions. Sandler O'Neill & Partners, L.P. is a limited partnership, the sole general partner of which is Sandler O'Neill & Partners Corp., a New York corporation. Sandler O'Neill & Partners, L.P. is a registered broker-dealer and a member of the Financial Industry Regulatory Authority. Sandler O'Neill Mortgage Finance L.P. is an indirect subsidiary of Sandler O'Neill & Partners Corp. This material is protected under applicable copyright laws and does not carry any rights of publication or disclosure. |
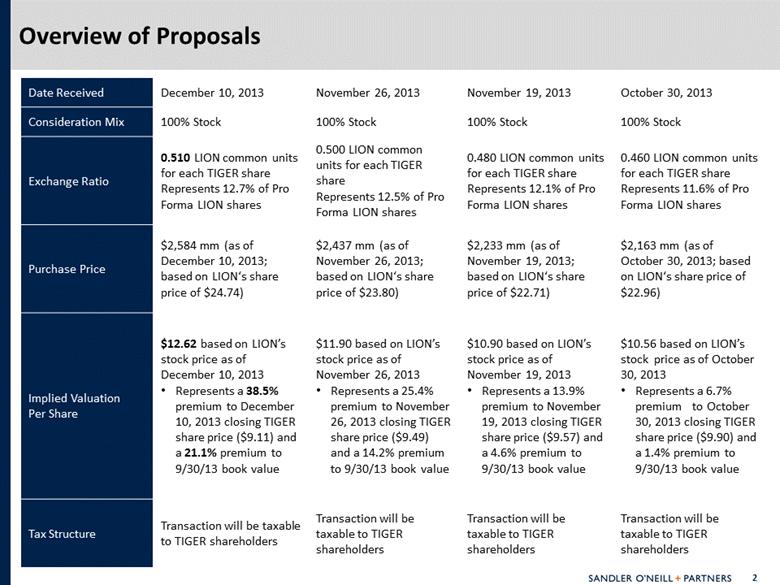
| Date Received December 10, 2013 November 26, 2013 November 19, 2013 October 30, 2013 Consideration Mix 100% Stock 100% Stock 100% Stock 100% Stock Exchange Ratio 0.510 LION common units for each TIGER share Represents 12.7% of Pro Forma LION shares 0.500 LION common units for each TIGER share Represents 12.5% of Pro Forma LION shares 0.480 LION common units for each TIGER share Represents 12.1% of Pro Forma LION shares 0.460 LION common units for each TIGER share Represents 11.6% of Pro Forma LION shares Purchase Price $2,584 mm (as of December 10, 2013; based on LION‘s share price of $24.74) $2,437 mm (as of November 26, 2013; based on LION‘s share price of $23.80) $2,233 mm (as of November 19, 2013; based on LION‘s share price of $22.71) $2,163 mm (as of October 30, 2013; based on LION‘s share price of $22.96) Implied Valuation Per Share $12.62 based on LION’s stock price as of December 10, 2013 Represents a 38.5% premium to December 10, 2013 closing TIGER share price ($9.11) and a 21.1% premium to 9/30/13 book value $11.90 based on LION’s stock price as of November 26, 2013 Represents a 25.4% premium to November 26, 2013 closing TIGER share price ($9.49) and a 14.2% premium to 9/30/13 book value $10.90 based on LION’s stock price as of November 19, 2013 Represents a 13.9% premium to November 19, 2013 closing TIGER share price ($9.57) and a 4.6% premium to 9/30/13 book value $10.56 based on LION’s stock price as of October 30, 2013 Represents a 6.7% premium to October 30, 2013 closing TIGER share price ($9.90) and a 1.4% premium to 9/30/13 book value Tax Structure Transaction will be taxable to TIGER shareholders Transaction will be taxable to TIGER shareholders Transaction will be taxable to TIGER shareholders Transaction will be taxable to TIGER shareholders Overview of Proposals |
| Proposal Value 1. TIGER book value is $10.42 as of 9/30/13 0.460 0.480 0.500 0.510 Exchange Ratio Exchange Ratio Exchange Ratio Exchange Ratio Date 10/30/2013 11/19/2013 11/26/2013 12/10/2013 10-Day VWAP 52 Week VWAP LION Share Price $22.96 $22.71 $23.80 $24.74 $23.87 $19.52 Implied Purchase Price $10.56 $10.90 $11.90 $12.62 $12.17 $9.96 Implied Total Purchase Price ($mm) $2,163 $2,233 $2,437 $2,584 $2,493 $2,039 TIGER Share Price $9.90 $9.57 $9.49 $9.11 $9.36 $10.59 Premium to TIGER Price at Offer Date 6.7% 13.9% 25.4% 38.5% 33.6% 9.3% 10-Day VWAP 12.8% 16.5% 27.1% 34.8% 30.1% 6.4% 52 Week VWAP (0.3%) 2.9% 12.4% 19.1% 15.0% (6.0%) 52 Week High (11.5%) (8.6%) (0.3%) 5.8% 2.0% (16.6%) Premium to TIGER Book Value (1) 1.4% 4.6% 14.2% 21.1% 16.8% (4.5%) |
| Implied Value of Proposal at Exchange Ratio of 0.510 Pricing as of December 10, 2013 Source: SNL Financial $5.00 $10.00 $15.00 $20.00 $25.00 12/10/2012 2/10/2013 4/10/2013 6/10/2013 8/10/2013 10/10/2013 12/10/2013 LION Share Price TIGER Share Price Implied TIGER Valuation Per Share |
| An examination of selected1 affiliated party financial services transactions indicated the following: The final offer price is a market premium in excess of 20% to the initial share price before offer The final offer is most often at a premium in excess of 10% to the initial offer The buyer typically submits 3-5 bids before agreeing to price with the seller In several cases the seller announced the existence of an offer to the public during the negotiating process M&A Perspective: Recent Affiliated-Party Financial Services Transactions Observations 1. Transactions involving U.S. based publicly-traded targets in the financial services industry with deal values between $500 million and $5 billion since January 1, 2007 where acquirer owned at least 10% of target pre –transaction and acquired 100% of the remaining stock. Source: SNL Financial, Thompson IB, SEC filings Annc. Date Buyer Target Deal Value ($ mm) Stock Price Before Initial Offer or Rumor Initial Offer 1 Final Offer Total Rounds of Offers Initial Premium to Initial Stock Price Final Premium to Initial Stock Price Increase to Initial Offer 11/12/2012 Annaly Capital Management Inc CreXus Investment Corp $876 $11.10 $12.50 $13.05 4 12.6% 17.6% 4.4% 11/12/2012 Leucadia National Corp Jefferies Group Inc $2,924 $14.27 $16.46 $17.66 2 15.4% 23.7% 7.3% 10/13/2008 Banco Santander SA Sovereign Bancorp Inc $1,910 $3.81 $3.81 $3.81 1 0.0% 0.0% 0.0% 08/12/2008 Bank of Tokyo-Mitsubishi UFJ Ltd UnionBanCal Corp,CA $3,808 $53.02 $58.00 $73.50 3 9.4% 38.6% 26.7% 03/10/2008 Nationwide Mutual Insurance Co Nationwide Finl Svcs Inc $2,471 $40.00 $47.20 $52.25 3 18.0% 30.6% 10.7% 07/17/2007 Alfa Mutual Alfa Corp $833 $15.20 $17.60 $22.00 5 15.8% 44.7% 25.0% 11/20/2006 Toronto-Dominion Bank TD Banknorth Inc $3,201 $28.81 $32-34 $32.33 6 14.5% 12.2% (2.0%) Mean 3.4 12.2% 23.9% 10.3% Median 3.0 14.5% 23.7% 7.3% -- LION TIGER $10.00 $10.56 $12.62 4 5.6% 26.2% 19.5% |
| Overview of Transactions Involving Asset Vehicles Source: SNL Financial 1. Represents offer premium to share price 2. Represents offer premium to NAV per share 3. Based on materials prepared by Sandler O’Neill 4. Indicates internally managed investment vehicle Date Target Premium on Premium to Announced Target Type Buyer Type Announcement 1 NAV 2,3 % Stock % Cash 10/22/13 Cole Real Estate Investments, Inc. Net Lease American Realty Capital Properties, Inc. REIT 4 13.8% 23.0% 81% 19% 09/04/13 Thomas Properties Group, Inc. Office Parkway Properties, Inc. REIT 4 12.0% NM 100% 0% 06/03/13 Colonial Properties Trust Apartment Mid-America Apartment Communities, Inc. REIT 4 0.7% (8.4)% 100% 0% 05/28/13 CapLease, Inc. Net Lease American Realty Capital Properties, Inc. REIT 4 19.7% 16.9% 0% 100% 01/30/13 CreXus Investment Corp. Mortgage Annaly Capital Management, Inc. REIT 4 17.1% NM 0% 100% 09/06/12 American Realty Capital Trust, Inc. Net Lease Realty Income Corporation REIT 4 2.2% 13.3% 97% 3% 07/02/12 Conversus Capital PE Interests HarbourVest Partners PE PCV 5.0% (18.7)% >50.1% <49.9% 12/24/11 Cogdell Spencer Inc. Healthcare / Medical Office Ventas, Inc. REIT 4 8.4% (20.0)% 0% 100% 04/21/11 Absolute Private Equity PE Fund of Funds HarbourVest Partners PE PCV 1.5% (28.6)% 0% 100% 02/27/11 Nationwide Health Properties, Inc. Healthcare Ventas, Inc. REIT 4 15.5% 56.3% 100% 0% 01/30/11 ProLogis Industrial AMB Property Corporation REIT 4 (0.2)% NM 100% 0% Mean 8.7% 4.2% Median 8.4% 2.5% -- TIGER -- LION -- 38.5% 21.1% 100% 0% |