Exhibit (c)(18)
| Project Copal Presentation to Roger Board of Directors December 15, 2013 Goldman Sachs does not provide accounting, tax, or legal advice. Notwithstanding anything in this document to the contrary, and except as required to enable compliance with applicable securities law, you (and each of your employees, representatives, and other agents) may disclose to any and all persons the US federal income and state tax treatment and tax structure of the transaction and all materials of any kind (including tax opinions and other tax analyses) that are provided to you relating to such tax treatment and tax structure, without Goldman Sachs imposing any limitation of any kind. |
| Disclaimer Goldman, Sachs & Co. (“GS”) has prepared and provided these materials and GS’s related presentation (the “Confidential Information”) solely for the information and assistance of the Board of Directors (the "Board") and senior management of Roger (the "Company") in connection with their consideration of the matters referred to herein. Without GS’s prior written consent, the Confidential Information may not be circulated or referred to publicly, disclosed to or relied upon by any other person, or used or relied upon for any other purpose. Notwithstanding anything hereinto the contrary, the Company may disclose to any person the US federal income and state income tax treatment and tax structure of any transaction described herein and all materials of any kind (including tax opinions and other tax analyses) that are provided to the Company relating to such tax treatment and tax structure, without GS imposing any limitation of any kind. The Confidential Information, including this disclaimer, is subject to, and governed by, any written agreement between the Company, the Board and/or any committee thereof, on the one hand, and GS, on the other hand. GS and its affiliates are engaged in investment banking, commercial banking and financial advisory services, securities trading, investment management, principal investment, financial planning, benefits counseling, risk management, hedging, financing, brokerage activities and other financial and non-financial activities and services for various persons and entities. In the ordinary course of these activities and services, GS and its affiliates may at any time make or hold long or short positions and investments, as well as actively trade or effect transactions, in the equity, debt and other securities (or related derivative securities) and financial instruments (including bank loans and other obligations) of third parties, the Company, any other party to any transaction and any of their respective affiliates or any currency or commodity that may be involved in any transaction for their own account and for the accounts of their customers. The Confidential Information has been prepared and based on information obtained by GS from publicly available sources, the Company’s management and/or other sources. In preparing the Confidential Information, GS has relied upon and assumed, without assuming any responsibility for independent verification, the accuracy and completeness of all of the financial, legal, regulatory, tax, accounting and other information provided to, discussed with or reviewed by GS, and GS does not assume any liability for any such information discussed with or reviewed by GS. GS has assumed that all forecasts provided to, discussed with or reviewed by GS have been reasonably prepared and reflect the best currently available estimates and judgments of the Company. GS does not provide accounting, tax, legal or regulatory advice. GS’s role in any due diligence review is limited solely to performing such a review as it shall deem necessary to support its own advice and analysis and shall not be on behalf of the Company. Analyses based upon forecasts of future results are not necessarily indicative of actual future results, which may be significantly more or less favorable than suggested by these analyses, and GS does not assume responsibility if future results are materially different from those forecast. GS has not made an independent evaluation or appraisal of the assets and liabilities of the Company or any other person and has no obligation to evaluate the solvency of the Company or any person under any law. The analyses in the Confidential Information are not appraisals nor do they necessarily reflect the prices at which businesses or securities actually may be sold or purchased. The Confidential Information does not address the underlying business decision of the Company to engage in any transaction, or the relative merits of any strategic alternative referred to herein as compared to any other alternative that may be available to the Company. The Confidential Information is necessarily based on economic, monetary, market and other conditions as in effect on, and the information made available to GS as of, the date of such Confidential Information and GS assumes no responsibility for updating or revising the Confidential Information. |
| I. Presentation to Roger Board of Directors |
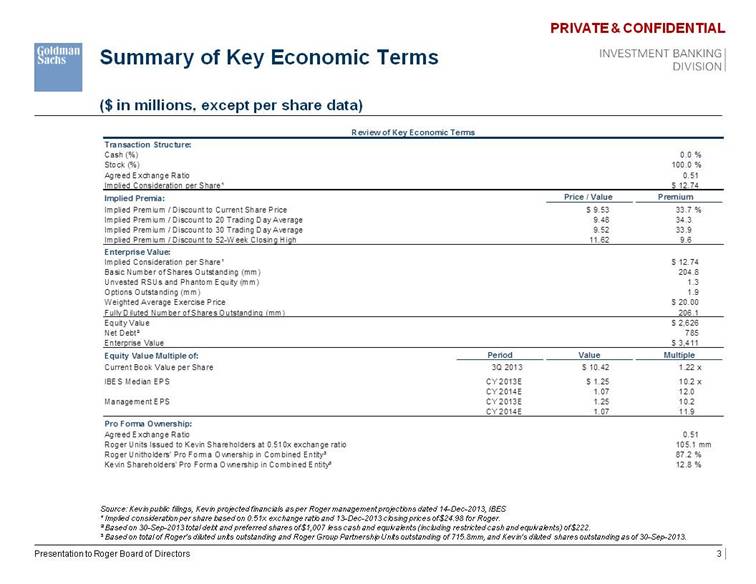
| Summary of Key Economic Terms ($ in millions, except per share data) Source: Kevin public filings, Kevin projected financials as per Roger management projections dated 14-Dec-2013, IBES ¹ Implied consideration per share based on 0.51x exchange ratio and 13-Dec-2013 closing prices of $24.98 for Roger. ² Based on 30-Sep-2013 total debt and preferred shares of $1,007 less cash and equivalents (including restricted cash and equivalents) of $222. ³ Based on total of Roger's diluted units outstanding and Roger Group Partnership Units outstanding of 715.8mm, and Kevin's diluted shares outstanding as of 30-Sep-2013. Presentation to Roger Board of Directors Review of Key Economic Terms Transaction Structure: Cash (%) 0.0 % Stock (%) 100.0 % Agreed Exchange Ratio 0.51 Implied Consideration per Share¹ $ 12.74 Implied Premia: Price / Value Premium Implied Premium / Discount to Current Share Price $ 9.53 33.7 % Implied Premium / Discount to 20 Trading Day Average 9.48 34.3 Implied Premium / Discount to 30 Trading Day Average 9.52 33.9 Implied Premium / Discount to 52-Week Closing High 11.62 9.6 Enterprise Value: Implied Consideration per Share¹ $ 12.74 Basic Number of Shares Outstanding (mm) 204.8 Unvested RSUs and Phantom Equity (mm) 1.3 Options Outstanding (mm) 1.9 Weighted Average Exercise Price $ 20.00 Fully Diluted Number of Shares Outstanding (mm) 206.1 Equity Value $ 2,626 Net Debt² 785 Enterprise Value $ 3,411 Equity Value Multiple of: Period Value Multiple Current Book Value per Share 3Q 2013 $ 10.42 1.22 x IBES Median EPS CY 2013E $ 1.25 10.2 x CY 2014E 1.07 12.0 Management EPS CY 2013E 1.25 10.2 CY 2014E 1.07 11.9 Pro Forma Ownership: Agreed Exchange Ratio 0.51 Roger Units Issued to Kevin Shareholders at 0.510x exchange ratio 105.1 mm Roger Unitholders' Pro Forma Ownership in Combined Entity³ 87.2 % Kevin Shareholders' Pro Forma Ownership in Combined Entity³ 12.8 % |
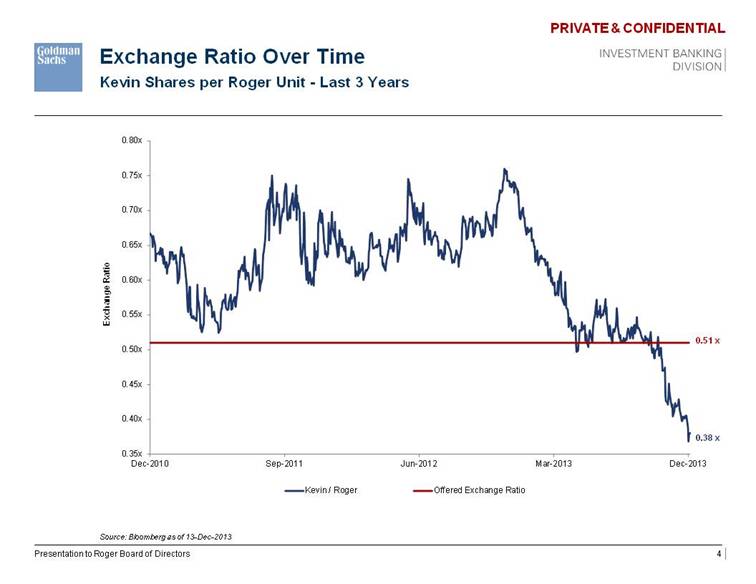
| Source: Bloomberg as of 13-Dec-2013 Exchange Ratio Over Time Presentation to Roger Board of Directors Kevin Shares per Roger Unit - Last 3 Years 0.35x 0.40x 0.45x 0.50x 0.55x 0.60x 0.65x 0.70x 0.75x 0.80x Dec-2010 Sep-2011 Jun-2012 Mar-2013 Dec-2013 Exchange Ratio Kevin / Roger Offered Exchange Ratio 0.38 x 0.51 x |
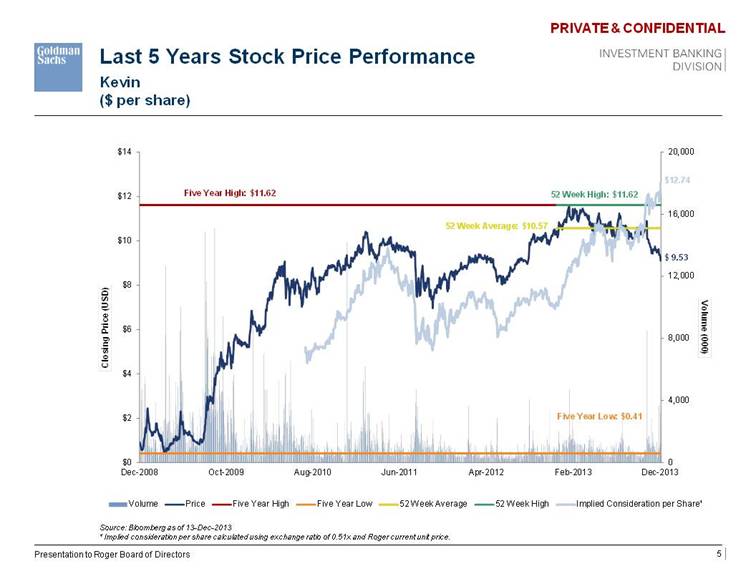
| Last 5 Years Stock Price Performance Kevin ($ per share) Source: Bloomberg as of 13-Dec-2013 ¹ Implied consideration per share calculated using exchange ratio of 0.51x and Roger current unit price. Presentation to Roger Board of Directors 0 4,000 8,000 12,000 16,000 20,000 $0 $2 $4 $6 $8 $10 $12 $14 Dec-2008 Oct-2009 Aug-2010 Jun-2011 Apr-2012 Feb-2013 Dec-2013 Volume (000) Closing Price (USD) Volume Price Five Year High Five Year Low 52 Week Average 52 Week High Implied Consideration per Share¹ $ 9.53 52 Week High: $11.62 Five Year High: $11.62 Five Year Low: $0.41 52 Week Average: $10.57 $12.74 |
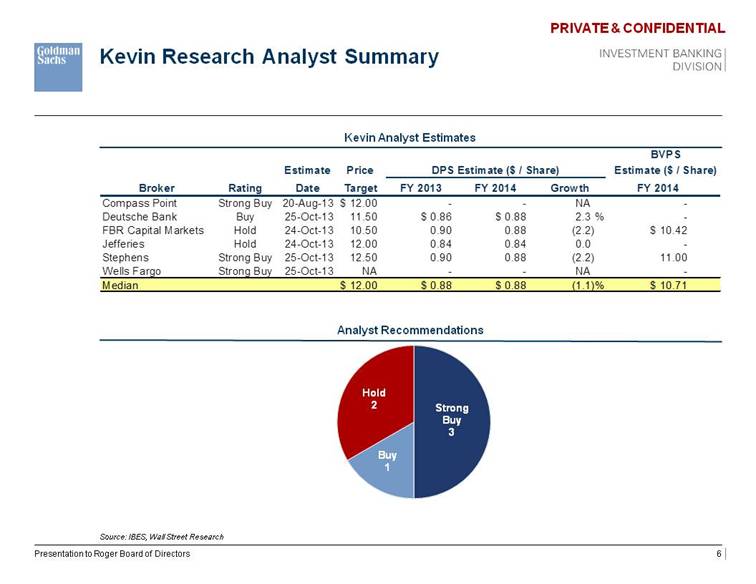
| Kevin Research Analyst Summary Kevin Analyst Estimates Analyst Recommendations Source: IBES, Wall Street Research Presentation to Roger Board of Directors ?Strong Buy 3 ?Buy 1 ?Hold 2 Estimate Price DPS Estimate ($ / Share) Estimate ($ / Share) Broker Rating Date Target FY 2013 FY 2014 Growth FY 2014 Compass Point Strong Buy 20-Aug-13 $ 12.00 - - NA - Deutsche Bank Buy 25-Oct-13 11.50 $ 0.86 $ 0.88 2.3 % - FBR Capital Markets Hold 24-Oct-13 10.50 0.90 0.88 (2.2) $ 10.42 Jefferies Hold 24-Oct-13 12.00 0.84 0.84 0.0 - Stephens Strong Buy 25-Oct-13 12.50 0.90 0.88 (2.2) 11.00 Wells Fargo Strong Buy 25-Oct-13 NA - - NA - Median $ 12.00 $ 0.88 $ 0.88 (1.1)% $ 10.71 |
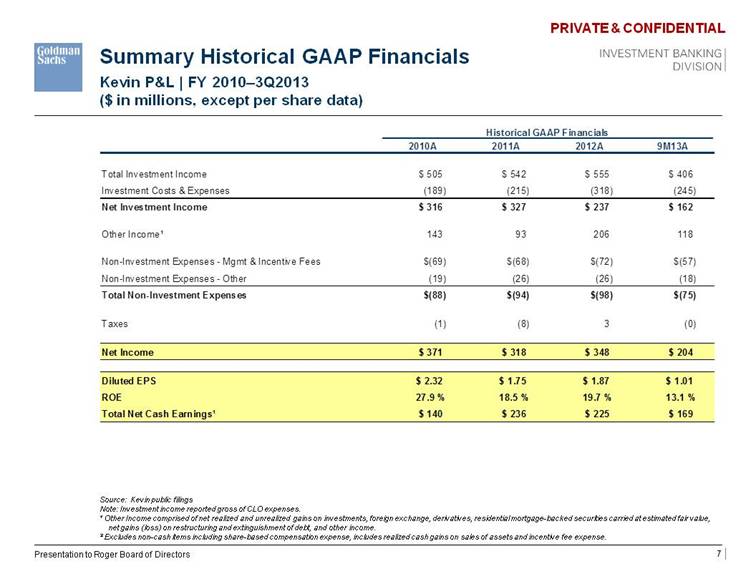
| Summary Historical GAAP Financials Kevin P&L | FY 2010–3Q2013 ($ in millions, except per share data) Source: Kevin public filings Note: Investment income reported gross of CLO expenses. 1 Other Income comprised of net realized and unrealized gains on investments, foreign exchange, derivatives, residential mortgage-backed securities carried at estimated fair value, net gains (loss) on restructuring and extinguishment of debt, and other income. 2 Excludes non-cash items including share-based compensation expense, includes realized cash gains on sales of assets and incentive fee expense. Presentation to Roger Board of Directors Historical GAAP Financials Projected Financials 2010A 2011A 2012A 9M13A Total Investment Income $ 505 $ 542 $ 555 $ 406 Investment Costs & Expenses (189) (215) (318) (245) Net Investment Income $ 316 $ 327 $ 237 $ 162 Other Income1 143 93 206 118 Non-Investment Expenses - Mgmt & Incentive Fees $(69) $(68) $(72) $(57) Non-Investment Expenses - Other (19) (26) (26) (18) Total Non-Investment Expenses $(88) $(94) $(98) $(75) Taxes (1) (8) 3 (0) Net Income $ 371 $ 318 $ 348 $ 204 Diluted EPS $ 2.32 $ 1.75 $ 1.87 $ 1.01 ROE 27.9 % 18.5 % 19.7 % 13.1 % Total Net Cash Earnings¹ $ 140 $ 236 $ 225 $ 169 |
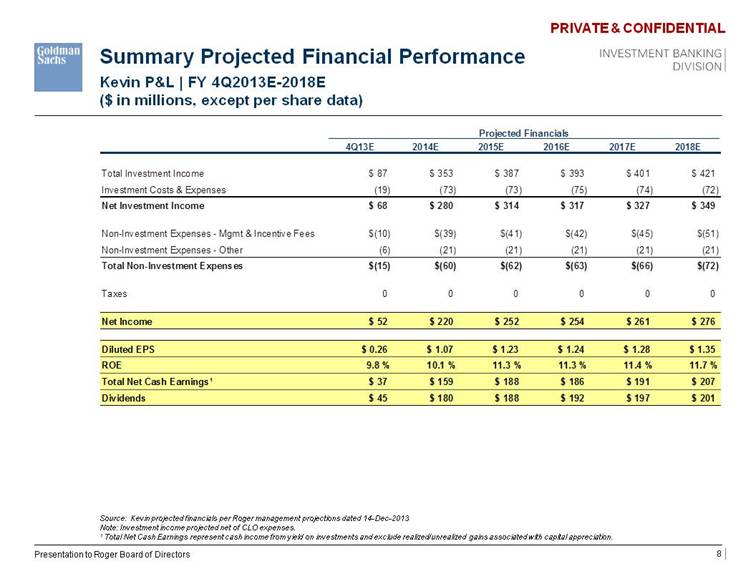
| Summary Projected Financial Performance Kevin P&L | FY 4Q2013E-2018E ($ in millions, except per share data) Source: Kevin projected financials per Roger management projections dated 14-Dec-2013 Note: Investment income projected net of CLO expenses. 1 Total Net Cash Earnings represent cash income from yield on investments and exclude realized/unrealized gains associated with capital appreciation. Presentation to Roger Board of Directors Projected Financials 4Q13E 2014E 2015E 2016E 2017E 2018E Total Investment Income $ 87 $ 353 $ 387 $ 393 $ 401 $ 421 Investment Costs & Expenses (19) (73) (73) (75) (74) (72) Net Investment Income $ 68 $ 280 $ 314 $ 317 $ 327 $ 349 Non-Investment Expenses - Mgmt & Incentive Fees $(10) $(39) $(41) $(42) $(45) $(51) Non-Investment Expenses - Other (6) (21) (21) (21) (21) (21) Total Non-Investment Expenses $(15) $(60) $(62) $(63) $(66) $(72) Taxes 0 0 0 0 0 0 Net Income $ 52 $ 220 $ 252 $ 254 $ 261 $ 276 Diluted EPS $ 0.26 $ 1.07 $ 1.23 $ 1.24 $ 1.28 $ 1.35 ROE 9.8 % 10.1 % 11.3 % 11.3 % 11.4 % 11.7 % Total Net Cash Earnings 1 $ 37 $ 159 $ 188 $ 186 $ 191 $ 207 Dividends $ 45 $ 180 $ 188 $ 192 $ 197 $ 201 |
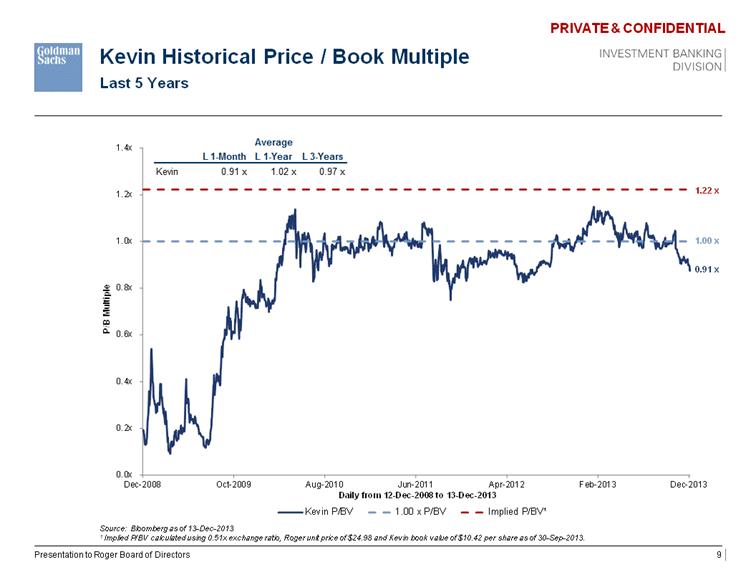
| Kevin Historical Price / Book Multiple Last 5 Years Source: Bloomberg as of 13-Dec-2013 1 Implied P/BV calculated using 0.51x exchange ratio, Roger unit price of $24.98 and Kevin book value of $10.42 per share as of 30-Sep-2013. Presentation to Roger Board of Directors 0.0x 0.2x 0.4x 0.6x 0.8x 1.0x 1.2x 1.4x Dec-2008 Oct-2009 Aug-2010 Jun-2011 Apr-2012 Feb-2013 Dec-2013 P/B Multiple Daily from 12 - Dec - 2008 to 13 - Dec - 2013 Kevin P/BV 1.00 x P/BV Implied P/BV1 0.91 x 1.00 x 1.22 x Average L 1-Month L 1-Year L 3-Years Kevin 0.91 x 1.02 x 0.97 x |
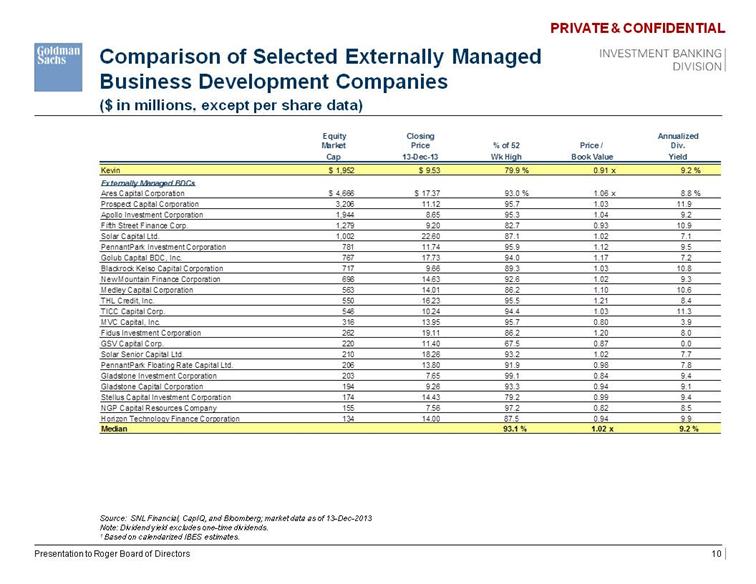
| Comparison of Selected Externally Managed Business Development Companies Source: SNL Financial, CapIQ, and Bloomberg; market data as of 13-Dec-2013 Note: Dividend yield excludes one-time dividends. 1 Based on calendarized IBES estimates. Presentation to Roger Board of Directors Equity Closing Annualized Market Price % of 52 Price / Div. Cap 13-Dec-13 Wk High Book Value Yield Kevin $ 1,952 $ 9.53 79.9 % 0.91 x 9.2 % Externally Managed BDCs Ares Capital Corporation $ 4,666 $ 17.37 93.0 % 1.06 x 8.8 % Prospect Capital Corporation 3,206 11.12 95.7 1.03 11.9 Apollo Investment Corporation 1,944 8.65 95.3 1.04 9.2 Fifth Street Finance Corp. 1,279 9.20 82.7 0.93 10.9 Solar Capital Ltd. 1,002 22.60 87.1 1.02 7.1 PennantPark Investment Corporation 781 11.74 95.9 1.12 9.5 Golub Capital BDC, Inc. 767 17.73 94.0 1.17 7.2 Blackrock Kelso Capital Corporation 717 9.66 89.3 1.03 10.8 New Mountain Finance Corporation 698 14.63 92.6 1.02 9.3 Medley Capital Corporation 563 14.01 86.2 1.10 10.6 THL Credit, Inc. 550 16.23 95.5 1.21 8.4 TICC Capital Corp. 546 10.24 94.4 1.03 11.3 MVC Capital, Inc. 316 13.95 95.7 0.80 3.9 Fidus Investment Corporation 262 19.11 86.2 1.20 8.0 GSV Capital Corp. 220 11.40 67.5 0.87 0.0 Solar Senior Capital Ltd. 210 18.26 93.2 1.02 7.7 PennantPark Floating Rate Capital Ltd. 206 13.80 91.9 0.98 7.8 Gladstone Investment Corporation 203 7.65 99.1 0.84 9.4 Gladstone Capital Corporation 194 9.26 93.3 0.94 9.1 Stellus Capital Investment Corporation 174 14.43 79.2 0.99 9.4 NGP Capital Resources Company 155 7.56 97.2 0.82 8.5 Horizon Technology Finance Corporation 134 14.00 87.5 0.94 9.9 Median 93.1 % 1.02 x 9.2 % ($ in millions, except per share data) |
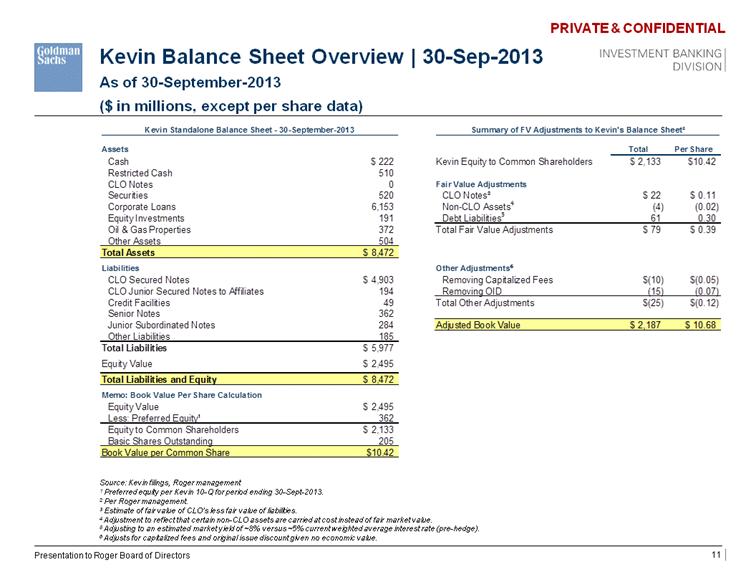
| Kevin Balance Sheet Overview | 30-Sep-2013 As of 30-September-2013 ($ in millions, except per share data) Source: Kevin filings, Roger management 1 Preferred equity per Kevin 10-Q for period ending 30-Sept-2013. 2 Per Roger management. 3 Estimate of fair value of CLO’s less fair value of liabilities. 4 Adjustment to reflect that certain non-CLO assets are carried at cost instead of fair market value. 5 Adjusting to an estimated market yield of ~8% versus ~5% current weighted average interest rate (pre-hedge). 6 Adjusts for capitalized fees and original issue discount given no economic value. Presentation to Roger Board of Directors Assets Total Per Share Cash $ 222 Kevin Equity to Common Shareholders $ 2,133 $10.42 Restricted Cash 510 CLO Notes 0 Fair Value Adjustments Securities 520 CLO Notes3 $ 22 $ 0.11 Corporate Loans 6,153 Non-CLO Assets 4 (4) (0.02) Equity Investments 191 Debt Liabilities 5 61 0.30 Oil & Gas Properties 372 Total Fair Value Adjustments $ 79 $ 0.39 Other Assets 504 Total Assets $ 8,472 Liabilities Other Adjustments 6 CLO Secured Notes $ 4,903 Removing Capitalized Fees $(10) $(0.05) CLO Junior Secured Notes to Affiliates 194 Removing OID (15) (0.07) Credit Facilities 49 Total Other Adjustments $(25) $(0.12) Senior Notes 362 Junior Subordinated Notes 284 Adjusted Book Value $ 2,187 $ 10.68 Other Liabilities 185 Total Liabilities $ 5,977 Equity Value $ 2,495 Total Liabilities and Equity $ 8,472 Memo: Book Value Per Share Calculation Equity Value $ 2,495 Less: Preferred Equity¹ 362 Equity to Common Shareholders $ 2,133 Basic Shares Outstanding 205 Book Value per Common Share $10.42 Summary of FV Adjustments to Kevin's Balance Sheet2 Kevin Standalone Balance Sheet - 30-September-2013 |
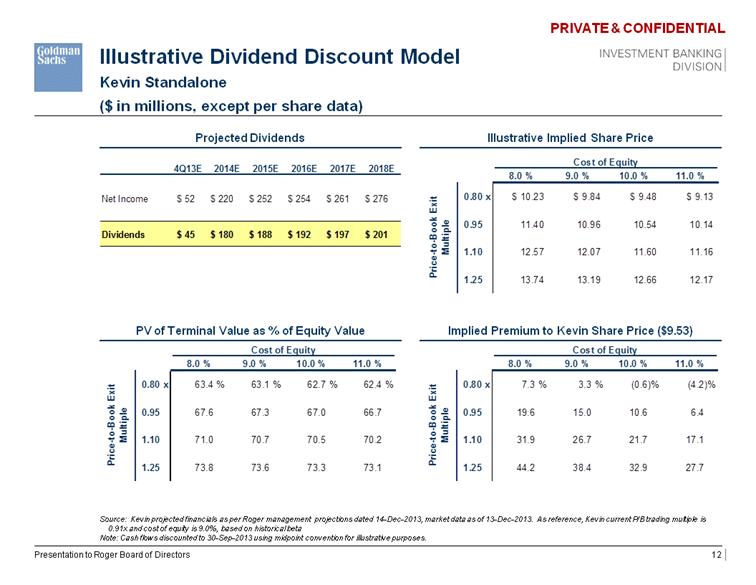
| Illustrative Dividend Discount Model Kevin Standalone ($ in millions, except per share data) Projected Dividends PV of Terminal Value as % of Equity Value Illustrative Implied Share Price Implied Premium to Kevin Share Price ($9.53) Source: Kevin projected financials as per Roger management projections dated 14-Dec-2013, market data as of 13-Dec-2013. As reference, Kevin current P/B trading multiple is 0.91x and cost of equity is 9.0%, based on historical beta Note: Cash flows discounted to 30-Sep-2013 using midpoint convention for illustrative purposes. Presentation to Roger Board of Directors 4Q13E 2014E 2015E 2016E 2017E 2018E Net Income $ 52 $ 220 $ 252 $ 254 $ 261 $ 276 Dividends $ 45 $ 180 $ 188 $ 192 $ 197 $ 201 Cost of Equity Cost of Equity 8.0 % 9.0 % 10.0 % 11.0 % 0.80 x 63.4 % 63.1 % 62.7 % 62.4 % 0.95 67.6 67.3 67.0 66.7 1.10 71.0 70.7 70.5 70.2 1.25 73.8 73.6 73.3 73.1 Price-to-Book Exit Multiple Cost of Equity Cost of Equity 8.0 % 9.0 % 10.0 % 11.0 % 0.80 x $ 10.23 $ 9.84 $ 9.48 $ 9.13 0.95 11.40 10.96 10.54 10.14 1.10 12.57 12.07 11.60 11.16 1.25 13.74 13.19 12.66 12.17 Price-to-Book Exit Multiple Price-to-Book Exit Multiple Cost of Equity 8.0 % 9.0 % 10.0 % 11.0 % 0.80 x 7.3 % 3.3 % (0.6)% (4.2)% 0.95 19.6 15.0 10.6 6.4 1.10 31.9 26.7 21.7 17.1 1.25 44.2 38.4 32.9 27.7 |
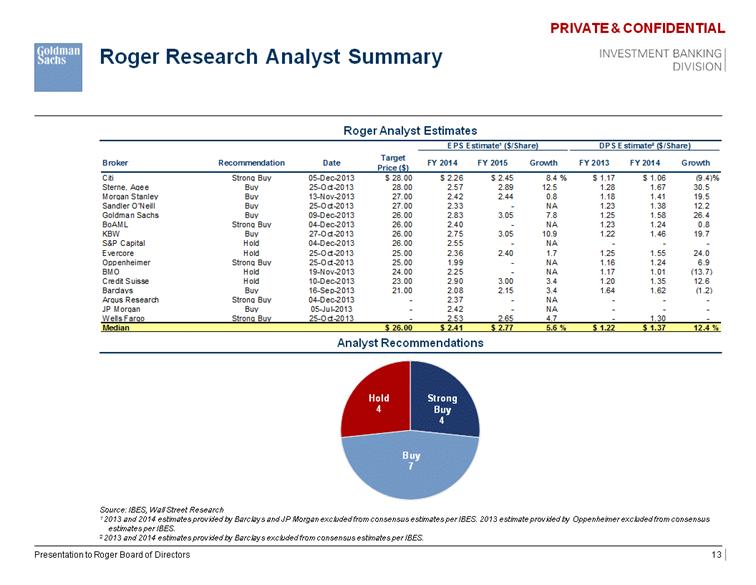
| Roger Research Analyst Summary Roger Analyst Estimates Analyst Recommendations Source: IBES, Wall Street Research 1 2013 and 2014 estimates provided by Barclays and JP Morgan excluded from consensus estimates per IBES. 2013 estimate provided by Oppenheimer excluded from consensus estimates per IBES. 2 2013 and 2014 estimates provided by Barclays excluded from consensus estimates per IBES. Presentation to Roger Board of Directors EPS Estimate ¹ ($/Share) DPS Estimate ² ($/Share) Broker Recommendation Date Target Price ($) FY 2014 FY 2015 Growth FY 2013 FY 2014 Growth Citi Strong Buy 05-Dec-2013 $ 28.00 $ 2.26 $ 2.45 8.4 % $ 1.17 $ 1.06 (9.4)% Sterne, Agee Buy 25-Oct-2013 28.00 2.57 2.89 12.5 1.28 1.67 30.5 Morgan Stanley Buy 13-Nov-2013 27.00 2.42 2.44 0.8 1.18 1.41 19.5 Sandler O'Neill Buy 25-Oct-2013 27.00 2.33 - NA 1.23 1.38 12.2 Goldman Sachs Buy 09-Dec-2013 26.00 2.83 3.05 7.8 1.25 1.58 26.4 BoAML Strong Buy 04-Dec-2013 26.00 2.40 - NA 1.23 1.24 0.8 KBW Buy 27-Oct-2013 26.00 2.75 3.05 10.9 1.22 1.46 19.7 S&P Capital Hold 04-Dec-2013 26.00 2.55 - NA - - - Evercore Hold 25-Oct-2013 25.00 2.36 2.40 1.7 1.25 1.55 24.0 Oppenheimer Strong Buy 25-Oct-2013 25.00 1.99 - NA 1.16 1.24 6.9 BMO Hold 19-Nov-2013 24.00 2.25 - NA 1.17 1.01 (13.7) Credit Suisse Hold 10-Dec-2013 23.00 2.90 3.00 3.4 1.20 1.35 12.6 Barclays Buy 16-Sep-2013 21.00 2.08 2.15 3.4 1.64 1.62 (1.2) Argus Research Strong Buy 04-Dec-2013 - 2.37 - NA - - - JP Morgan Buy 05-Jul-2013 - 2.42 - NA - - - Wells Fargo Strong Buy 25-Oct-2013 - 2.53 2.65 4.7 - 1.30 - Median $ 26.00 $ 2.41 $ 2.77 5.6 % $ 1.22 $ 1.37 12.4 % Strong Buy 4 Buy 7 Hold 4 |
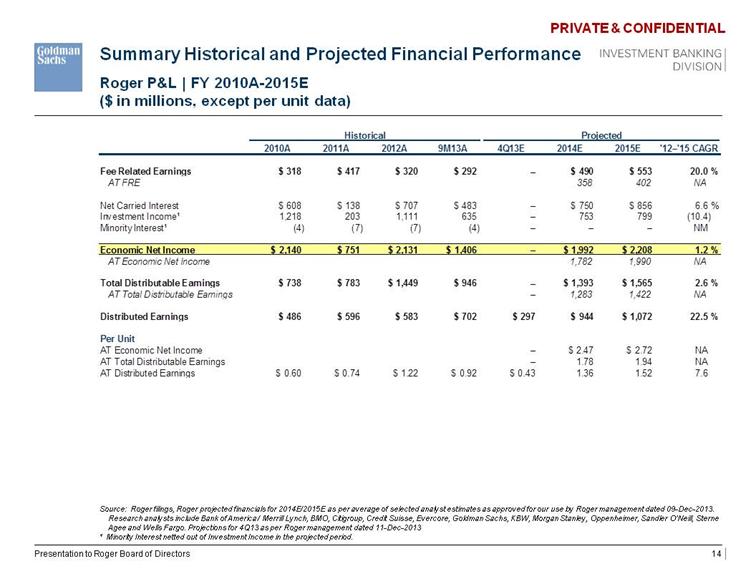
| Summary Historical and Projected Financial Performance Roger P&L | FY 2010A-2015E ($ in millions, except per unit data) Source: Roger filings, Roger projected financials for 2014E/2015E as per average of selected analyst estimates as approved for our use by Roger management dated 09-Dec-2013. Research analysts include Bank of America / Merrill Lynch, BMO, Citigroup, Credit Suisse, Evercore, Goldman Sachs, KBW, Morgan Stanley, Oppenheimer, Sandler O’Neill, Sterne Agee and Wells Fargo. Projections for 4Q13 as per Roger management dated 11-Dec-2013 ¹ Minority Interest netted out of Investment Income in the projected period. Presentation to Roger Board of Directors Historical Projected 2010A 2011A 2012A 9M13A 4Q13E 2014E 2015E ' 12 – ' 15 CAGR Fee Related Earnings $ 318 $ 417 $ 320 $ 292 – $ 490 $ 553 20.0 % AT FRE 358 402 NA Net Carried Interest $ 608 $ 138 $ 707 $ 483 – $ 750 $ 856 6.6 % Investment Income ¹ 1,218 203 1,111 635 – 753 799 (10.4) Minority Interest ¹ (4) (7) (7) (4) – – – NM Economic Net Income $ 2,140 $ 751 $ 2,131 $ 1,406 – $ 1,992 $ 2,208 1.2 % AT Economic Net Income 1,782 1,990 NA Total Distributable Earnings $ 738 $ 783 $ 1,449 $ 946 – $ 1,393 $ 1,565 2.6 % AT Total Distributable Earnings – 1,283 1,422 NA Distributed Earnings $ 486 $ 596 $ 583 $ 702 $ 297 $ 944 $ 1,072 22.5 % Per Unit AT Economic Net Income – $ 2.47 $ 2.72 NA AT Total Distributable Earnings – 1.78 1.94 NA AT Distributed Earnings $ 0.60 $ 0.74 $ 1.22 $ 0.92 $ 0.43 1.36 1.52 7.6 |
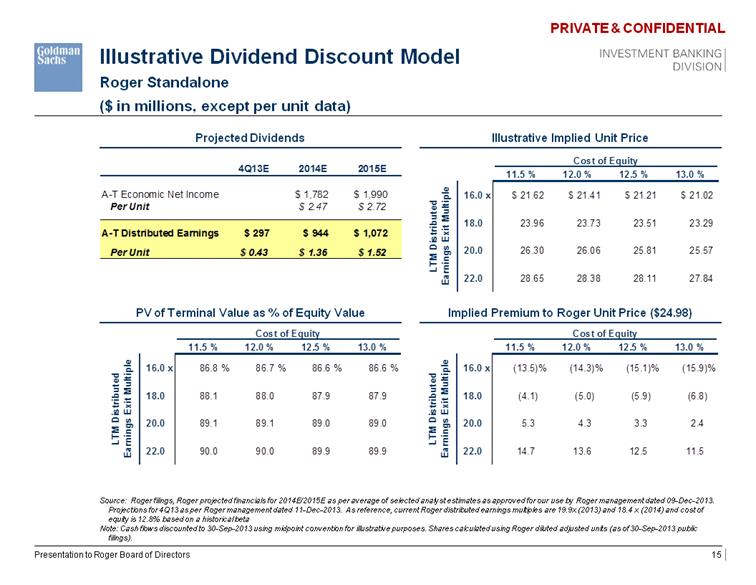
| Illustrative Dividend Discount Model Roger Standalone ($ in millions, except per unit data) Projected Dividends PV of Terminal Value as % of Equity Value Illustrative Implied Unit Price Implied Premium to Roger Unit Price ($24.98) Source: Roger filings, Roger projected financials for 2014E/2015E as per average of selected analyst estimates as approved for our use by Roger management dated 09-Dec-2013. Projections for 4Q13 as per Roger management dated 11-Dec-2013. As reference, current Roger distributed earnings multiples are 19.9x (2013) and 18.4 x (2014) and cost of equity is 12.8% based on a historical beta Note: Cash flows discounted to 30-Sep-2013 using midpoint convention for illustrative purposes. Shares calculated using Roger diluted adjusted units (as of 30-Sep-2013 public filings). Presentation to Roger Board of Directors Cost of Equity Cost of Equity 11.5 % 12.0 % 12.5 % 13.0 % 16.0 x 86.8 % 86.7 % 86.6 % 86.6 % 18.0 88.1 88.0 87.9 87.9 20.0 89.1 89.1 89.0 89.0 22.0 90.0 90.0 89.9 89.9 LTM Distributed Earnings Exit Multiple Cost of Equity 11.5 % 12.0 % 12.5 % 13.0 % 16.0 x $ 21.62 $ 21.41 $ 21.21 $ 21.02 18.0 23.96 23.73 23.51 23.29 20.0 26.30 26.06 25.81 25.57 22.0 28.65 28.38 28.11 27.84 LTM Distributed Earnings Exit Multiple Cost of Equity 11.5 % 12.0 % 12.5 % 13.0 % 16.0 x (13.5)% (14.3)% (15.1)% (15.9)% 18.0 (4.1) (5.0) (5.9) (6.8) 20.0 5.3 4.3 3.3 2.4 22.0 14.7 13.6 12.5 11.5 LTM Distributed Earnings Exit Multiple Projected Dividends 4Q13E 2014E 2015E A-T Economic Net Income $ 1,782 $ 1,990 Per Unit $ 2.47 $ 2.72 A-T Distributed Earnings $ 297 $ 944 $ 1,072 Per Unit $ 0.43 $ 1.36 $ 1.52 |
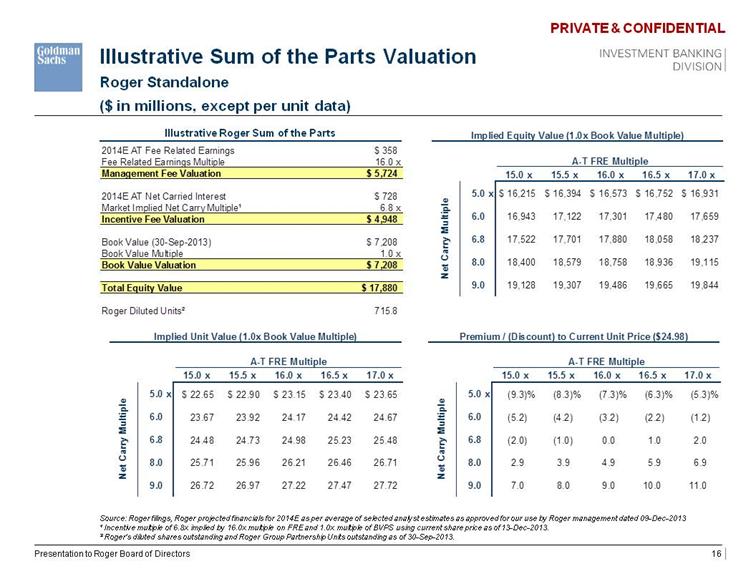
| Illustrative Sum of the Parts Valuation Roger Standalone ($ in millions, except per unit data) Illustrative Roger Sum of the Parts Source: Roger filings, Roger projected financials for 2014E as per average of selected analyst estimates as approved for our use by Roger management dated 09-Dec-2013 ¹ Incentive multiple of 6.8x implied by 16.0x multiple on FRE and 1.0x multiple of BVPS using current share price as of 13-Dec-2013. ² Roger's diluted shares outstanding and Roger Group Partnership Units outstanding as of 30-Sep-2013. Presentation to Roger Board of Directors Implied Equity Value (1.0x Book Value Multiple) A-T FRE Multiple 15.0 x 15.5 x 16.0 x 16.5 x 17.0 x 5.0 x $ 16,215 $ 16,394 $ 16,573 $ 16,752 $ 16,931 6.0 16,943 17,122 17,301 17,480 17,659 6.8 17,522 17,701 17,880 18,058 18,237 8.0 18,400 18,579 18,758 18,936 19,115 9.0 19,128 19,307 19,486 19,665 19,844 Net Carry Multiple 2014E AT Fee Related Earnings $ 358 Fee Related Earnings Multiple 16.0 x Management Fee Valuation $ 5,724 2014E AT Net Carried Interest $ 728 Market Implied Net Carry Multiple ¹ 6.8 x Incentive Fee Valuation $ 4,948 Book Value (30-Sep-2013) $ 7,208 Book Value Multiple 1.0 x Book Value Valuation $ 7,208 Total Equity Value $ 17,880 Roger Diluted Units ² 715.8 Implied Unit Value (1.0x Book Value Multiple) Premium / (Discount) to Current Share Price ($24.98) A-T FRE Multiple A-T FRE Multiple 15.0 x 15.5 x 16.0 x 16.5 x 17.0 x 5.0 x $ 22.65 $ 22.90 $ 23.15 $ 23.40 $ 23.65 6.0 23.67 23.92 24.17 24.42 24.67 6.8 24.48 24.73 24.98 25.23 25.48 8.0 25.71 25.96 26.21 26.46 26.71 9.0 26.72 26.97 27.22 27.47 27.72 Net Carry Multiple A-T FRE Multiple 15.0 x 15.5 x 16.0 x 16.5 x 17.0 x 5.0 x (9.3)% (8.3)% (7.3)% (6.3)% (5.3)% 6.0 (5.2) (4.2) (3.2) (2.2) (1.2) 6.8 (2.0) (1.0) 0.0 1.0 2.0 8.0 2.9 3.9 4.9 5.9 6.9 9.0 7.0 8.0 9.0 10.0 11.0 |
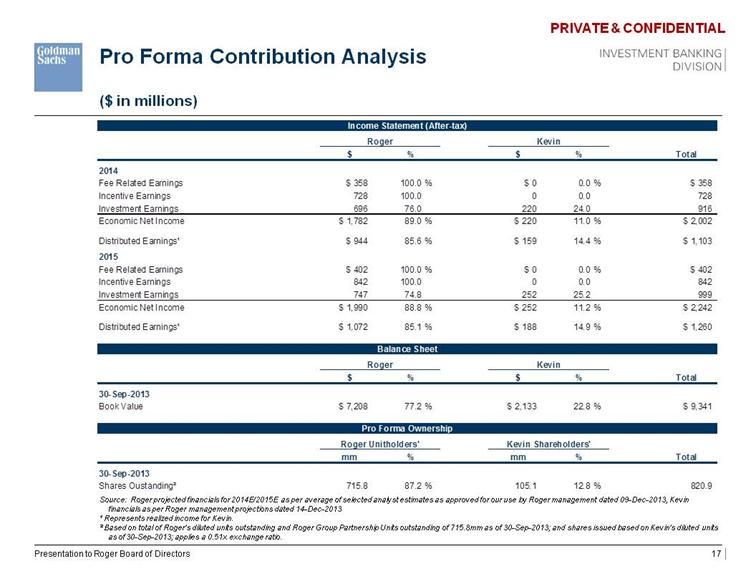
| Pro Forma Contribution Analysis ($ in millions) Source: Roger projected financials for 2014E/2015E as per average of selected analyst estimates as approved for our use by Roger management dated 09-Dec-2013, Kevin financials as per Roger management projections dated 14-Dec-2013 ¹ Represents realized income for Kevin. ² Based on total of Roger's diluted units outstanding and Roger Group Partnership Units outstanding of 715.8mm as of 30-Sep-2013; and shares issued based on Kevin's diluted units as of 30-Sep-2013; applies a 0.51x exchange ratio. Presentation to Roger Board of Directors Income Statement (After-tax) Roger Kevin $ % $ % Total 2014 Fee Related Earnings $ 358 100.0 % $ 0 0.0 % $ 358 Incentive Earnings 728 100.0 0 0.0 728 Investment Earnings 696 76.0 220 24.0 916 Economic Net Income $ 1,782 89.0 % $ 220 11.0 % $ 2,002 Distributed Earnings ¹ $ 944 85.6 % $ 159 14.4 % $ 1,103 2015 Fee Related Earnings $ 402 100.0 % $ 0 0.0 % $ 402 Incentive Earnings 842 100.0 0 0.0 842 Investment Earnings 747 74.8 252 25.2 999 Economic Net Income $ 1,990 88.8 % $ 252 11.2 % $ 2,242 Distributed Earnings ¹ $ 1,072 85.1 % $ 188 14.9 % $ 1,260 Balance Sheet Roger Kevin $ % $ % Total 30-Sep-2013 Book Value $ 7,208 77.2 % $ 2,133 22.8 % $ 9,341 Pro Forma Ownership Roger Unitholders' Kevin Shareholders' mm % mm % Total 30-Sep-2013 Shares Oustanding ² 715.8 87.2 % 105.1 12.8 % 820.9 |
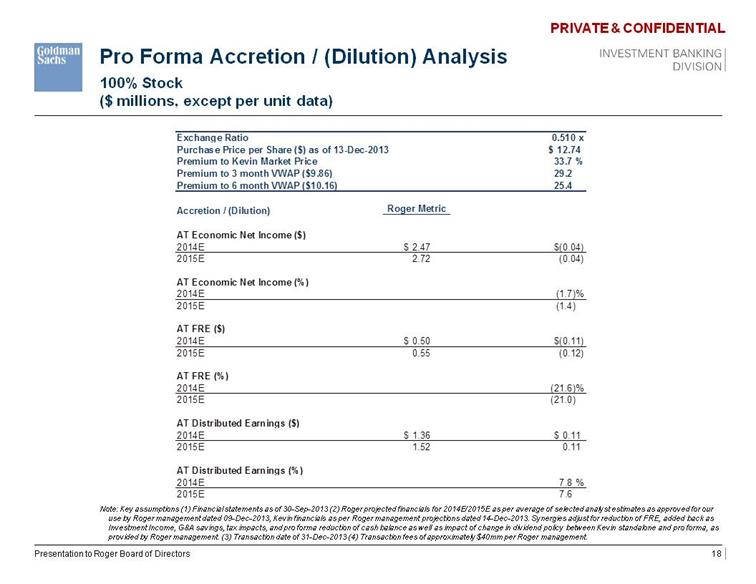
| Pro Forma Accretion / (Dilution) Analysis 100% Stock ($ millions, except per unit data) Note: Key assumptions (1) Financial statements as of 30-Sep-2013 (2) Roger projected financials for 2014E/2015E as per average of selected analyst estimates as approved for our use by Roger management dated 09-Dec-2013, Kevin financials as per Roger management projections dated 14-Dec-2013. Synergies adjust for reduction of FRE, added back as Investment Income, G&A savings, tax impacts, and pro forma reduction of cash balance as well as impact of change in dividend policy between Kevin standalone and pro forma, as provided by Roger management. (3) Transaction date of 31-Dec-2013 (4) Transaction fees of approximately $40mm per Roger management. Presentation to Roger Board of Directors Exchange Ratio 0.510 x Purchase Price per Share ($) as of 13-Dec-2013 $ 12.74 Premium to Kevin Market Price 33.7 % Premium to 3 month VWAP ($9.86) 29.2 Premium to 6 month VWAP ($10.16) 25.4 Accretion / (Dilution) Roger Metric AT Economic Net Income ($) 2014E $ 2.47 $(0.04) 2015E 2.72 (0.04) AT Economic Net Income (%) 2014E (1.7)% 2015E (1.4) AT FRE ($) 2014E $ 0.50 $(0.11) 2015E 0.55 (0.12) AT FRE (%) 2014E (21.6)% 2015E (21.0) AT Distributed Earnings ($) 2014E $ 1.36 $ 0.11 2015E 1.52 0.11 AT Distributed Earnings (%) 2014E 7.8 % 2015E 7.6 |
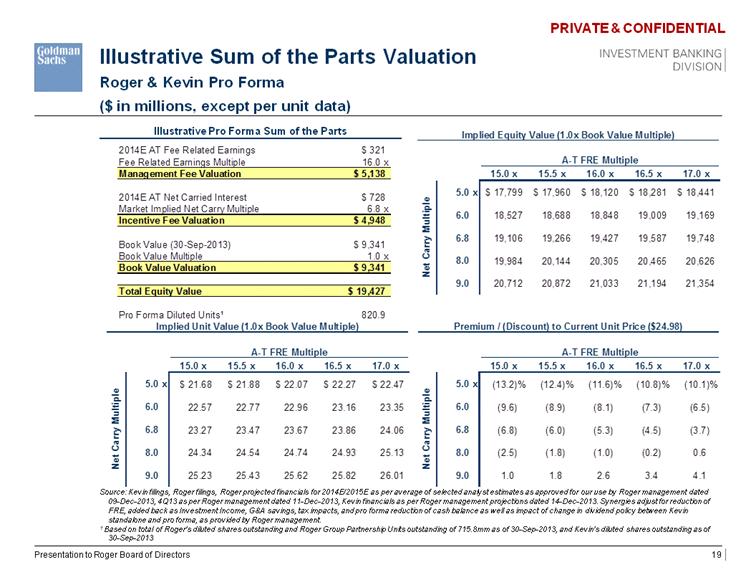
| Illustrative Sum of the Parts Valuation Roger & Kevin Pro Forma ($ in millions, except per unit data) Illustrative Pro Forma Sum of the Parts Source: Kevin filings, Roger filings, Roger projected financials for 2014E/2015E as per average of selected analyst estimates as approved for our use by Roger management dated 09-Dec-2013, 4Q13 as per Roger management dated 11-Dec-2013, Kevin financials as per Roger management projections dated 14-Dec-2013. Synergies adjust for reduction of FRE, added back as Investment Income, G&A savings, tax impacts, and pro forma reduction of cash balance as well as impact of change in dividend policy between Kevin standalone and pro forma, as provided by Roger management. 1 Based on total of Roger's diluted shares outstanding and Roger Group Partnership Units outstanding of 715.8mm as of 30-Sep-2013, and Kevin’s diluted shares outstanding as of 30-Sep-2013 Presentation to Roger Board of Directors Implied Equity Value (1.0x Book Value Multiple) A-T FRE Multiple 15.0 x 15.5 x 16.0 x 16.5 x 17.0 x 5.0 x $ 17,799 $ 17,960 $ 18,120 $ 18,281 $ 18,441 6.0 18,527 18,688 18,848 19,009 19,169 6.8 19,106 19,266 19,427 19,587 19,748 8.0 19,984 20,144 20,305 20,465 20,626 9.0 20,712 20,872 21,033 21,194 21,354 Net Carry Multiple Premium / (Discount) to Current Unit Price ($24.98) A-T FRE Multiple 15.0 x 15.5 x 16.0 x 16.5 x 17.0 x 5.0 x (13.2)% (12.4)% (11.6)% (10.8)% (10.1)% 6.0 (9.6) (8.9) (8.1) (7.3) (6.5) 6.8 (6.8) (6.0) (5.3) (4.5) (3.7) 8.0 (2.5) (1.8) (1.0) (0.2) 0.6 9.0 1.0 1.8 2.6 3.4 4.1 Net Carry Multiple Implied Unit Value (1.0x Book Value Multiple) Premium / (Discount) to Current Share Price ($24.98) A-T FRE Multiple A-T FRE Multiple 15.0 x 15.5 x 16.0 x 16.5 x 17.0 x 5.0 x $ 21.68 $ 21.88 $ 22.07 $ 22.27 $ 22.47 6.0 22.57 22.77 22.96 23.16 23.35 6.8 23.27 23.47 23.67 23.86 24.06 8.0 24.34 24.54 24.74 24.93 25.13 9.0 25.23 25.43 25.62 25.82 26.01 Net Carry Multiple Pro Forma Diluted Units1 |
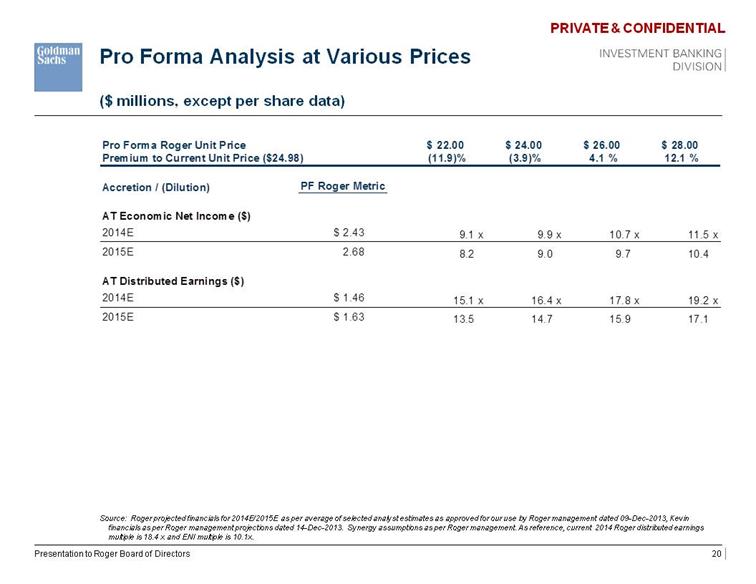
| Pro Forma Analysis at Various Prices ($ millions, except per share data) Source: Roger projected financials for 2014E/2015E as per average of selected analyst estimates as approved for our use by Roger management dated 09-Dec-2013, Kevin financials as per Roger management projections dated 14-Dec-2013. Synergy assumptions as per Roger management. As reference, current 2014 Roger distributed earnings multiple is 18.4 x and ENI multiple is 10.1x. Presentation to Roger Board of Directors Pro Forma Roger Unit Price $ 22.00 $ 24.00 $ 26.00 $ 28.00 Premium to Current Unit Price ($24.98) (11.9)% (3.9)% 4.1 % 12.1 % Accretion / (Dilution) PF Roger Metric AT Economic Net Income ($) 2014E $ 2.43 9.1 x 9.9 x 10.7 x 11.5 x 2015E 2.68 8.2 9.0 9.7 10.4 AT Distributed Earnings ($) 2014E $ 1.46 15.1 x 16.4 x 17.8 x 19.2 x 2015E $ 1.63 13.5 14.7 15.9 17.1 |
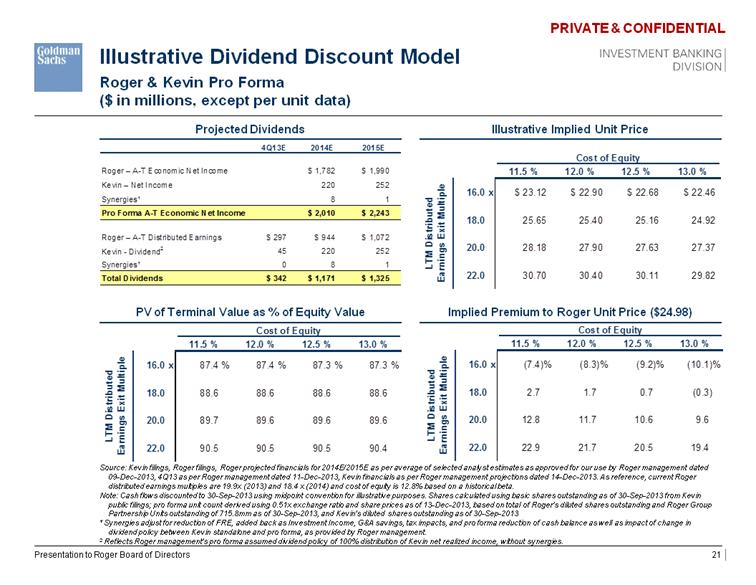
| Illustrative Dividend Discount Model Roger & Kevin Pro Forma ($ in millions, except per unit data) Projected Dividends PV of Terminal Value as % of Equity Value Illustrative Implied Unit Price Implied Premium to Roger Unit Price ($24.98) Source: Kevin filings, Roger filings, Roger projected financials for 2014E/2015E as per average of selected analyst estimates as approved for our use by Roger management dated 09-Dec-2013, 4Q13 as per Roger management dated 11-Dec-2013, Kevin financials as per Roger management projections dated 14-Dec-2013. As reference, current Roger distributed earnings multiples are 19.9x (2013) and 18.4 x (2014) and cost of equity is 12.8% based on a historical beta. Note: Cash flows discounted to 30-Sep-2013 using midpoint convention for illustrative purposes. Shares calculated using basic shares outstanding as of 30-Sep-2013 from Kevin public filings; pro forma unit count derived using 0.51x exchange ratio and share prices as of 13-Dec-2013, based on total of Roger's diluted shares outstanding and Roger Group Partnership Units outstanding of 715.8mm as of 30-Sep-2013, and Kevin’s diluted shares outstanding as of 30-Sep-2013 ¹ Synergies adjust for reduction of FRE, added back as Investment Income, G&A savings, tax impacts, and pro forma reduction of cash balance as well as impact of change in dividend policy between Kevin standalone and pro forma, as provided by Roger management. 2 Reflects Roger management’s pro forma assumed dividend policy of 100% distribution of Kevin net realized income, without synergies. Presentation to Roger Board of Directors Cost of Equity 11.5 % 12.0 % 12.5 % 13.0 % 16.0 x $ 23.12 $ 22.90 $ 22.68 $ 22.46 18.0 25.65 25.40 25.16 24.92 20.0 28.18 27.90 27.63 27.37 22.0 30.70 30.40 30.11 29.82 LTM Distributed Earnings Exit Multiple Cost of Equity Cost of Equity 11.5 % 12.0 % 12.5 % 13.0 % 16.0 x (7.4)% (8.3)% (9.2)% (10.1)% 18.0 2.7 1.7 0.7 (0.3) 20.0 12.8 11.7 10.6 9.6 22.0 22.9 21.7 20.5 19.4 LTM Distributed Earnings Exit Multiple Cost of Equity Cost of Equity 11.5 % 12.0 % 12.5 % 13.0 % 16.0 x 87.4 % 87.4 % 87.3 % 87.3 % 18.0 88.6 88.6 88.6 88.6 20.0 89.7 89.6 89.6 89.6 22.0 90.5 90.5 90.5 90.4 LTM Distributed Earnings Exit Multiple Projected Dividends 4Q13E 2014E 2015E Roger – A-T Economic Net Income $ 1,782 $ 1,990 Kevin – Net Income 220 252 Synergies¹ 8 1 Pro Forma A-T Economic Net Income $ 2,010 $ 2,243 Roger – A-T Distributed Earnings $ 297 $ 944 $ 1,072 Kevin - Dividend2 45 220 252 Synergies¹ 0 8 1 Total Dividends $ 342 $ 1,171 $ 1,325 |
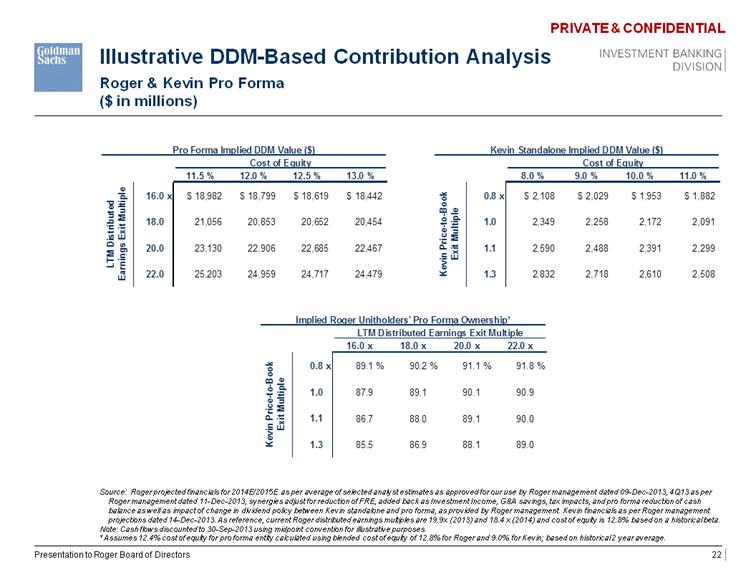
| Illustrative DDM-Based Contribution Analysis Roger & Kevin Pro Forma ($ in millions) Source: Roger projected financials for 2014E/2015E as per average of selected analyst estimates as approved for our use by Roger management dated 09-Dec-2013, 4Q13 as per Roger management dated 11-Dec-2013, synergies adjust for reduction of FRE, added back as Investment Income, G&A savings, tax impacts, and pro forma reduction of cash balance as well as impact of change in dividend policy between Kevin standalone and pro forma, as provided by Roger management. Kevin financials as per Roger management projections dated 14-Dec-2013. As reference, current Roger distributed earnings multiples are 19.9x (2013) and 18.4 x (2014) and cost of equity is 12.8% based on a historical beta. Note: Cash flows discounted to 30-Sep-2013 using midpoint convention for illustrative purposes. ¹ Assumes 12.4% cost of equity for pro forma entity calculated using blended cost of equity of 12.8% for Roger and 9.0% for Kevin; based on historical 2 year average. Presentation to Roger Board of Directors Pro Forma Implied DDM Value ($) Kevin Standalone Implied DDM Value ($) Cost of Equity Cost of Equity 11.5 % 12.0 % 12.5 % 13.0 % 8.0 % 9.0 % 10.0 % 11.0 % 16.0 x $ 18,982 $ 18,799 $ 18,619 $ 18,442 0.8 x $ 2,108 $ 2,029 $ 1,953 $ 1,882 18.0 21,056 20,853 20,652 20,454 1.0 2,349 2,258 2,172 2,091 20.0 23,130 22,906 22,685 22,467 1.1 2,590 2,488 2,391 2,299 22.0 25,203 24,959 24,717 24,479 1.3 2,832 2,718 2,610 2,508 LTM Distributed Earnings Exit Multiple Kevin Price-to-Book Exit Multiple Kevin Price-to-Book Exit Multiple LTM Distributed Earnings Exit Multiple 16.0 x 18.0 x 20.0 x 22.0 x 0.8 x 89.1 % 90.2 % 91.1 % 91.8 % 1.0 87.9 89.1 90.1 90.9 1.1 86.7 88.0 89.1 90.0 1.3 85.5 86.9 88.1 89.0 |
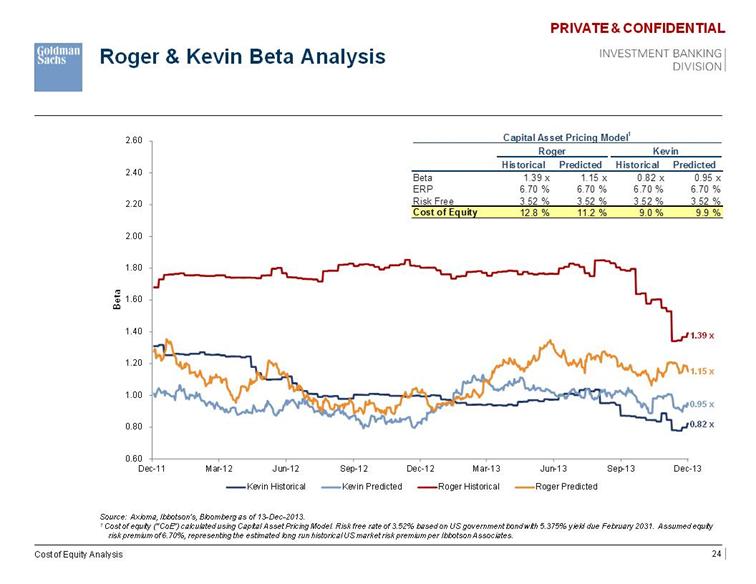
| Appendix A: Cost of Equity Analysis |
| Roger & Kevin Beta Analysis Cost of Equity Analysis Source: Axioma, Ibbotson’s, Bloomberg as of 13-Dec-2013. 1 Cost of equity (“CoE”) calculated using Capital Asset Pricing Model. Risk free rate of 3.52% based on US government bond with 5.375% yield due February 2031. Assumed equity risk premium of 6.70%, representing the estimated long run historical US market risk premium per Ibbotson Associates. Capital Asset Pricing Model 1 Roger Kevin Historical Predicted Historical Predicted Beta 1.39 x 1.15 x 0.82 x 0.95 x ERP 6.70 % 6.70 % 6.70 % 6.70 % Risk Free 3.52 % 3.52 % 3.52 % 3.52 % Cost of Equity 12.8 % 11.2 % 9.0 % 9.9 % |