Exhibit (c)(7)
| November 24, 2013 Project WILDCATS Views on Valuation Strictly Private & Confidential SANDLER O’NEILL + PARTNERS, L.P. |
| GENERAL INFORMATION AND LIMITATIONS This presentation, and the oral or video presentation that supplements it, have been developed by and are proprietary to Sandler O'Neill & Partners, L.P. and were prepared exclusively for the benefit and internal use of the recipient. Neither the printed presentation nor the oral or video presentation that supplements it, nor any of their contents, may be reproduced, distributed or used for any other purpose without the prior written consent of Sandler O'Neill & Partners, L.P. The analyses contained herein rely upon information obtained from the recipient or from public sources, the accuracy of which has not been verified, and cannot be assured, by Sandler O'Neill & Partners, L.P. Moreover, many of the projections and financial analyses herein are based on estimated financial performance prepared by or in consultation with the recipient and are intended only to suggest reasonable ranges of results. Finally, the printed presentation is incomplete without the oral or video presentation that supplements it. Sandler O’Neill & Partners, L.P. prohibits employees from offering, directly or indirectly, favorable research, a specific rating or a specific price target, or offering or threatening to change research, a rating or a price target to a company as consideration or inducement for the receipt of business or compensation. The Firm also prohibits research analysts from being compensated for their involvement in, or based upon, specific investment banking transactions. Sandler O'Neill & Partners, L.P. is a limited partnership, the sole general partner of which is Sandler O'Neill & Partners Corp., a New York corporation. Sandler O'Neill & Partners, L.P. is a registered broker-dealer and a member of the Financial Industry Regulatory Authority. Sandler O'Neill Mortgage Finance L.P. is an indirect subsidiary of Sandler O'Neill & Partners Corp. This material is protected under applicable copyright laws and does not carry any rights of publication or disclosure. SANDLER O’NEILL + PARTNERS |
| Overview LION’s current proposal to acquire TIGER does not fully reflect the intrinsic value of TIGER nor the premium that should be accorded to TIGER shareholders The proposed premium to TIGER’s current stock price is minimal or negative when compared to where LION and TIGER stock have traded over the last year It is only within the past few weeks that LION’s proposal represent a premium to TIGER’s stock price TIGER’s current stock price is temporarily trading below book value given its Third Quarter results With expected EPS of $.30 and a planned distribution of $.22 in the Fourth Quarter, TIGER stock should return to book value or exceed it Over the last two years, TIGER has consistently traded in line with reported GAAP book value per share The intrinsic value of TIGER’s stock exceeds the value of LION’s current proposal The current value of the expected future trading price of TIGER stock based on a range of estimates and multiples for comparable companies and TIGER’s historical trading multiples support higher prices TIGER can further enhance the value to its shareholders by using its expected liquidity to buy back stock at current levels The premiums paid in similar transactions, where a sponsor or affiliate of the target is the buyer, significantly exceeds the current proposal In situations where there is only one buyer, the premiums average 24% If the transaction is viewed as a $2.3 billion offering of LION’s stock and the investment of the proceeds in earning assets, this transaction provides large savings to LION relative to that alternative Avoidance of underwriting discount and fees as well as the market impact of issuing one third of LION’s current liquid stock market capitalization Roughly equivalent to $1.85 per TIGER share |

| Proposal Value 1. TIGER book value is $10.42 as of 9/30/13 0.480 Exchange Ratio Date 11/22/2013 20-Day VWAP YTD VWAP LION Share Price $23.30 $22.97 $19.58 Implied Purchase Price $11.18 $11.03 $9.40 Implied Total Purchase Price ($mm) $2,291 $2,258 $1,925 TIGER Share Price $9.64 $9.69 $10.67 Premium to TIGER 11/22/13 Price 16.0% 14.4% (2.5%) 20-Day VWAP 15.4% 13.8% (3.0%) YTD VWAP 4.8% 3.3% (11.9%) Premium to TIGER Book Value (1) 7.3% 5.8% (9.8%) |
| Implied Value of Proposal at Exchange Ratio of 0.48 Pricing as of November 22, 2013 Source: SNL Financial Based on LION Share Price $0.00 $2.50 $5.00 $7.50 $10.00 $12.50 11/22/2010 5/22/2011 11/22/2011 5/22/2012 11/22/2012 5/22/2013 11/22/2013 Implied TIGER Valuation Per Share TIGER Share Price |
| TIGER Book Value, Book Multiple, EPS and Distributions By Quarter Source: Company filings 0.00x 0.25x 0.50x 0.75x 1.00x 1.25x $0.00 $3.00 $6.00 $9.00 $12.00 $15.00 12/31/11 03/31/12 06/30/12 09/30/12 12/31/12 03/31/13 06/30/13 09/30/13 Book Value Per Share Price/Book 1.00x Book $0.70 $0.60 $0.50 $0.40 $0.30 $0.20 $0.10 $0.00 12/31/11 03/31/12 06/30/12 09/30/12 12/31/12 03/31/13 06/30/13 09/30/13 12/31/13E Earnings Per Share Income Distributions $0.61 $0.43 $0.48 $0.39 $0.40 $0.46 $0.39 $0.30 $0.18 $0.18 $0.21 $0.21 $0.21 $0.21 $0.21 $0.16 $0.22 $0.22 |
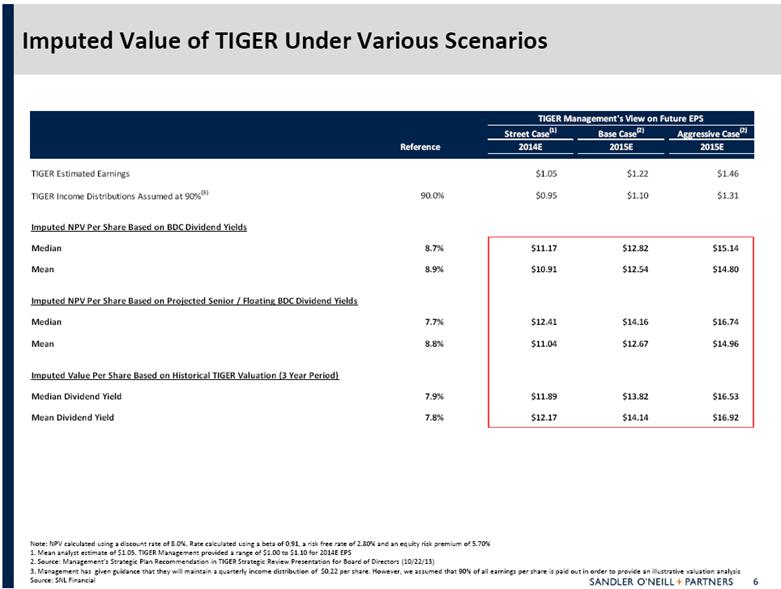
| Note: NPV calculated using a discount rate of 8.0%. Rate calculated using a beta of 0.91, a risk free rate of 2.80% and an equity risk premium of 5.70% 1. Mean analyst estimate of $1.05. TIGER Management provided a range of $1.00 to $1.10 for 2014E EPS 2. Source: Management’s Strategic Plan Recommendation in TIGER Strategic Review Presentation for Board of Directors (10/22/13) 3. Management has given guidance that they will maintain a quarterly income distribution of $0.22 per share. However, we assumed that 90% of all earnings per share is paid out in order to provide an illustrative valuation analysis Source: SNL Financial Imputed Value of TIGER Under Various Scenarios TIGER Management's View on Future EPS Street Case (1) Base Case (2) Aggressive Case (2) Reference 2014E 2015E 2015E TIGER Estimated Earnings $1.05 $1.22 $1.46 TIGER Income Distributions Assumed at 90% (3) 90.0% $0.95 $1.10 $1.31 Imputed NPV Per Share Based on BDC Dividend Yields Median 8.7% $11.17 $12.82 $15.14 Mean 8.9% $10.91 $12.54 $14.80 Imputed NPV Per Share Based on Projected Senior / Floating BDC Dividend Yields Median 7.7% $12.41 $14.16 $16.74 Mean 8.8% $11.04 $12.67 $14.96 Imputed Value Per Share Based on Historical TIGER Valuation (3 Year Period) Median Dividend Yield 7.9% $11.89 $13.82 $16.53 Mean Dividend Yield 7.8% $12.17 $14.14 $16.92 |
| EPS Accretion / Dilution Based on TIGER Share Buybacks Note: Assumes 50% of buyback is funded at 7.50% coupon debt and 50% is funded with cash from the balance sheet that has an opportunity cost of 25 basis points 1. Mean analyst estimate of $1.05 in 2014. 2015 is calculated as the 2014E EPS multiplied by the long term mean analyst growth rate of 10% 2. Source: Management’s Strategic Plan Recommendation in TIGER Strategic Review Presentation for Board of Directors (10/22/13) Purchase Price $9.64 $10.00 $10.75 $11.18 $200 Million Buyback 2014 Street (1) 7.4% 6.9% 6.1% 5.7% 2015 Street (1) 7.7% 7.3% 6.5% 6.1% Base Case (2) 7.9% 7.5% 6.7% 6.3% Aggressive Case (2) 8.5% 8.0% 7.2% 6.8% |
| An examination of selected1 affiliated party financial services transactions indicated the following: The final offer price is a market premium in excess of 20% to the initial share price before offer The final offer is most often at a premium in excess of 10% to the initial offer The buyer typically submits 3-5 bids before agreeing to price with the seller In several cases the seller announced the existence of an offer to the public during the negotiating process M&A Perspective: Recent Affiliated-Party Financial Services Transactions Observations 1. Transactions involving U.S. based publicly-traded targets in the financial services industry with deal values between $500 million and $5 billion since January 1, 2007 where acquirer owned at least 10% of target pre –transaction and acquired 100% of the remaining stock 2. Includes special dividend Source: SNL Financial, Thompson IB, SEC filings |
| Comparison to LION Stand-Alone Equity Raise 1. Assumed to equal current deal value Components of Discounts in Offering Price and Aggregate Dollar Impacts Current Price $23.30 $23.30 $23.30 $23.30 Net Offering Price / Proceeds $20.00 $20.50 $21.00 $21.50 Pricing Discount to Current Price 11.5% 9.3% 7.1% 4.9% Underwriting Fees and Expenses 3.0% 3.0% 3.0% 3.0% Overall Fees & Discounts 14.2% 12.0% 9.9% 7.7% Total Economic Cost of Offering to LION ($ Aggregate) ($378.0) ($312.9) ($250.9) ($191.8) Equivalent Economic Cost per TIGER Share $1.85 $1.53 $1.22 $0.94 Implied Price per TIGER Share Including Book Value $12.27 $11.95 $11.64 $11.36 Assumptions and Inputs Total Target Capital Raise ($mm) (1) $2,290.8 TIGER Shares Outstanding (mm) 204.8 Proposed Deal Value per Share $11.18 TIGER Book Value per Share $10.42 Shares Issued to TIGER in Proposed Merger (mm) 98.3 |
| Appendix |

| Comparable Group Analysis for TIGER Note: Financial data as of MQR and LTM for ROE; pricing data as of November 22, 2013 1. Dividend yield computed as most recent quarterly dividend annualized divided by closing share price 2. Compass Point estimates are excluded Source: SNL Financial Dollar values in millions except share price Valuation Price/ Total Return 2013 2014 2015 Current Share Market Total LTM Est. Est. Est. Dividend Three One Price Cap Assets ROE NAV EPS EPS EPS Yield (1) Month Year Company Ticker ($) ($mm) ($mm) (%) (x) (x) (x) (x) (%) (%) (%) Business Development Companies Ares Capital Corporation ARCC 18.26 5,136 7,754 12.9 1.12 11.1 11.1 10.2 8.3 5.7 14.7 Prospect Capital Corporation PSEC 11.48 3,263 4,784 10.2 1.07 9.0 9.1 9.5 11.5 5.1 21.5 Apollo Investment Corporation AINV 8.89 1,998 3,140 8.0 1.07 10.1 10.3 9.1 9.0 13.9 22.1 Fifth Street Finance Corp. FSC 10.19 1,415 1,897 10.2 1.03 9.5 9.0 8.3 11.3 (0.8) 7.3 Main Street Capital Corporation MAIN 31.79 1,263 1,239 15.3 1.59 15.8 14.0 NA 6.2 11.0 13.9 Hercules Technology Growth Capital, Inc. HTGC 17.04 1,052 1,228 17.2 1.64 14.0 13.1 11.8 7.3 17.1 74.4 Solar Capital Ltd. SLRC 23.04 1,020 1,256 7.2 1.04 12.2 13.1 12.6 6.9 6.5 12.1 Triangle Capital Corporation TCAP 28.79 797 807 18.5 1.81 12.8 12.5 NA 7.5 (0.8) 25.4 Golub Capital BDC, Inc. GBDC 18.25 789 1,016 9.6 1.21 13.7 13.4 11.6 7.0 8.2 27.5 PennantPark Investment Corporation PNNT 11.68 777 1,153 13.3 1.11 11.3 10.2 NA 9.6 6.9 26.0 Blackrock Kelso Capital Corporation BKCC 9.70 722 1,194 9.1 1.03 10.9 10.0 10.3 10.7 (1.1) 8.6 New Mountain Finance Corporation NMFC 14.87 672 548 12.5 1.04 9.8 10.9 NA 9.1 4.2 12.3 Medley Capital Corporation MCC 13.99 561 725 9.5 1.11 9.3 8.9 8.0 10.6 4.2 11.5 THL Credit, Inc. TCRD 16.73 567 598 10.7 1.25 11.6 11.6 10.8 8.1 12.2 30.4 TICC Capital Corp. TICC 10.56 563 1,022 12.6 1.07 10.1 9.3 8.9 11.0 11.6 23.4 TCP Capital Corp. TCPC 17.21 534 729 9.0 1.14 10.6 10.4 NA 8.4 14.0 26.5 Median 15.80 793 1,173 10.5 1.11 11.0 10.7 10.2 8.7 6.7 21.8 Mean 16.33 1,494 2,080 11.5 1.18 11.8 11.3 10.4 8.9 7.9 22.8 Business Development Companies - Senior / Floating Funds Solar Senior Capital Ltd. SUNS 18.48 213 286 4.0 1.03 15.7 13.7 12.8 7.6 4.6 12.1 PennantPark Floating Rate Capital PFLT 13.79 205 329 9.0 0.98 12.2 12.0 NA 7.8 4.2 16.3 Oxford Lane Capital Corporation OXLC 15.96 122 146 9.5 0.99 14.1 14.1 NA 13.8 3.0 16.5 Fifth Street Senior Floating Rate Corp. FSFR 13.41 89 100 NA 0.89 41.9 12.4 NA 6.0 (3.8) (3.8) Median 14.88 164 216 9.0 0.98 14.9 13.1 12.8 7.7 3.6 14.2 Mean 15.41 157 215 7.5 0.97 21.0 13.1 12.8 8.8 2.0 10.3 TIGER TIGER 9.64 1,975 8,472 13.5 0.93 7.6 (2) 9.2 (2) 8.3 9.1 (5.2) 3.2 |