Exhibit (c)(10)
| December 6, 2013 Presentation to the Transaction Committee Regarding Project WILDCATS Equity Research |

| GENERAL INFORMATION AND LIMITATIONS This presentation, and the oral or video presentation that supplements it, have been developed by and are proprietary to Sandler O'Neill & Partners, L.P. and were prepared exclusively for the benefit and internal use of the recipient. Neither the printed presentation nor the oral or video presentation that supplements it, nor any of their contents, may be reproduced, distributed or used for any other purpose without the prior written consent of Sandler O'Neill & Partners, L.P. The analyses contained herein rely upon information obtained from the recipient or from public sources, the accuracy of which has not been verified, and cannot be assured, by Sandler O'Neill & Partners, L.P. Moreover, many of the projections and financial analyses herein are based on estimated financial performance prepared by or in consultation with the recipient and are intended only to suggest reasonable ranges of results. Finally, the printed presentation is incomplete without the oral or video presentation that supplements it. Sandler O’Neill & Partners, L.P. prohibits employees from offering, directly or indirectly, favorable research, a specific rating or a specific price target, or offering or threatening to change research, a rating or a price target to a company as consideration or inducement for the receipt of business or compensation. The Firm also prohibits research analysts from being compensated for their involvement in, or based upon, specific investment banking transactions. Sandler O'Neill & Partners, L.P. is a limited partnership, the sole general partner of which is Sandler O'Neill & Partners Corp., a New York corporation. Sandler O'Neill & Partners, L.P. is a registered broker-dealer and a member of the Financial Industry Regulatory Authority. Sandler O'Neill Mortgage Finance L.P. is an indirect subsidiary of Sandler O'Neill & Partners Corp. This material is protected under applicable copyright laws and does not carry any rights of publication or disclosure. |

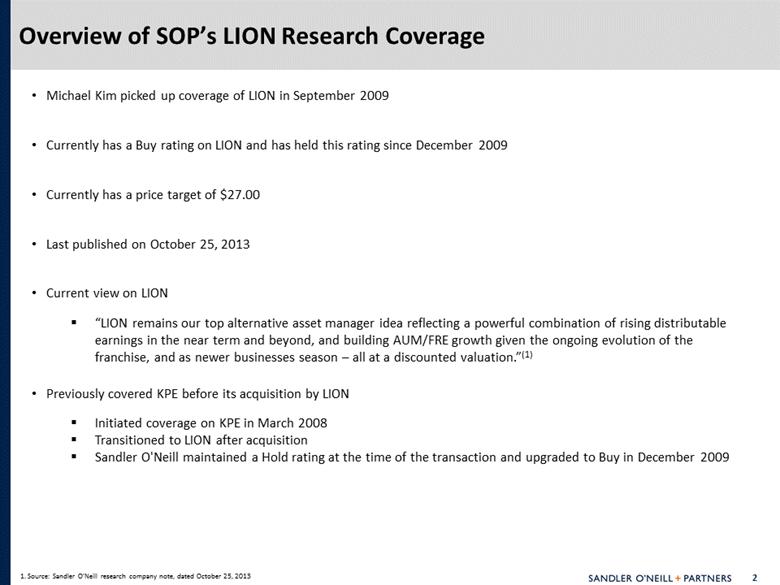
| Overview of SOP’s LION Research Coverage Michael Kim picked up coverage of LION in September 2009 Currently has a Buy rating on LION and has held this rating since December 2009 Currently has a price target of $27.00 Last published on October 25, 2013 Current view on LION “LION remains our top alternative asset manager idea reflecting a powerful combination of rising distributable earnings in the near term and beyond, and building AUM/FRE growth given the ongoing evolution of the franchise, and as newer businesses season – all at a discounted valuation.”(1) Previously covered KPE before its acquisition by LION Initiated coverage on KPE in March 2008 Transitioned to LION after acquisition Sandler O'Neill maintained a Hold rating at the time of the transaction and upgraded to Buy in December 2009 1. Source: Sandler O’Neill research company note, dated October 25, 2013 |
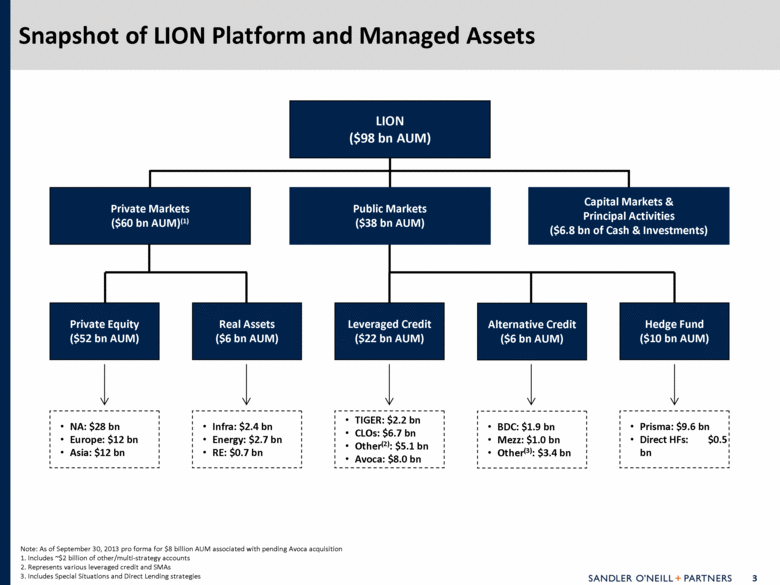
| Snapshot of LION Platform and Managed Assets Note: As of September 30, 2013 pro forma for $8 billion AUM associated with pending Avoca acquisition 1. Includes ~$2 billion of other/multi-strategy accounts 2. Represents various leveraged credit and SMAs 3. Includes Special Situations and Direct Lending strategies NA: $28 bn Europe: $12 bn Asia: $12 bn Infra: $2.4 bn Energy: $2.7 bn RE: $0.7 bn TIGER: $2.2 bn CLOs: $6.7 bn Other(2): $5.1 bn Avoca: $8.0 bn BDC: $1.9 bn Mezz: $1.0 bn Other(3): $3.4 bn Prisma: $9.6 bn Direct HFs: $0.5 bn Private Equity ($52 bn AUM) Real Assets ($6 bn AUM) Leveraged Credit ($22 bn AUM) Alternative Credit ($6 bn AUM) Hedge Fund ($10 bn AUM) Capital Markets & Principal Activities ($6.8 bn of Cash & Investments) Public Markets ($38 bn AUM) Private Markets ($60 bn AUM)(1) LION ($98 bn AUM) |
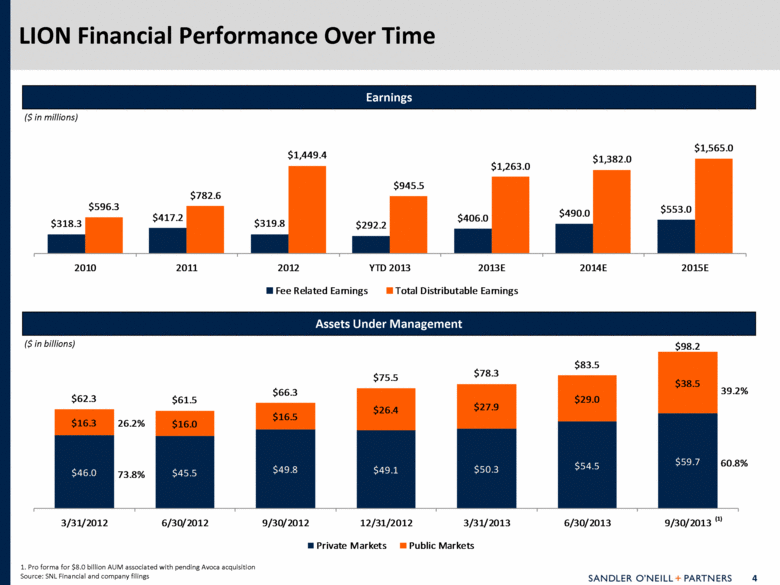
| LION Financial Performance Over Time 1. Pro forma for $8.0 billion AUM associated with pending Avoca acquisition Source: SNL Financial and company filings ($ in millions) Earnings ($ in billions) Assets Under Management $318.3 $417.2 $319.8 $292.2 $406.0 $490.0 $553.0 $596.3 $782.6 $1,449.4 $945.5 $1,263.0 $1,382.0 $1,565.0 2010 2011 2012 YTD 2013 2013E 2014E 2015E Fee Related Earnings Total Distributable Earnings $46.0 $45.5 $49.8 $49.1 $50.3 $54.5 $59.7 $16.3 $16.0 $16.5 $26.4 $27.9 $29.0 $38.5 $62.3 $61.5 $66.3 $75.5 $78.3 $83.5 $98.2 3/31/2012 6/30/2012 9/30/2012 12/31/2012 3/31/2013 6/30/2013 9/30/2013 Private Markets Public Markets 26.2% 73.8% 39.2% 60.8% (1) |
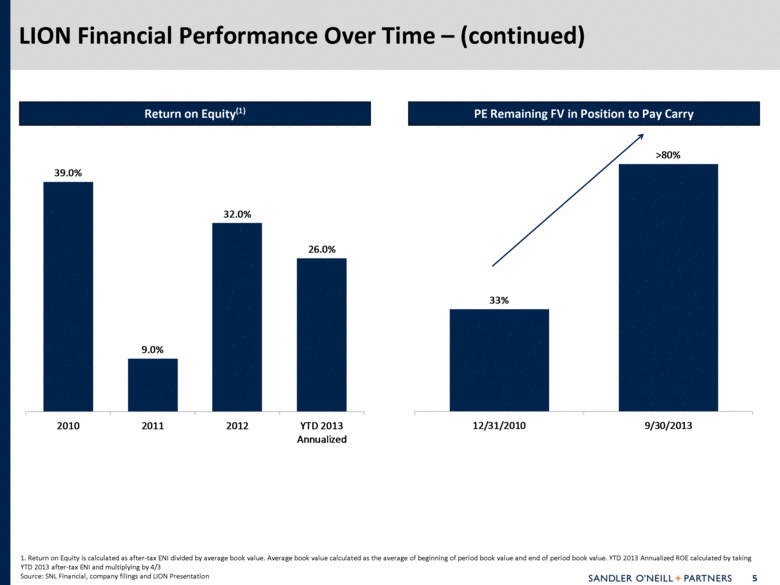
| LION Financial Performance Over Time – (continued) 1. Return on Equity is calculated as after-tax ENI divided by average book value. Average book value calculated as the average of beginning of period book value and end of period book value. YTD 2013 Annualized ROE calculated by taking YTD 2013 after-tax ENI and multiplying by 4/3 Source: SNL Financial, company filings and LION Presentation Return on Equity(1) PE Remaining FV in Position to Pay Carry 33% >80% 12/31/2010 9/30/2013 2010 2011 2012 YTD 2013 Annualized 39.0% 9.0% 32.0% 26.0% |
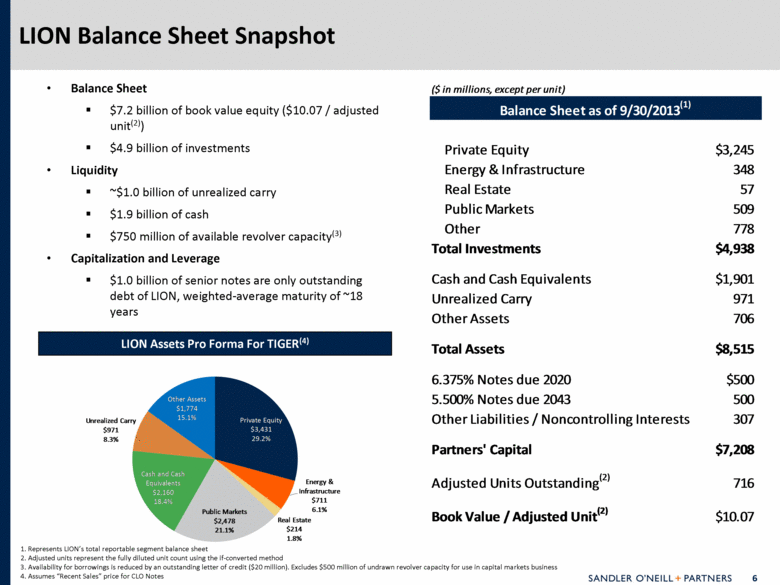
| LION Balance Sheet Snapshot 1. Represents LION’s total reportable segment balance sheet 2. Adjusted units represent the fully diluted unit count using the if-converted method 3. Availability for borrowings is reduced by an outstanding letter of credit ($20 million). Excludes $500 million of undrawn revolver capacity for use in capital markets business 4. Assumes “Recent Sales” price for CLO Notes Balance Sheet $7.2 billion of book value equity ($10.07 / adjusted unit(2)) $4.9 billion of investments Liquidity ~$1.0 billion of unrealized carry $1.9 billion of cash $750 million of available revolver capacity(3) Capitalization and Leverage $1.0 billion of senior notes are only outstanding debt of LION, weighted-average maturity of ~18 years LION Assets Pro Forma For TIGER(4) ($ in millions, except per unit) Balance Sheet as of 9/30/2013 (1) Private Equity $3,245 Energy & Infrastructure 348 Real Estate 57 Public Markets 509 Other 778 Total Investments $4,938 Cash and Cash Equivalents $1,901 Unrealized Carry 971 Other Assets 706 Total Assets $8,515 6.375% Notes due 2020 $500 5.500% Notes due 2043 500 Other Liabilities / Noncontrolling Interests 307 Partners' Capital $7,208 Adjusted Units Outstanding (2) 716 Book Value / Adjusted Unit (2) $10.07 Private Equity $3,431 29.2% Energy & Infrastructure $711 6.1% Real Estate $ 214 1.8 % Public Markets $2,478 21.1% Cash and Cash Equivalents $2,160 18.4% Unrealized Carry $971 8.3% Other Assets $ 1 , 774 15.1 % |
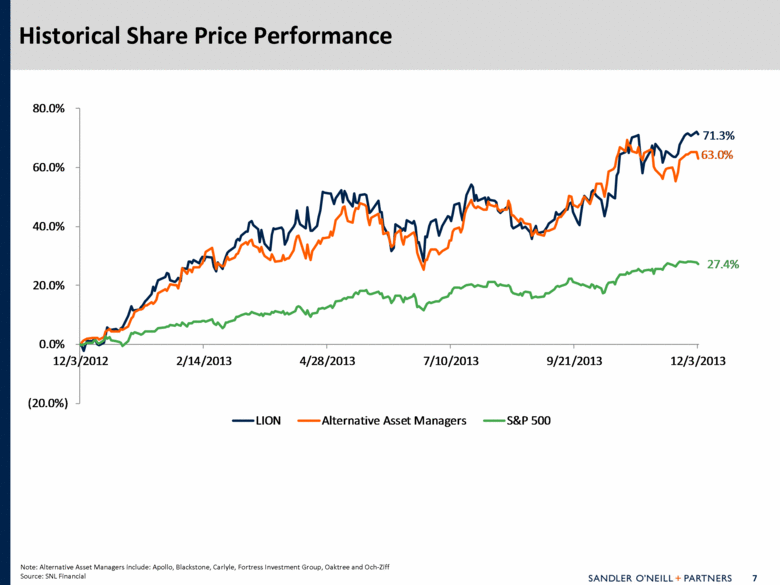
| Historical Share Price Performance Note: Alternative Asset Managers include: Apollo, Blackstone, Carlyle, Fortress Investment Group, Oaktree and Och-Ziff Source: SNL Financial 71.3% 63.0% 27.4% (20.0%) 0.0% 20.0% 40.0% 60.0% 80.0% 12/3/2012 2/14/2013 4/28/2013 7/10/2013 9/21/2013 12/3/2013 LION Alternative Asset Managers S&P 500 |
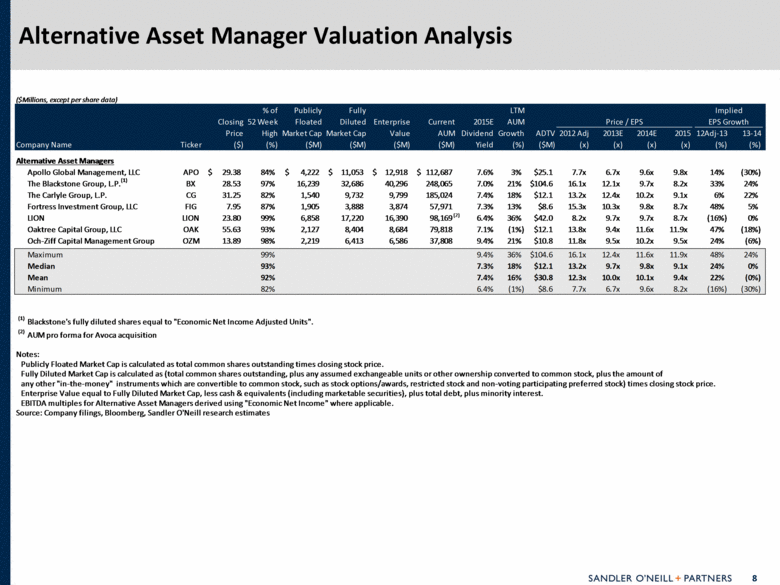
| Alternative Asset Manager Valuation Analysis ($Millions, except per share data) % of Publicly Fully LTM Implied Closing 52 Week Floated Diluted Enterprise Current 2015E AUM Price / EPS EPS Growth Price High Market Cap Market Cap Value AUM Dividend Growth ADTV 2012 Adj 2013E 2014E 2015 12Adj-13 13-14 Company Name Ticker ($) (%) ($M) ($M) ($M) ($M) Yield (%) ($M) (x) (x) (x) (x) (%) (%) Alternative Asset Managers Apollo Global Management, LLC APO 29.38 $ 84% 4,222 $ 11,053 $ 12,918 $ 112,687 $ 7.6% 3% $25.1 7.7x 6.7x 9.6x 9.8x 14% (30%) The Blackstone Group, L.P. (1) BX 28.53 97% 16,239 32,686 40,296 248,065 7.0% 21% $104.6 16.1x 12.1x 9.7x 8.2x 33% 24% The Carlyle Group, L.P. CG 31.25 82% 1,540 9,732 9,799 185,024 7.4% 18% $12.1 13.2x 12.4x 10.2x 9.1x 6% 22% Fortress Investment Group, LLC FIG 7.95 87% 1,905 3,888 3,874 57,971 7.3% 13% $8.6 15.3x 10.3x 9.8x 8.7x 48% 5% LION LION 23.80 99% 6,858 17,220 16,390 98,169 6.4% 36% $42.0 8.2x 9.7x 9.7x 8.7x (16%) 0% Oaktree Capital Group, LLC OAK 55.63 93% 2,127 8,404 8,684 79,818 7.1% (1%) $12.1 13.8x 9.4x 11.6x 11.9x 47% (18%) Och-Ziff Capital Management Group OZM 13.89 98% 2,219 6,413 6,586 37,808 9.4% 21% $10.8 11.8x 9.5x 10.2x 9.5x 24% (6%) Maximum 99% 9.4% 36% $104.6 16.1x 12.4x 11.6x 11.9x 48% 24% Median 93% 7.3% 18% $12.1 13.2x 9.7x 9.8x 9.1x 24% 0% Mean 92% 7.4% 16% $30.8 12.3x 10.0x 10.1x 9.4x 22% (0%) Minimum 82% 6.4% (1%) $8.6 7.7x 6.7x 9.6x 8.2x (16%) (30%) (1) Blackstone's fully diluted shares equal to "Economic Net Income Adjusted Units". (2) AUM pro forma for Avoca acquisition Notes: Publicly Floated Market Cap is calculated as total common shares outstanding times closing stock price. Fully Diluted Market Cap is calculated as (total common shares outstanding, plus any assumed exchangeable units or other ownership converted to common stock, plus the amount of any other "in-the-money" instruments which are convertible to common stock, such as stock options/awards, restricted stock and non-voting participating preferred stock) times closing stock price. Enterprise Value equal to Fully Diluted Market Cap, less cash & equivalents (including marketable securities), plus total debt, plus minority interest. EBITDA multiples for Alternative Asset Managers derived using "Economic Net Income" where applicable. Source: Company filings, Bloomberg, Sandler O'Neill research estimates (2) |
| LION—View on Valuation Catalysts 1: Rising Distributable Earnings Sizeable embedded gains (unrealized carry up to nearly $1 billion) Mature/liquid portfolio 80%+ of private equity AUM in a position to pay cash carry (Europe II Fund close to crossing over into cash carry) Recent shift in balance sheet and payout structure, with related investments more diversified, liquid, and income-oriented 2: Building Assets Under Management / Fee-Related Earnings Growth Ongoing evolution of the franchise driving steadier AUM growth, deal flow, realizations and fee related earnings Scaling of newer businesses (energy & income growth, natural resources, real estate, infrastructure, mezzanine, special situations, hedge funds, closed-end funds, Avoca European liquid credit) that generate FRE High incremental margins following a considerable investment cycle in 2010-2012 Fundraising catalysts (rising allocations to alternatives, strong investment performance track records, accelerating distributions to LPs) Broadening distribution reach (growing the LP base, accelerating cross-selling, focus on SWFs and HNW investors) Balance sheet enables differentiated drop-down funds 3: More Consistent Deal Flow Continuing to put capital to work in the U.S. and in Asia, while competitors remain more hesitant Rising investment activity driving a real-time step up in transaction/syndication fees Sustained deal flow bodes well for realizations and fundraising over time 4: Upward Revaluation LION trading at a meaningful discount to peers based on Distributable Earnings (FRE + realized performance fees + realized investment income) Strong yield for unit holders; ~6% in 2014 Book value = 40%+ of the stock’s current market capitalization |
| LION—View on Valuation (continued) Pushbacks 1: Less Diversified vs. Peers: Legacy private equity business still accounts for a majority of AUM/earnings 2: Less Mature Business Mix: Still relatively early in the firm’s evolution (will take time for newer businesses to season and more meaningfully contribute to earnings) 3: Concentration Risk: Fewer funds/strategies relative to peers translates into a narrower pool to drive fundraising, deal flow and realizations 4: Depressed Distributable Earnings: Europe II Fund working through netting holes 5: Unlocking Distributable Earnings Power: Currently retaining 60% of balance sheet derived income for growth versus paying out related income to unit holders |
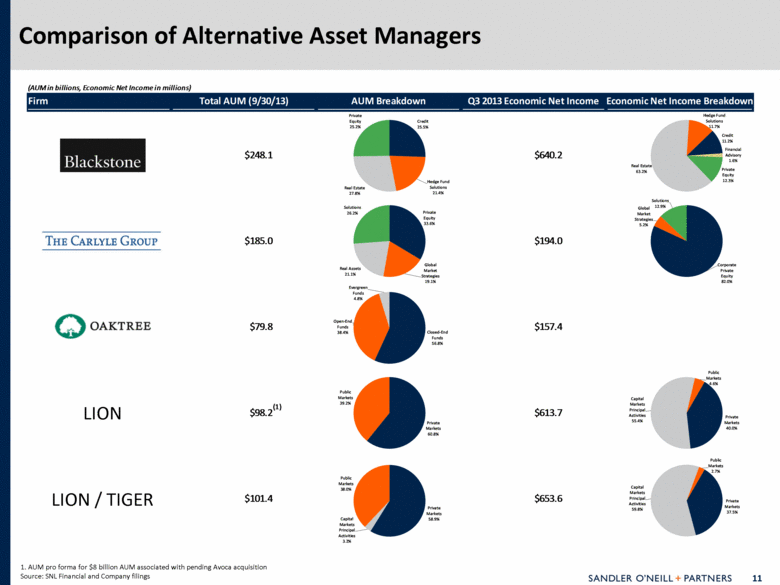
| Comparison of Alternative Asset Managers LION LION / TIGER 1. AUM pro forma for $8 billion AUM associated with pending Avoca acquisition Source: SNL Financial and Company filings (AUM in billions, Economic Net Income in millions) Firm Total AUM (9/30/13) AUM Breakdown Q3 2013 Economic Net Income Economic Net Income Breakdown $248.1 $640.2 $185.0 $194.0 $79.8 $157.4 $98.2 $613.7 $101.4 $653.6 (1) Credit 25.5% Hedge Fund Solutions 21.4 % Real Estate 27.8% Private Equity 25.2% Closed - End Funds 56.8% Open - End Funds 38.4% Evergreen Funds 4.8% Private Markets 58.9% Capital Markets Principal Activities 3.2% Public Markets 38.0% Corporate Private Equity 82.0% Global Market Strategies 5.2% Solutions 12.9% Private Markets 37.5% Capital Markets Principal Activities 59.8% Public Markets 2.7% Private Equity 33.6% Global Market Strategies 19.1% Real Assets 21.1% Solutions 26.2 % Private Equity 12.3% Real Estate 63.2% Hedge Fund Solutions 11.7% Credit 11.2% Financial Advisory 1.6 % Solutions 26.2% Private Equity 33.6% Real Assets 21.1% Global Market Strategies 19.1% Public Markets 39.2% Private Markets 60.8% Real Estate 63.2% Private Equity 12.3% Capital Markets Principal Activities 55.4% Public Markets 4.6% Private Markets 40.0% |
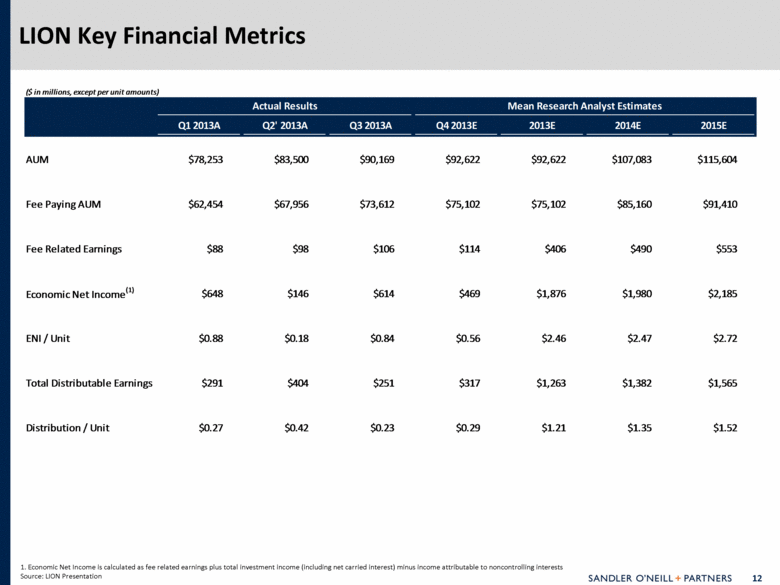
| LION Key Financial Metrics 1. Economic Net Income is calculated as fee related earnings plus total investment income (including net carried interest) minus income attributable to noncontrolling interests Source: LION Presentation ($ in millions, except per unit amounts) Actual Results Mean Research Analyst Estimates Q1 2013A Q2' 2013A Q3 2013A Q4 2013E 2013E 2014E 2015E AUM $78,253 $83,500 $90,169 $92,622 $92,622 $107,083 $115,604 Fee Paying AUM $62,454 $67,956 $73,612 $75,102 $75,102 $85,160 $91,410 Fee Related Earnings $88 $98 $106 $114 $406 $490 $553 Economic Net Income (1) $648 $146 $614 $469 $1,876 $1,980 $2,185 ENI / Unit $0.88 $0.18 $0.84 $0.56 $2.46 $2.47 $2.72 Total Distributable Earnings $291 $404 $251 $317 $1,263 $1,382 $1,565 Distribution / Unit $0.27 $0.42 $0.23 $0.29 $1.21 $1.35 $1.52 |
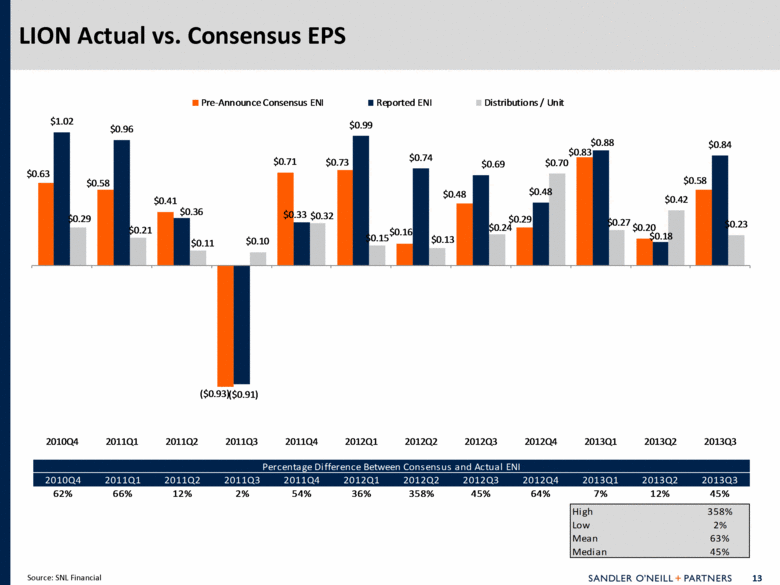
| LION Actual vs. Consensus EPS Source: SNL Financial $0.63 $0.58 $ 0.41 ($ 0.93 ) $0.71 $0.73 $0.16 $0.48 $0.29 $0.83 $ 0.20 $ 0.58 $1.02 $0.96 $0.36 ($0.91) $0.33 $0.99 $ 0.74 $ 0.69 $0.48 $0.88 $0.18 $0.84 $0.29 $0.21 $ 0.11 $ 0.10 $0.32 $0.15 $0.13 $0.24 $0.70 $0.27 $ 0.42 $ 0.23 2010Q4 2011Q1 2011Q2 2011Q3 2011Q4 2012Q1 2012Q2 2012Q3 2012Q4 2013Q1 2013Q2 2013Q3 Pre-Announce Consensus ENI Reported ENI Distributions / Unit Percentage Difference Between Consensus and Actual ENI 2010Q4 2011Q1 2011Q2 2011Q3 2011Q4 2012Q1 2012Q2 2012Q3 2012Q4 2013Q1 2013Q2 2013Q3 62% 66% 12% 2% 54% 36% 358% 45% 64% 7% 12% 45% High 358% Low 2% Mean 63% Medi an 45% |
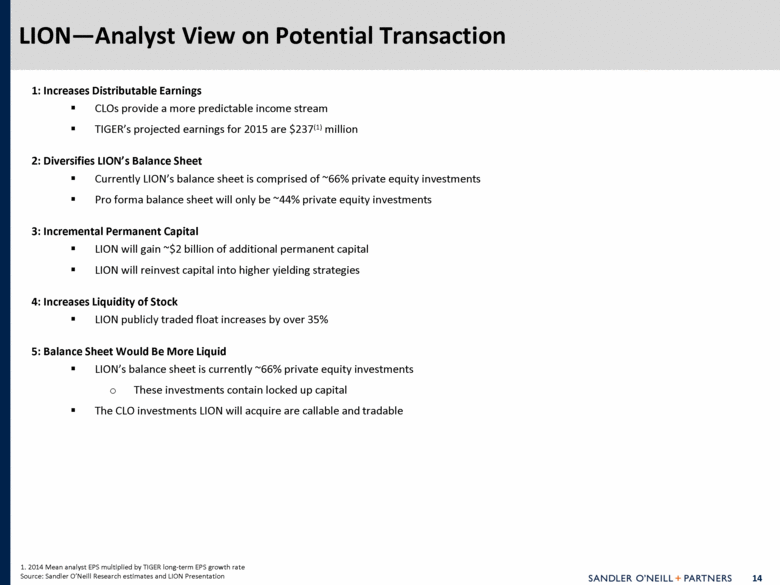
| LION—Analyst View on Potential Transaction 1. 2014 Mean analyst EPS multiplied by TIGER long-term EPS growth rate Source: Sandler O’Neill Research estimates and LION Presentation 1: Increases Distributable Earnings CLOs provide a more predictable income stream TIGER’s projected earnings for 2015 are $237(1) million 2: Diversifies LION’s Balance Sheet Currently LION’s balance sheet is comprised of ~66% private equity investments Pro forma balance sheet will only be ~44% private equity investments 3: Incremental Permanent Capital LION will gain ~$2 billion of additional permanent capital LION will reinvest capital into higher yielding strategies 4: Increases Liquidity of Stock LION publicly traded float increases by over 35% 5: Balance Sheet Would Be More Liquid LION’s balance sheet is currently ~66% private equity investments These investments contain locked up capital The CLO investments LION will acquire are callable and tradable |