Exhibit (c)(4)
| November 6, 2013 Presentation to the Transaction Committee Regarding Project WILDCATS Strictly Private & Confidential SANDLER O’NEILL + PARTNERS, L.P. |
| GENERAL INFORMATION AND LIMITATIONS This presentation, and the oral or video presentation that supplements it, have been developed by and are proprietary to Sandler O'Neill & Partners, L.P. and were prepared exclusively for the benefit and internal use of the recipient. Neither the printed presentation nor the oral or video presentation that supplements it, nor any of their contents, may be reproduced, distributed or used for any other purpose without the prior written consent of Sandler O'Neill & Partners, L.P. The analyses contained herein rely upon information obtained from the recipient or from public sources, the accuracy of which has not been verified, and cannot be assured, by Sandler O'Neill & Partners, L.P. Moreover, many of the projections and financial analyses herein are based on estimated financial performance prepared by or in consultation with the recipient and are intended only to suggest reasonable ranges of results. Finally, the printed presentation is incomplete without the oral or video presentation that supplements it. Sandler O’Neill & Partners, L.P. prohibits employees from offering, directly or indirectly, favorable research, a specific rating or a specific price target, or offering or threatening to change research, a rating or a price target to a company as consideration or inducement for the receipt of business or compensation. The Firm also prohibits research analysts from being compensated for their involvement in, or based upon, specific investment banking transactions. Sandler O'Neill & Partners, L.P. is a limited partnership, the sole general partner of which is Sandler O'Neill & Partners Corp., a New York corporation. Sandler O'Neill & Partners, L.P. is a registered broker-dealer and a member of the Financial Industry Regulatory Authority. Sandler O'Neill Mortgage Finance L.P. is an indirect subsidiary of Sandler O'Neill & Partners Corp. This material is protected under applicable copyright laws and does not carry any rights of publication or disclosure. SANDLER O’NEILL + PARTNERS |
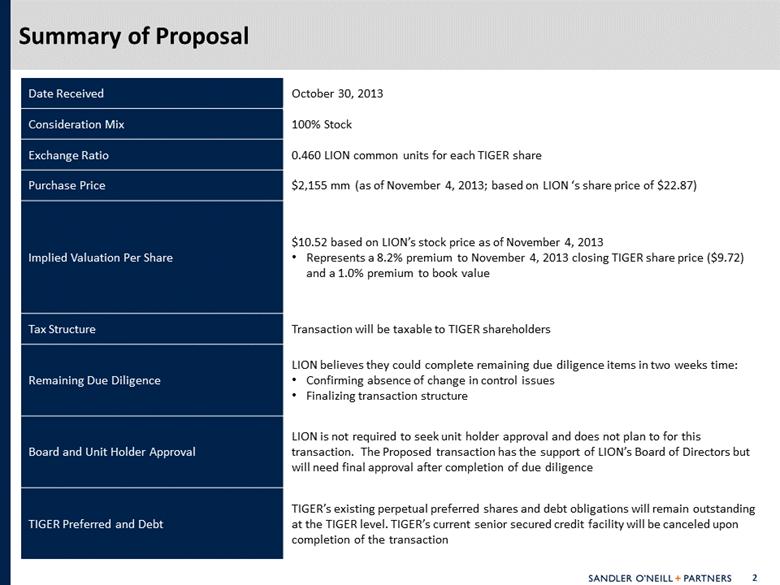
| Date Received October 30, 2013 Consideration Mix 100% Stock Exchange Ratio 0.460 LION common units for each TIGER share Purchase Price $2,155 mm (as of November 4, 2013; based on LION ‘s share price of $22.87) Implied Valuation Per Share $10.52 based on LION’s stock price as of November 4, 2013 Represents a 8.2% premium to November 4, 2013 closing TIGER share price ($9.72) and a 1.0% premium to book value Tax Structure Transaction will be taxable to TIGER shareholders Remaining Due Diligence LION believes they could complete remaining due diligence items in two weeks time: Confirming absence of change in control issues Finalizing transaction structure Board and Unit Holder Approval LION is not required to seek unit holder approval and does not plan to for this transaction. The Proposed transaction has the support of LION’s Board of Directors but will need final approval after completion of due diligence TIGER Preferred and Debt TIGER’s existing perpetual preferred shares and debt obligations will remain outstanding at the TIGER level. TIGER’s current senior secured credit facility will be canceled upon completion of the transaction Summary of Proposal |
| TIGER Trading Activity and Market Valuation 1. Dividend yield computed as most recent quarterly dividend annualized divided by closing share price Pricing as of November 4, 2013 Source: SNL Financial 3 Year Share Price and Volume 0 5,000 10,000 15,000 $4.00 $8.00 $12.00 $16.00 11/04/10 03/04/11 07/04/11 11/04/11 03/04/12 07/04/12 11/04/12 03/04/13 07/04/13 11/04/13 Thousands Volume TIGER Share Price Market Statistics Share Price (11/4/13) $9.72 Market Cap ($mm) $1,991 Price / Book 0.93x Price / 2013E EPS 7.8x Price / 2014E EPS 9.2x Current Dividend Yield (1) 9.1% Price / 52 Week High 81.5% Price / 52 Week Low 104.5% YTD 1 Year 3 Years Avg. Share Price $10.72 $10.66 $9.65 Weighted Avg. Share Price $10.76 $10.69 $9.69 Avg. Daily Trading Volume 943,491 936,573 948,370 % of Shares Outstanding 0.46% 0.46% 0.46% |
| Historical Implied Value of Proposal – Exchange Ratio of 0.46 Pricing as of November 4, 2013 Source: SNL Financial Based on LION’s Historical Share Price $0.00 $2.50 $5.00 $7.50 $10.00 $12.50 11/4/2010 5/4/2011 11/4/2011 5/4/2012 11/4/2012 5/4/2013 11/4/2013 Implied TIGER Valuation Per Share TIGER Share Price |
| Historical Book Value and Market Valuation Quarterly Book Value Per Share and P / BV Multiples Since January 1, 2011 Pricing as of November 4, 2013 Source: SNL Financial 0.00x 0.25x 0.50x 0.75x 1.00x 1.25x $0.00 $3.00 $6.00 $9.00 $12.00 $15.00 12/31/10 03/31/11 06/30/11 09/30/11 12/31/11 03/31/12 06/30/12 09/30/12 12/31/12 03/31/13 06/30/13 09/30/13 Book Value Per Share Price/Book 1.00x Book Price / Book Value Ratios High 1.23x Low 0.71x Mean 0.99x Median 1.00x |
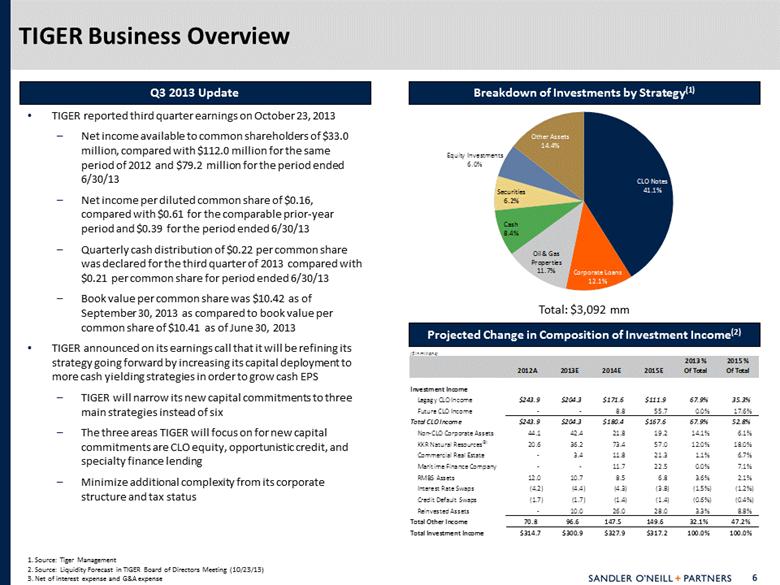
| TIGER reported third quarter earnings on October 23, 2013 Net income available to common shareholders of $33.0 million, compared with $112.0 million for the same period of 2012 and $79.2 million for the period ended 6/30/13 Net income per diluted common share of $0.16, compared with $0.61 for the comparable prior-year period and $0.39 for the period ended 6/30/13 Quarterly cash distribution of $0.22 per common share was declared for the third quarter of 2013 compared with $0.21 per common share for period ended 6/30/13 Book value per common share was $10.42 as of September 30, 2013 as compared to book value per common share of $10.41 as of June 30, 2013 TIGER announced on its earnings call that it will be refining its strategy going forward by increasing its capital deployment to more cash yielding strategies in order to grow cash EPS TIGER will narrow its new capital commitments to three main strategies instead of six The three areas TIGER will focus on for new capital commitments are CLO equity, opportunistic credit, and specialty finance lending Minimize additional complexity from its corporate structure and tax status TIGER Business Overview Projected Change in Composition of Investment Income(2) Q3 2013 Update Breakdown of Investments by Strategy(1) 1. Source: Tiger Management 2. Source: Liquidity Forecast in TIGER Board of Directors Meeting (10/23/13) 3. Net of interest expense and G&A expense Total: $3,092 mm CLO Notes 41.1% Corporate Loans 12.1% Oil & Gas Properties 11.7% Cash 8.4% Securities 6.2% Equity Investments 6.0% Other Assets 14.4% ($ in millions) 2013 % 2015 % 2012A 2013E 2014E 2015E Of Total Of Total Investment Income Legagy CLO Income $243.9 $204.3 $171.6 $111.9 67.9% 35.3% Future CLO Income - - 8.8 55.7 0.0% 17.6% Total CLO Income $243.9 $204.3 $180.4 $167.6 67.9% 52.8% Non-CLO Corporate Assets 44.1 42.4 21.8 19.2 14.1% 6.1% KKR Natural Resources (3) 20.6 36.2 73.4 57.0 12.0% 18.0% Commercial Real Estate - 3.4 11.8 21.3 1.1% 6.7% Maritime Finance Company - - 11.7 22.5 0.0% 7.1% RMBS Assets 12.0 10.7 8.5 6.8 3.6% 2.1% Interest Rate Swaps (4.2) (4.4) (4.3) (3.8) (1.5%) (1.2%) Credit Default Swaps (1.7) (1.7) (1.4) (1.4) (0.6%) (0.4%) Reinvested Assets - 10.0 26.0 28.0 3.3% 8.8% Total Other Income 70.8 96.6 147.5 149.6 32.1% 47.2% Total Investment Income $314.7 $300.9 $327.9 $317.2 100.0% 100.0% |
| Comparable Group Analysis for TIGER Note: Financial data as of MQR and LTM for ROE; pricing data as of November 4, 2013 1. Dividend yield computed as most recent quarterly dividend annualized divided by closing share price 2. American Capital, Ltd. Is excluded from the Median 3. Compass Point estimates are excluded Source: SNL Financial Dollar values in millions except share price Valuation Price/ Total Return 2013 2014 Current Share Market Total LTM Est. Est. Dividend Three One Price Cap Assets ROE NAV EPS EPS Yield (1) Month Year Company Ticker ($) ($mm) ($mm) (%) (x) (x) (x) (%) (%) (%) Business Development Companies Ares Capital Corporation ARCC 17.26 4,848 7,131 13.3 1.06 11.1 10.6 8.8 (2.7) 8.4 American Capital, Ltd. ACAS 14.43 4,253 6,260 12.5 0.75 16.6 14.9 0.0 7.2 22.2 Prospect Capital Corporation PSEC 11.43 3,182 4,448 10.0 1.07 8.7 8.8 11.6 7.5 18.6 Apollo Investment Corporation AINV 8.55 1,922 3,154 7.9 1.05 9.7 9.8 9.4 6.9 19.0 Fifth Street Finance Corp. FSC 10.25 1,423 1,897 10.2 1.04 9.6 9.2 11.2 (2.6) 4.9 Main Street Capital Corporation MAIN 30.59 1,213 1,228 17.1 1.63 14.8 13.9 6.3 0.4 10.5 Solar Capital Ltd. SLRC 22.30 987 1,256 7.2 1.00 11.8 12.5 7.2 2.4 6.8 Hercules Technology Growth Capital, Inc. HTGC 15.48 955 1,211 12.5 1.53 13.5 12.1 7.2 8.7 56.7 Triangle Capital Corporation TCAP 29.50 814 784 17.1 1.89 13.1 12.4 7.3 2.2 23.8 Golub Capital BDC, Inc. GBDC 17.51 757 1,016 9.6 1.16 13.3 13.0 7.3 (2.9) 20.5 PennantPark Investment Corporation PNNT 11.30 751 1,102 12.9 1.08 11.1 10.1 9.9 (0.6) 14.8 Blackrock Kelso Capital Corporation BKCC 9.42 699 1,094 8.3 1.01 10.4 10.1 11.0 (6.1) 5.5 New Mountain Finance Corporation NMFC 14.23 630 546 13.3 0.99 9.3 10.4 9.6 1.3 6.5 THL Credit, Inc. TCRD 16.56 561 555 11.4 1.22 11.3 11.4 8.2 9.3 28.5 Medley Capital Corporation MCC 13.90 558 725 9.5 1.10 9.3 8.9 10.6 (2.1) 7.1 TICC Capital Corp. TICC 10.16 535 1,025 14.6 1.04 9.6 8.8 11.4 4.0 12.4 TCP Capital Corp. TCPC 17.01 518 623 8.7 1.14 10.6 10.6 8.5 8.7 22.6 Median (2) 14.86 786 1,098 10.8 1.07 10.8 10.5 9.1 1.7 13.6 Business Development Companies - Senior / Floating Funds Solar Senior Capital Ltd. SUNS 18.08 208 286 4.0 1.01 15.3 13.4 7.8 2.1 11.8 PennantPark Floating Rate Capital PFLT 13.16 196 263 9.3 0.94 11.8 12.0 8.0 (5.8) 6.7 Oxford Lane Capital Corporation OXLC 15.76 120 146 9.5 0.97 13.9 13.9 14.0 1.3 13.0 Fifth Street Senior Floating Rate Corp. FSFR 13.53 90 100 NA 0.90 42.3 12.5 5.9 (5.2) (5.2) Median 14.65 158 205 9.3 0.96 14.6 12.9 7.9 (2.0) 9.2 TIGER TIGER 9.72 1,991 8,472 13.5 0.93 7.8 (3) 9.2 (3) 9.1 (6.1) 3.7 |
| Analysts’ Estimates & Views of TIGER 1. Median excludes Compass Point estimates as they are dated Source: SNL Financial, Bloomberg and FactSet Analyst Recommendations Median Analyst Estimates(1) 4 Analysts (66.7%) 2 Analysts (33.3%) Buy Hold $1.25 $1.06 2013FY 2014FY Stephens John Hecht Overwei ght $12.50 $1.38 $1.06 10/24/2013 JefferiesDani el Furtado Hol d $12.00 $1.27 $1.11 10/24/2013 Compass Poi nt Jason Stewart Buy $12.00 $1.62 $1.63 7/26/2013 Deutsche Bank Stephen Laws Buy $11.50 $1.25 $1.01 10/24/2013 FBR Capi tal Markets Scott Val enti n Hold $10.50 $1.25 $1.07 10/24/2013 Wel ls Fargo Securi ties Joel Houck Buy NA $1.21 $1.00 10/24/2013 |
| Valuation Perspectives – Based on 9/30/13 Values 1. Source: TIGER Management 2. Compass Point target price is excluded Source: SNL Financial and company filings Asset Level Mark-to-Market Methodologies (1) $9.25 $9.74 $9.89 $10.42 $10.52 $11.75 Share Price at 11/4 Close: $9.72 Thompson Reuters Management Liquidation Analysis Recent Sales of CLO Assets GAAP Book Value LION BID Median Analyst Target Price ($ in millions, except implied value per share) 9/30/2013 Asset Level Mark to Market Methodologies (1) Median Thompson Management Recent Sales GAAP 11/4/2013 LION BID Target Reuters Liquidation Analysis of CLO Assets Book Value Trading Value (As of 11/4/13) Price (2) BID BID Implied Value ($ / Share) $9.25 $9.74 $9.89 $10.42 $9.72 $10.52 $11.75 Implied Total Value $1,895 $1,995 $2,025 $2,134 $1,991 $2,155 $2,407 Implied Value / GAAP Book Value 0.89x 0.93x 0.95x 1.00x 0.93x 1.01x 1.13x LION BID Premium (Discount) to Value 13.7% 8.0% 6.4% 1.0% 8.2% 0.0% (10.5%) |
| Imputed Valuation of TIGER Under Management Scenarios 1. Source: Management’s Strategic Plan Recommendation in TIGER Strategic Review Presentation for Board of Directors (10/22/13) 2. Source: Liquidity Forecast in TIGER Board of Directors Meeting (10/23/13) Source: SNL Financial TIGER Management Team's View on Future Earnings Downside Case (1) Base Case (1) Aggressive Case (1) Liquidity Forecast (2) Liquidity Forecast (2) Reference 2015E 2015E 2015E 2014E 2015E TIGER Estimated Earnings $0.74 $1.22 $1.46 $0.94 $0.87 TIGER Distributions Assumed at 90% 90.0% $0.67 $1.10 $1.31 $0.85 $0.78 TIGER ROE $10.44 7.1% 11.7% 14.0% 9.0% 8.3% Imputed Value Per Share Based on BDC Dividend Yields Median 9.1% $7.33 $12.09 $14.47 $9.31 $8.62 Mean 9.1% $7.32 $12.07 $14.44 $9.30 $8.61 Imputed Value Per Share Based on Senior / Floating BDC Dividend Yields Median 7.9% $8.44 $13.92 $16.66 $10.72 $9.93 Mean 8.9% $7.47 $12.32 $14.74 $9.49 $8.79 Imputed Value Per Share Based on Historical TIGER Valuation (3 Year Period) Median Dividend Yield 7.9% $8.40 $13.85 $16.57 $10.67 $9.87 Mean Dividend Yield 7.7% $8.62 $14.22 $17.01 $10.95 $10.14 Median Price / Book 1.00x $10.44 $10.44 $10.44 $10.44 $10.44 Mean Price / Book 0.99x $10.34 $10.34 $10.34 $10.34 $10.34 Implied Price / Book Value Per Share - BDCs Median 0.70x 1.16x 1.39x 0.89x 0.83x Mean 0.70x 1.16x 1.38x 0.89x 0.82x Implied Price / Book Value Per Share - Senior / Floating BDCs Median 0.81x 1.33x 1.60x 1.03x 0.95x Mean 0.72x 1.18x 1.41x 0.91x 0.84x Implied Price / Book Value Per Share - Historical TIGER Valuation (3 Year Period) Median Dividend Yield 0.80x 1.33x 1.59x 1.02x 0.95x Mean Dividend Yield 0.83x 1.36x 1.63x 1.05x 0.97x Median Price / Book 1.00x 1.00x 1.00x 1.00x 1.00x Mean Price / Book 0.99x 0.99x 0.99x 0.99x 0.99x |
| An examination of selected1 affiliated party financial services transactions indicated the following: The final offer price is a market premium in excess of 20% to the initial share price before offer The final offer is most often at a premium in excess of 10% to the initial offer The buyer typically submits 3-5 bids before agreeing to price with the seller In several cases the seller announced the existence of an offer to the public during the negotiating process M&A Perspective: Recent Affiliated-Party Financial Services Transactions Observations 1. Transactions involving U.S. based publicly-traded targets in the financial services industry with deal values between $500 million and $5 billion since January 1, 2007 where acquirer owned at least 10% of target pre –transaction and acquired 100% of the remaining stock. Source: SNL Financial, Thompson IB, SEC filings 11/12/2012 Annaly Capital Management Inc CreXus Investment Corp $876 $11.10 $12.50 $13.05 4 12.6% 17.6% 4.4% 08/12/2008 Bank of Tokyo-Mitsubishi UFJ Ltd UnionBanCal Corp,CA $3,707 $53.02 $58.00 $73.50 3 9.4% 38.6% 26.7% 03/10/2008 Nationwide Mutual Insurance Co Nationwide Finl Svcs Inc $2,450 $40.00 $47.20 $52.25 3 18.0% 30.6% 10.7% 07/17/2007 Alfa Mutual Alfa Corp $890 $15.20 $17.60 $22.00 5 15.8% 44.7% 25.0% 10/13/2008 Banco Santander SA Sovereign Bancorp Inc $1,910 $3.81 $3.81 $3.81 1 0.0% 0.0% 0.0% 11/20/2006 Toronto-Dominion Bank TD Banknorth Inc $3,232 $28.81 $32-34 $32.33 6 14.5% 12.2% -2.0% 11/12/2012 Leucadia National Corp Jefferies Group Inc $2,561 $14.27 $16.46 $17.66 2 15.4% 23.7% 7.3% Mean 3.4 12.2% 23.9% 10.3% Median 3.0 14.5% 23.7% 7.3% |
| LION Trading Activity and Market Valuation Pricing as of November 4, 2013 1. Assumes conversion of operating partnership units into common shares Source: SNL Financial and company filings 0 5,000 10,000 15,000 20,000 $0.00 $5.00 $10.00 $15.00 $20.00 $25.00 11/04/10 05/04/11 11/04/11 05/04/12 11/04/12 05/04/13 11/04/13 Thousands Volume LION Share Price Market Statistics Price and Volume Statistics Share Price (11/4/13) $22.87 Stated Market Cap ($mm) $6,590 Implied 1 Market Cap ($mm) $16,011 Price / 2013E EPS 9.3x Price / 2014E EPS 9.6x Price / Book 2.61x Price / 52 Week High 95% Price / 52 Week Low 171% Dividend Yield 4.0% |
| LION—Summary of Equity Research Source: Bloomberg and FactSet Analyst Recommendations Median Analyst Estimates 10 Analysts (66.7%) 4 Analysts (26.7%) Buy Hold $2.47 $2.39 2013FY 2014FY Sterne, Agee & Leach Jason Weyeneth Buy $28.00 $2.49 $2.57 10/25/2013 Sandler O'Nei l l Michael Ki m Buy $27.00 $2.46 $2.33 10/25/2013 Argus Research Corp David Ritter Buy $26.00 $2.20 $2.37 8/27/2013 Goldman Sachs Marc Irizarry Buy / Neutral $26.00 NA NA 10/24/2013 Keefe, Bruyette & Woods Robert Lee Outperform $26.00 $2.51 $2.75 10/25/2013 Evercore Partners Warren Gardi ner Equalwieght $25.00 $2.39 $2.36 10/24/2013 Oppenhei mer & Co Chri stopher Kotowskim Outperform $25.00 $1.83 $1.99 10/24/2013 BMO Capital Markets David Chiaverni Market Perform $24.00 $2.42 $2.25 10/24/2013 Morgan Stanley Matthew Kell ey Equal Weight $24.00 $2.47 $2.41 10/30/2013 Credit Suisse Howard Chen Neutral $23.00 $2.65 $2.90 10/24/2013 Barclays Roger Freeman Overweight $21.00 NA NA 7/29/2013 Wel ls Fargo Securities Christopher Harris Outperform NA $2.49 $2.53 10/25/2013 Makor Capital Albert Saporta Buy NA NA NA 9/11/2013 JPMorgan Chri stopher Brown Overweight NA NA NA 7/5/2013 |
| Shareholder Base Analyses Top TIGER Institutional Shareholders Top LION Institutional Shareholders(1) TIGER Ownership Breakdown LION Ownership Breakdown 1. LION has 404,744,018 unfloated units Note: Bold indicates overlap in ownership for the top 15 institutional shareholders of each company Source: SNL Financial and FactSet Top 15 Institutional Holders Name Position $ Value % of Ownership Fidelity Management & Research Co. 27,751,828 $269,747,768 13.5% Omega Advisors 14,762,185 $143,488,438 7.2% Thornburg Investment Management 14,603,085 $141,941,986 7.1% OppenheimerFunds 3,550,000 $34,506,000 1.7% Eagle Asset Management 3,126,956 $30,394,012 1.5% Cobalt Capital Management 3,060,885 $29,751,802 1.5% RBC Global Asset Management (US) 2,780,590 $27,027,335 1.4% UBS Securities LLC 2,405,897 $23,385,319 1.2% Lakewood Capital Management LP 2,335,043 $22,696,618 1.1% Deutsche Bank Investment Management 1,966,820 $19,117,490 1.0% Morgan Stanley Investment Management 1,549,825 $15,064,299 0.8% IronBridge Capital Management LP 1,528,364 $14,855,698 0.7% Legg Mason Capital Management LLC 1,382,705 $13,439,893 0.7% Royce & Associates LLC 1,241,780 $12,070,102 0.6% Morgan Stanley Smith Barney LLC 1,239,513 $12,048,066 0.6% Total Institutional Holders 109,882,274 $1,068,055,703 53.6% Top 15 Institutional Holders Name Position $ Value % of Float Fidelity Management & Research Co. 21,924,488 $501,413,041 3.2% Morgan Stanley Investment Management 15,466,419 $353,717,003 2.2% Waddell & Reed Investment Management Co. 15,159,390 $346,695,249 2.2% Credit Suisse Securities 10,552,054 $241,325,475 1.5% ING Investment Management Advisors BV 10,520,000 $240,592,400 1.5% Ariel Investments LLC 7,162,095 $163,797,113 1.0% Deutsche Bank Investment Management 6,087,122 $139,212,480 0.9% Putnam Investment Management LLC 4,398,179 $100,586,354 0.6% GMT Capital Corp. 4,340,200 $99,260,374 0.6% Morgan Stanley Smith Barney LLC 3,559,772 $81,411,986 0.5% Chilton Investment Co. LLC 3,557,030 $81,349,276 0.5% BT Investment Management Ltd. 3,400,721 $77,774,489 0.5% Omega Advisors, Inc. 3,093,665 $70,752,119 0.4% Findlay Park Partners LLP 2,851,276 $65,208,682 0.4% Atherton Lane Advisers LLC 2,675,010 $61,177,479 0.4% Total Institutional Holders 182,971,013 $4,184,547,059 26.4% Total Insider & Unfloated 67.1% Total Institutional 26.2% Implied Retail 6.7% |
| Appendix |

| Appendix: Unconsolidated Balance Sheet Mark to Market Analysis 1. Deconsolidate CLOs (remove all CLO consolidation amounts from balance sheet) 2. Add CLO notes at market value 3. Adjust Oil & Gas investments to fair value 4. Adjust balance sheet holdings from cost to fair value where applicable 5. Adjust other assets to remove capitalized debt costs and adjust debt amounts to Par Value 6. Market value of CLO Notes based on marks from Thompson Reuters 7. Market value of CLO Notes based on liquidation value for deals that can be called; for 2012-1 and 2013-1 the values are based on Thompson Reuters values 8. Market value of CLO Notes based on BWIC winning prices where available; otherwise based on higher values from Thompson Reuters or Liquidation value Source: TIGER Management Analysis (in millions) GAAP Cumulative TR Market Management Recent Value Adj. 1 Adj. 2A Adj. 2B Adj. 2C Adj. 3,4,5 Adjustments Value (6) Liq. Analysis (7) Sales (8) Cash $222.0 - - - - - - $222.0 $222.0 $222.0 Restricted Cash 509.7 (472.5) - - - - (472.5) 37.2 37.2 37.2 CLO Notes - - 1,269.8 1,371.6 1,401.4 - 1,269.8 1,371.6 1,401.4 Securities 519.7 (327.2) - - - - (327.2) 192.5 192.5 192.5 Corporate Loans 6,153.1 (5,780.4) - - - 2.7 (5,777.6) 375.4 375.4 375.4 Equity Investments 191.2 (5.3) - - - - (5.3) 185.9 185.9 185.9 Oil & Gas Properties 372.0 - - - - (9.4) (9.4) 362.6 362.6 362.6 Derivative Assets 35.3 - - - - - - 35.3 35.3 35.3 Interest & Principal Receivable 38.6 (23.7) - - - - (23.7) 14.9 14.9 14.9 Other Assets 430.4 (26.8) - - - (7.3) (34.1) 396.3 396.3 396.3 Total Assets $8,472.0 ($6,635.9) $1,269.8 $1,371.6 $1,401.4 ($13.9) ($6,649.8) $3,092.0 $3,193.8 $3,223.6 CLO Secured Notes 4,903.4 (4,903.4) - - - - (4,903.4) - - - CLO Junior Secured Notes to Affiliates 193.9 (193.9) - - - - (193.9) - - - Credit Facilities 48.5 - - - - - - 48.5 48.5 48.5 Senior Notes 362.3 - - - - 11.5 11.5 373.8 373.8 373.8 Preferred Equity 362.0 - - - - 11.8 11.8 373.8 373.8 373.8 Junior Subordinated Notes 283.5 - - - - - - 283.5 283.5 283.5 Accounts Payable, Accrued Expenses & Other Liabilities 74.8 (5.3) - - - - (5.3) 69.5 69.5 69.5 Accrued Interest Payable 16.5 (10.6) - - - - (10.6) 5.9 5.9 5.9 Accrued Interest Payable to Affiliates 4.1 (4.1) - - - - (4.1) - - - Related Party Payable 3.8 (0.9) - - - - (0.9) 2.9 2.9 2.9 Derivative Liabilities 86.1 (45.7) - - - - (45.7) 40.4 40.4 40.4 Total Liabilities $6,338.9 ($5,163.9) $0.0 $0.0 $0.0 $23.2 ($5,140.6) $1,198.2 $1,198.2 $1,198.2 Equity Allocable to Common Shareholders $2,133.1 $1,893.8 $1,995.5 $2,025.4 Total Shares 204.8 204.8 204.8 204.8 Per Share Value $10.42 $9.25 $9.74 $9.89 |
| Appendix: M&A Perspective: Historical Financial Services Deal Premiums Note: Transactions over $500 million in transaction value in financial services Source: SNL Financial ($ in millions) Announced Transaction Premium Date Buyer Target Value 1 Day Before 5 Days Before 1 Month Before 3 Months Before 9/11/2013 Umpqua Holdings Corp. Sterling Financial Corp. $1,995.1 13.9% 17.5% 16.1% 40.2% 7/22/2013 PacWest Bancorp CapitalSource Inc. 2,381.9 20.1% 20.1% 24.6% 28.5% 7/14/2013 MB Financial Inc. Taylor Capital Group Inc. 658.8 24.6% 24.9% 33.2% 44.5% 5/28/2013 Fidelity National Financial Lender Processing Services 2,835.2 1.4% 12.6% 24.2% 36.2% 4/14/2013 Madison Dearborn Partners LLC National Financial Partners 1,283.8 8.3% 9.0% 26.4% 47.1% 2/19/2013 Total System Services Inc. NetSpend Holdings Inc. 1,375.2 26.1% 42.4% 38.2% 46.9% 1/30/2013 Annaly Capital Mgmt Inc. CreXus Investment Corp. 875.8 4.1% 4.0% 6.1% 16.2% 12/30/2012 Investor group Duff & Phelps Corp. 669.1 19.2% 20.7% 28.1% 14.3% 12/20/2012 IntercontinentalExchange Inc. NYSE Euronext 8,231.3 37.7% 42.9% 45.7% 28.1% 12/18/2012 Markel Corp. Alterra Capital Holdings Ltd. 3,100.2 32.9% 32.7% 39.5% 26.8% 12/11/2012 Trident Private Holdings I LLC TNS Inc. 535.5 44.2% 42.1% 45.4% 35.1% 12/6/2012 Toronto-Dominion Bank Epoch Holding Corp. 668.4 27.8% 26.5% 28.2% 19.2% 11/11/2012 Leucadia National Corp. Jefferies Group Inc. 2,924.2 23.7% 17.0% 24.5% 32.4% 9/25/2012 Columbia Banking System Inc. West Coast Bancorp 508.9 12.0% 13.1% 14.4% 22.8% 9/12/2012 FirstMerit Corp. Citizens Republic Bancorp Inc. 942.9 14.7% 15.5% 15.7% 45.8% 8/30/2012 Validus Holdings Ltd. Flagstone Reinsurance Holdings 622.9 19.4% 22.0% 22.4% 16.3% 8/27/2012 M&T Bank Corp. Hudson City Bancorp Inc. 3,813.2 12.1% 8.3% 19.9% 14.0% 8/19/2012 Aetna Inc. Coventry Health Care Inc. 5,726.4 20.4% 30.3% 30.6% 41.8% 7/9/2012 WellPoint Inc. AMERIGROUP Corp. 4,884.6 43.0% 39.6% 47.2% 43.4% 7/8/2012 Thomson Reuters Corp. FX Alliance Inc. 679.0 40.1% 40.0% 33.2% 43.9% 2/15/2012 Grupo Elektra S.A. de C.V. Advance America Cash Advance 659.1 30.9% 26.4% 28.2% 27.0% 11/20/2011 Alleghany Corp. Transatlantic Holdings Inc. 3,534.6 9.8% 9.6% 15.3% 19.0% 10/24/2011 CIGNA Corp. HealthSpring Inc. 3,824.9 37.0% 40.4% 57.3% 21.5% 10/10/2011 Banco Popular Español SA Banco Pastor SA 1,345.9 30.8% 41.0% 37.1% 35.7% 10/3/2011 ACI Worldwide Inc. S1 Corp. 525.1 4.2% 9.7% 6.7% 27.5% 9/28/2011 Nationwide Mutual Insurance Co Harleysville Group Inc. 815.8 86.5% 138.6% 119.3% 93.9% 5/12/2011 CVC Capital Partners SICAV-FIS Rizal Commercial Banking Corp. 4,959.0 3.4% 6.0% 0.9% 10.1% 4/27/2011 CoStar Group Inc. LoopNet Inc 859.0 30.9% 41.4% 33.8% 77.2% 4/20/2011 Hanover Insurance Group Inc. Chaucer Holdings Plc 503.0 69.2% 69.2% 71.6% 79.1% 3/18/2011 Charles Schwab Corp. optionsXpress Holdings Inc. 1,032.5 20.3% 13.8% 10.0% (12.7%) 1/16/2011 Comerica Inc. Sterling Bancshares Inc. 1,028.9 29.8% 38.4% 53.7% 77.2% 12/21/2010 Hancock Holding Co. Whitney Holding Corp. 1,468.4 46.5% 41.2% 64.6% 79.2% 12/17/2010 BMO Financial Group Marshall & Ilsley Corp. 4,096.0 33.9% 31.4% 56.3% 10.8% Mean $1,967.7 15.0% 18.8% 24.5% 37.3% Median $2,188.5 17.0% 18.8% 24.4% 38.2% |