Exhibit (c)(6)
| November 21, 2013 Presentation to the Transaction Committee Regarding Project WILDCATS |
| GENERAL INFORMATION AND LIMITATIONS This presentation, and the oral or video presentation that supplements it, have been developed by and are proprietary to Sandler O'Neill & Partners, L.P. and were prepared exclusively for the benefit and internal use of the recipient. Neither the printed presentation nor the oral or video presentation that supplements it, nor any of their contents, may be reproduced, distributed or used for any other purpose without the prior written consent of Sandler O'Neill & Partners, L.P. The analyses contained herein rely upon information obtained from the recipient or from public sources, the accuracy of which has not been verified, and cannot be assured, by Sandler O'Neill & Partners, L.P. Moreover, many of the projections and financial analyses herein are based on estimated financial performance prepared by or in consultation with the recipient and are intended only to suggest reasonable ranges of results. Finally, the printed presentation is incomplete without the oral or video presentation that supplements it. Sandler O’Neill & Partners, L.P. prohibits employees from offering, directly or indirectly, favorable research, a specific rating or a specific price target, or offering or threatening to change research, a rating or a price target to a company as consideration or inducement for the receipt of business or compensation. The Firm also prohibits research analysts from being compensated for their involvement in, or based upon, specific investment banking transactions. Sandler O'Neill & Partners, L.P. is a limited partnership, the sole general partner of which is Sandler O'Neill & Partners Corp., a New York corporation. Sandler O'Neill & Partners, L.P. is a registered broker-dealer and a member of the Financial Industry Regulatory Authority. Sandler O'Neill Mortgage Finance L.P. is an indirect subsidiary of Sandler O'Neill & Partners Corp. This material is protected under applicable copyright laws and does not carry any rights of publication or disclosure. SANDLER O’NEILL + PARTNERS |
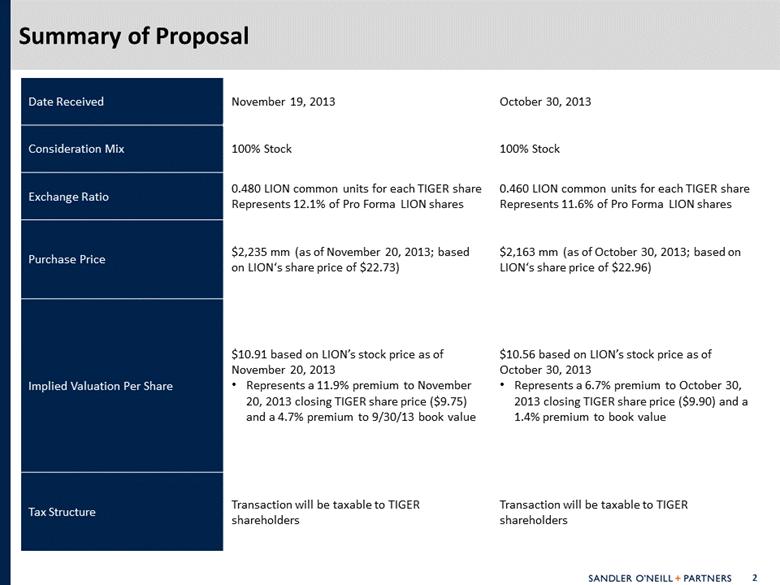
| Date Received November 19, 2013 October 30, 2013 Consideration Mix 100% Stock 100% Stock Exchange Ratio 0.480 LION common units for each TIGER share Represents 12.1% of Pro Forma LION shares 0.460 LION common units for each TIGER share Represents 11.6% of Pro Forma LION shares Purchase Price $2,235 mm (as of November 20, 2013; based on LION‘s share price of $22.73) $2,163 mm (as of October 30, 2013; based on LION‘s share price of $22.96) Implied Valuation Per Share $10.91 based on LION’s stock price as of November 20, 2013 Represents a 11.9% premium to November 20, 2013 closing TIGER share price ($9.75) and a 4.7% premium to 9/30/13 book value $10.56 based on LION’s stock price as of October 30, 2013 Represents a 6.7% premium to October 30, 2013 closing TIGER share price ($9.90) and a 1.4% premium to book value Tax Structure Transaction will be taxable to TIGER shareholders Transaction will be taxable to TIGER shareholders Summary of Proposal |
| Proposal Value 1. TIGER book value is $10.42 as of 9/30/13 0.460 0.480 Exchange Ratio Exchange Ratio Date 10/30/2013 11/20/2013 52 Week High 52 Week Low 10-Day VWAP 20-Day VWAP YTD VWAP LION Share Price $22.96 $22.73 $23.96 $13.35 $22.95 $23.03 $19.56 Implied Purchase Price $10.56 $10.91 $11.50 $6.41 $11.02 $11.05 $9.39 Implied Total Purchase Price ($mm) $2,163 $2,235 $2,356 $1,313 $2,256 $2,264 $1,923 TIGER Share Price $9.90 $9.75 $11.93 $9.40 $9.55 $9.81 $10.68 Premium to TIGER 11/20/13 Price 8.3% 11.9% 18.0% (33.0%) 15.1% 15.5% (1.9%) 10/30/13 Price 6.7% 10.2% 16.2% (35.3%) 11.3% 11.7% (5.2%) 52 Week High (11.5%) (8.5%) (3.6%) (46.3%) (7.7%) (7.3%) (21.3%) 52 Week Low 12.4% 16.1% 22.3% (31.8%) 17.2% 17.6% (0.1%) 10-Day VWAP 10.6% 14.2% 20.4% (32.9%) 15.4% 15.8% (1.7%) 20-Day VWAP 7.7% 11.2% 17.2% (34.7%) 12.3% 12.7% (4.3%) YTD-Day VWAP (1.1%) 2.2% 7.7% (40.0%) 3.1% 3.5% (12.1%) Premium to TIGER Book Value (1) 1.4% 4.7% 10.4% (38.5%) 5.7% 6.1% (9.9%) |
| Summary of Meeting with LION Management and Advisors SOP representatives met with LION CFO, General Counsel and Strategy team as well as LION’s advisor, Goldman Sachs LION explained its rationale for the TIGER transaction and valuation methodology Rationale for LION Increases predictability of LION’s distributable income LION will distribute 100% of TIGER income Further diversifies its balance sheet from traditional PE investments LION intends to keep TIGER as separate subsidiary and will maintain its legal structure LION will redeploy TIGER capital and liquidity over time into higher returning businesses Seed new funds Warehouse investments Capital markets – Merchant Banking initiative Expect positive reaction from the investor community However, LION does expect to be downgraded 1 or possibly 2 notches by rating agencies Increases LION stock liquidity |
| Summary of Meeting with LION Management and Advisors (cont.) LION’s view of rationale for TIGER Reduction in tax inefficiencies for TIGER shareholders Ability to participate in upside of LION stock Per LION management, driven by greater certainty of cash carry realization and improved fund raising for new strategies should lead to potential multiple expansion Participate in more diverse earnings stream Greater liquidity for TIGER shareholders Higher likelihood of stock price appreciation Two TIGER shareholders which also own LION stock contacted LION Management in the last year to suggest to LION to consider a merger with TIGER LION valuation methodology of TIGER Asset value – no franchise value assigned LION advisor is valuing TIGER as a “permanent capital vehicle” to hold specified assets Not an operating business October TIGER strategic plan was not considered No credit given for historical importance of TIGER to development of LION Public Markets business segment LION advisor’s comparable transactions (pg. 14) are primarily REIT acquisitions (pure asset plays) that are based on NAV with limited market premium |
| Review of TIGER Q4 and 2014 Results Source: Company filings and TIGER Management 2013 Provided by TIGER management TIGER’s 2014 and 2015 analyst mean estimated EPS are $1.27 and $1.05, respectively $0.46 $0.39 $0.16 $0.30 $1.31 $1.00 $1.10 Q1 Q2 Q3 Q4E 2013E 2014E |
| Imputed Valuation of TIGER Under Management Scenarios Note: NPV calculated using a discount rate of 8.0%. Rate calculated using a beta of 0.91, a risk free rate of 2.80% and an equity risk premium of 5.70% 1. TIGER Management provided a range of $1.00 to $1.10 for 2014E EPS 2. Source: Management’s Strategic Plan Recommendation in TIGER Strategic Review Presentation for Board of Directors (10/22/13) 3. Management has given guidance that they will maintain a quarterly income distribution of $0.22 per share. However, we assumed that 90% of all earnings per share is paid out order to provide an illustrative valuation analysis Source: SNL Financial TIGER Management Team's View on Future Earnings High Case (1) Low Case (1) Downside Case (2) Base Case (2) Aggressive Case (2) Reference 2014E 2014E 2015E 2015E 2015E TIGER Estimated Earnings $1.10 $1.00 $0.74 $1.22 $1.46 TIGER Income Distributions Assumed at 90% (3) 90.0% $0.99 $0.90 $0.67 $1.10 $1.31 Imputed NPV Per Share Based on BDC Dividend Yields Median 8.8% $11.61 $10.58 $8.13 $12.74 $15.04 Mean 9.0% $11.29 $10.28 $7.93 $12.41 $14.64 Imputed NPV Per Share Based on Projected Senior / Floating BDC Dividend Yields Median 7.7% $13.01 $11.85 $9.02 $14.20 $16.79 Mean 8.8% $11.56 $10.53 $8.12 $12.71 $15.01 Imputed Value Per Share Based on Historical TIGER Valuation (3 Year Period) Median Dividend Yield 7.9% $12.46 $11.33 $8.38 $13.82 $16.53 Mean Dividend Yield 7.8% $12.74 $11.58 $8.57 $14.13 $16.91 Median Price / Book 1.00x $10.45 $10.45 $10.45 $10.45 $10.45 Mean Price / Book 0.99x $10.36 $10.36 $10.36 $10.36 $10.36 |
| Bridge From GAAP Book to Unconsolidated Recent Sales Book Value Source: TIGER Management Analysis $10.42 $9.89 ($7.19) $6.84 ($0.05) ($0.10) ($0.04) $0.00 $2.00 $4.00 $6.00 $8.00 $10.00 $12.00 GAAP Book Value Deconsolidate CLOs -- "GAAP Assumes 100% Ownership" Value CLOs at Recent Sales Value -- (Actual Economic Ownership) Oil & Gas Adj. Corp Debt Adj. Remove Capitalized Debt Costs Unconsolidated Book |
| EPS Accretion / Dilution Based on TIGER Share Buybacks Note: Assumes 7.50% coupon debt is raised to repurchase shares Purchase Price $9.75 $10.00 $10.25 $10.50 $10.91 $100 Million Buyback 2014 Street 1.6% 1.5% 1.3% 1.1% 1.0% 2015 Street 1.9% 1.8% 1.7% 1.4% 1.4% Base Case 2.1% 2.0% 1.8% 1.6% 1.5% Downside Case 0.1% (0.1%) (0.2%) (0.4%) (0.5%) Aggressive Case 2.6% 2.5% 2.4% 2.1% 2.1% Pro Forma Book Value $10.45 $10.44 $10.42 $10.41 $10.39 Increase (Decrease) $0.04 $0.02 $0.01 ($0.00) ($0.02) $200 Million Buyback 2014 Street 3.4% 3.1% 2.8% 2.3% 2.2% 2015 Street 4.1% 3.8% 3.5% 3.0% 2.9% Base Case 4.5% 4.2% 3.9% 3.4% 3.2% Downside Case 0.1% (0.1%) (0.4%) (0.9%) (1.0%) Aggressive Case 5.6% 5.3% 5.0% 4.5% 4.3% Pro Forma Book Value $10.49 $10.46 $10.43 $10.41 $10.37 Increase (Decrease) $0.07 $0.05 $0.02 ($0.01) ($0.05) |
| LION—Summary of Equity Research Source: Bloomberg and FactSet Analyst Recommendations Median Analyst Estimates 10 Analysts (66.7%) 4 Analysts (26.7%) Buy Hold $2.47 $2.39 2013FY 2014FY Firm Analyst Rating Target Price 2013 EPS 2014 EPS Last Updated Sterne, Agee & Leach Jason Weyeneth Buy $28.00 $2.49 $2.57 10/25/2013 Sandler O'Neill Michael Kim Buy $27.00 $2.46 $2.33 10/25/2013 Argus Research Corp David Ritter Buy $26.00 $2.20 $2.37 8/27/2013 Goldman Sachs Marc Irizarry Buy / Neutral $26.00 NA NA 10/24/2013 Keefe, Bruyette & Woods Robert Lee Outperform $26.00 $2.51 $2.75 10/25/2013 Evercore Partners Warren Gardiner Equalwieght $25.00 $2.39 $2.36 10/24/2013 Oppenheimer & Co Christopher Kotowskim Outperform $25.00 $1.83 $1.99 10/24/2013 BMO Capital Markets David Chiaverni Market Perform $24.00 $2.42 $2.25 10/24/2013 Morgan Stanley Matthew Kelley Equal Weight $24.00 $2.47 $2.41 10/30/2013 Credit Suisse Howard Chen Neutral $23.00 $2.65 $2.90 10/24/2013 Barclays Roger Freeman Overweight $21.00 NA NA 7/29/2013 Wells Fargo Securities Christopher Harris Outperform NA $2.49 $2.53 10/25/2013 Makor Capital Albert Saporta Buy NA NA NA 9/11/2013 JPMorgan Christopher Brown Overweight NA NA NA 7/5/2013 |
| Accretion/Dilution Analysis Under Various Scenarios 1. Mean Analyst Estimates for LION (2015 $2.74) and TIGER (2015 TIGER estimate is 2014E multiplied by EPS LTGR) 2. Source: Management’s Strategic Plan Recommendation in TIGER Strategic Review Presentation for Board of Directors (10/22/13) 3. Source: Liquidity Forecast in TIGER Board of Directors Meeting (10/23/13) Source: SNL Financial Management Strategic Plan Cases Current Bid (0.48 Exchange Ratio) Street (1) Base Case (2) Downside Case (2) Aggressive Case (2) 2015 Estimated EPS $1.16 $1.22 $0.74 $1.46 LION Accretion / (Dilution) ($) ($0.03) ($0.02) ($0.14) $0.04 (%) (1.2%) (0.7%) (5.1%) 1.5% TIGER Accretion / (Dilution) ($) $0.14 $0.09 $0.51 ($0.13) (%) 12.1% 7.0% 68.6% (8.6%) 2015 LION Break-Even EPS Analysis Exchange Ratio 0.430x 0.453x 0.276x 0.540x Share Price $9.78 $10.29 $6.27 $12.27 2015 Income Distribution Impact LION New LION Income Distribution $1.63 $1.64 $1.52 $1.70 Accretion / (Dilution) ($) $0.11 $0.12 $0.00 $0.18 (%) 7.1% 8.1% 0.2% 12.1% TIGER New TIGER Income Distribution $0.78 $0.79 $0.73 $0.82 Accretion / (Dilution) ($) ($0.26) ($0.31) $0.06 ($0.50) (%) (25.1%) (28.2%) 9.7% (37.8%) |
| Has / Gets Analysis Management Strategic Plan Cases Base Downside Aggressive Street Case Case Case 2015 EPS TIGER $1.16 $1.22 $0.74 $1.46 With LION $1.30 $1.31 $1.25 $1.33 2015 Income Distribution TIGER $1.04 $1.10 $0.67 $1.31 With LION $0.78 $0.79 $0.73 $0.82 Long-Term Analyst Earnings Growth TIGER 10.0% LION 6.9% One-Year Average Daily Trading Volume ($mm) TIGER $10.1 LION $41.6 One-Year Total Return to Shareholders TIGER 5.1% LION 77.9% |
| Comparison to LION Stand-Alone Equity Raise 1. Assumed to equal current deal value Components of Discounts in Offering Price and Aggregate Dollar Impacts Current Price $22.73 $22.73 $22.73 $22.73 Net Offering Price / Proceeds $20.00 $20.50 $21.00 $21.50 Pricing Discount to Current Price 9.3% 7.0% 4.8% 2.5% Underwriting Fees and Expenses 3.0% 3.0% 3.0% 3.0% Overall Fees & Discounts 12.0% 9.8% 7.6% 5.4% Total Economic Cost of Offering to LION ($ Aggregate) ($305.1) ($243.1) ($184.1) ($127.8) Equivalent Economic Cost per TIGER Share $1.49 $1.19 $0.90 $0.62 Implied Price per TIGER Share Including Book Value $11.91 $11.61 $11.32 $11.04 Assumptions and Inputs Total Target Capital Raise ($mm) (1) $2,234.7 TIGER Shares Outstanding (mm) 204.8 Proposed Deal Value per Share $10.91 TIGER Book Value per Share $10.42 Shares Issued to TIGER in Proposed Merger (mm) 98.3 |
| Overview of Goldman Sachs Preferred Comparable Transactions Source: SNL Financial 1. Represents offer premium to share price 2. Represents offer premium to NAV per share 3. Based on materials prepared by Goldman Sachs 4. Based on materials prepared by Sandler O’Neill 5. Indicates internally managed investment vehicle Date Target Premium on Premium to Premium to Announced Target Type Buyer Type Announcement 1 NAV (GS) 2,3 NAV (SOP) 2,4 % Stock % Cash 10/22/13 Cole Real Estate Investments, Inc. Net Lease American Realty Capital Properties, Inc. REIT 5 13.8% NM 23.0% 81% 19% 09/04/13 Thomas Properties Group, Inc. Office Parkway Properties, Inc. REIT 5 12.0% NM NM 100% 0% 06/03/13 Colonial Properties Trust Apartment Mid-America Apartment Communities, Inc. REIT 5 0.7% NM (8.4)% 100% 0% 05/28/13 CapLease, Inc. Net Lease American Realty Capital Properties, Inc. REIT 5 19.7% NM 16.9% 0% 100% 01/30/13 CreXus Investment Corp. Mortgage Annaly Capital Management, Inc. REIT 5 17.1% NM NM 0% 100% 09/06/12 American Realty Capital Trust, Inc. Net Lease Realty Income Corporation REIT 5 2.2% NM 13.3% 97% 3% 07/02/12 Conversus Capital PE Interests HarbourVest Partners PE PCV 5.0% (18.7)% (18.7)% >50.1% <49.9% 12/24/11 Cogdell Spencer Inc. Healthcare / Medical Office Ventas, Inc. REIT 5 8.4% NM (20.0)% 0% 100% 04/21/11 Absolute Private Equity PE Fund of Funds HarbourVest Partners PE PCV 1.5% (28.6)% (28.6)% 0% 100% 02/27/11 Nationwide Health Properties, Inc. Healthcare Ventas, Inc. REIT 5 15.5% NM 56.3% 100% 0% 01/30/11 ProLogis Industrial AMB Property Corporation REIT 5 (0.2)% NM NM 100% 0% Median 8.4% (23.7)% 2.5% Mean 8.7% (23.7)% 4.2% |
| An examination of selected1 affiliated party financial services transactions indicated the following: The final offer price is a market premium in excess of 20% to the initial share price before offer The final offer is most often at a premium in excess of 10% to the initial offer The buyer typically submits 3-5 bids before agreeing to price with the seller In several cases the seller announced the existence of an offer to the public during the negotiating process M&A Perspective: Recent Affiliated-Party Financial Services Transactions Observations 1. Transactions involving U.S. based publicly-traded targets in the financial services industry with deal values between $500 million and $5 billion since January 1, 2007 where acquirer owned at least 10% of target pre –transaction and acquired 100% of the remaining stock 2. Includes special dividend Source: SNL Financial, Thompson IB, SEC filings Annc. Date Buyer Target Deal Value ($ mm) Stock Price Before Initial Offer or Rumor Initial Offer1 Final Offer Total Rounds of Offers Initial Premium to Initial Stock Price Final Premium to Initial Stock Price Increase to Initial Offer 11/12/2012 Annaly Capital Management Inc CreXus Investment Corp $876 $11.10 $12.50 $13.05 4 12.6% 17.6% (2) 4.4% 11/12/2012 Leucadia National Corp Jefferies Group Inc $2,924 $14.27 $16.46 $17.66 2 15.4% 23.7% 7.3% 10/13/2008 Banco Santander SA Sovereign Bancorp Inc $1,910 $3.81 $3.81 $3.81 1 0.0% 0.0% 0.0% 08/12/2008 Bank of Tokyo-Mitsubishi UFJ Ltd UnionBanCal Corp,CA $3,808 $53.02 $58.00 $73.50 3 9.4% 38.6% 26.7% 03/10/2008 Nationwide Mutual Insurance Co Nationwide Finl Svcs Inc $2,471 $40.00 $47.20 $52.25 3 18.0% 30.6% 10.7% 07/17/2007 Alfa Mutual Alfa Corp $833 $15.20 $17.60 $22.00 5 15.8% 44.7% 25.0% 11/20/2006 Toronto-Dominion Bank TD Banknorth Inc $3,201 $28.81 $32-34 $32.33 6 14.5% 12.2% (2.0%) Mean 3.4 12.2% 23.9% 10.3% Median 3.0 14.5% 23.7% 7.3% |
| LION acquired PANTHER via a reverse merger in October of 2009 PANTHER unit holders received a 30% interest in the combined entity Transaction was originally announced in July of 2008 and was twice revised to give PANTHER’s unit holders better economics Initial offer was for 21% ownership interest Offer was subsequently revised to 27% ownership interest Ultimately, the final transaction offered a 30% ownership interest LION subsequently delisted from Euronext Amsterdam and listed on NYSE in the United States LION’s principals did not sell any equity or receive any distributions in this series of transactions LION principals and public unit holders own substantially the same type of interest in LION LION acquired PANTHER’s balance sheet with approximately $3 billion in net assets Case Study: LION Merger with PEI Entity |
| Appendix |

| Unconsolidated Balance Sheet Mark to Market Analysis 1. Deconsolidate CLOs (remove all CLO consolidation amounts from balance sheet) 2. Add CLO notes at market value 3. Adjust Oil & Gas investments to fair value 4. Adjust balance sheet holdings from cost to fair value where applicable 5. Adjust other assets to remove capitalized debt costs and adjust debt amounts to Par Value 6. Market value of CLO Notes based on marks from Thompson Reuters 7. Market value of CLO Notes based on liquidation value for deals that can be called; for 2012-1 and 2013-1 the values are based on Thompson Reuters values 8. Market value of CLO Notes based on BWIC winning prices where available; otherwise based on higher values from Thompson Reuters or Liquidation value Source: TIGER Management Analysis (in millions) GAAP Cumulative TR Market Management Recent Value Adj. 1 Adj. 2A Adj. 2B Adj. 2C Adj. 3,4,5 Adjustments Value (6) Liq. Analysis (7) Sales (8) Cash $222.0 - - - - - - $222.0 $222.0 $222.0 Restricted Cash 509.7 (472.5) - - - - (472.5) 37.2 37.2 37.2 CLO Notes - - 1,269.8 1,371.6 1,401.4 - 1,269.8 1,371.6 1,401.4 Securities 519.7 (327.2) - - - - (327.2) 192.5 192.5 192.5 Corporate Loans 6,153.1 (5,780.4) - - - 2.7 (5,777.6) 375.4 375.4 375.4 Equity Investments 191.2 (5.3) - - - - (5.3) 185.9 185.9 185.9 Oil & Gas Properties 372.0 - - - - (9.4) (9.4) 362.6 362.6 362.6 Derivative Assets 35.3 - - - - - - 35.3 35.3 35.3 Interest & Principal Receivable 38.6 (23.7) - - - - (23.7) 14.9 14.9 14.9 Other Assets 430.4 (26.8) - - - (7.3) (34.1) 396.3 396.3 396.3 Total Assets $8,472.0 ($6,635.9) $1,269.8 $1,371.6 $1,401.4 ($13.9) ($6,649.8) $3,092.0 $3,193.8 $3,223.6 CLO Secured Notes 4,903.4 (4,903.4) - - - - (4,903.4) - - - CLO Junior Secured Notes to Affiliates 193.9 (193.9) - - - - (193.9) - - - Credit Facilities 48.5 - - - - - - 48.5 48.5 48.5 Senior Notes 362.3 - - - - 11.5 11.5 373.8 373.8 373.8 Preferred Equity 362.0 - - - - 11.8 11.8 373.8 373.8 373.8 Junior Subordinated Notes 283.5 - - - - - - 283.5 283.5 283.5 Accounts Payable, Accrued Expenses & Other Liabilities 74.8 (5.3) - - - - (5.3) 69.5 69.5 69.5 Accrued Interest Payable 16.5 (10.6) - - - - (10.6) 5.9 5.9 5.9 Accrued Interest Payable to Affiliates 4.1 (4.1) - - - - (4.1) - - - Related Party Payable 3.8 (0.9) - - - - (0.9) 2.9 2.9 2.9 Derivative Liabilities 86.1 (45.7) - - - - (45.7) 40.4 40.4 40.4 Total Liabilities $6,338.9 ($5,163.9) $0.0 $0.0 $0.0 $23.2 ($5,140.6) $1,198.2 $1,198.2 $1,198.2 Equity Allocable to Common Shareholders $2,133.1 $1,893.8 $1,995.5 $2,025.4 Total Shares 204.8 204.8 204.8 204.8 Per Share Value $10.42 $9.25 $9.74 $9.89 |
| Comparable Group Analysis for TIGER Note: Financial data as of MQR and LTM for ROE; pricing data as of November 20, 2013 1. Dividend yield computed as most recent quarterly dividend annualized divided by closing share price 2. Compass Point estimates are excluded Source: SNL Financial Dollar values in millions except share price Valuation Price/ Total Return 2013 2014 2015 Current Share Market Total LTM Est. Est. Est. Dividend Three One Price Cap Assets ROE NAV EPS EPS EPS Yield (1) Month Year Company Ticker ($) ($mm) ($mm) (%) (x) (x) (x) (x) (%) (%) (%) Business Development Companies Ares Capital Corporation ARCC 17.96 5,051 7,754 12.9 1.10 11.0 10.9 10.0 8.5 5.1 12.6 Prospect Capital Corporation PSEC 11.34 3,223 4,784 10.2 1.06 8.9 9.0 9.4 11.7 5.5 21.0 Apollo Investment Corporation AINV 8.85 1,989 3,140 8.0 1.07 10.1 10.2 9.1 9.0 13.6 22.1 Fifth Street Finance Corp. FSC 10.14 1,409 1,897 10.2 1.02 9.5 9.0 8.3 11.3 (0.1) 8.9 Main Street Capital Corporation MAIN 31.03 1,233 1,239 15.3 1.55 15.4 13.7 NA 6.4 7.7 12.9 Hercules Technology Growth Capital, Inc. HTGC 16.76 1,035 1,228 17.2 1.61 13.7 12.9 11.6 7.4 15.1 73.5 Solar Capital Ltd. SLRC 22.43 993 1,256 7.2 1.01 11.9 12.8 12.3 7.1 4.0 9.1 Triangle Capital Corporation TCAP 28.68 794 807 18.5 1.80 12.7 12.4 NA 7.5 (1.0) 25.0 Golub Capital BDC, Inc. GBDC 18.25 789 1,016 9.6 1.21 13.7 13.4 11.6 7.0 7.3 27.4 PennantPark Investment Corporation PNNT 11.43 761 1,153 13.3 1.09 11.1 10.0 NA 9.8 4.5 24.1 Blackrock Kelso Capital Corporation BKCC 9.49 706 1,194 9.1 1.01 10.7 9.8 10.1 11.0 (2.4) 7.3 New Mountain Finance Corporation NMFC 14.56 658 548 12.5 1.02 9.5 10.7 NA 9.3 1.8 10.5 Medley Capital Corporation MCC 14.12 567 725 9.5 1.12 9.4 9.1 8.6 10.5 5.3 13.5 THL Credit, Inc. TCRD 16.42 557 598 10.7 1.23 11.4 11.4 10.6 8.3 10.5 30.2 TICC Capital Corp. TICC 10.40 555 1,022 12.6 1.05 9.9 9.2 8.8 11.2 11.0 23.4 TCP Capital Corp. TCPC 17.05 529 729 9.0 1.13 10.5 10.3 NA 8.4 14.7 25.3 Median 15.49 791 1,173 10.5 1.09 10.8 10.5 10.0 8.8 5.4 21.6 Mean 16.10 1,471 2,080 11.5 1.17 11.6 11.1 10.3 9.0 7.0 21.9 Business Development Companies - Senior / Floating Funds Solar Senior Capital Ltd. SUNS 18.37 212 286 4.0 1.03 15.6 13.7 12.7 7.7 3.8 14.9 PennantPark Floating Rate Capital PFLT 13.84 206 329 9.0 0.98 12.2 12.0 NA 7.8 6.9 17.1 Oxford Lane Capital Corporation OXLC 15.86 121 146 9.5 0.98 14.0 14.0 NA 13.9 2.9 15.4 Fifth Street Senior Floating Rate Corp. FSFR 13.54 90 100 NA 0.90 42.3 12.5 NA 5.9 (2.2) (2.2) Median 14.85 164 216 9.0 0.98 14.8 13.1 12.7 7.7 3.3 15.2 Mean 15.40 157 215 7.5 0.97 21.0 13.1 12.7 8.8 2.9 11.3 TIGER TIGER 9.75 1,997 8,472 13.5 0.94 7.7 (2) 9.3 (2) 8.4 9.0 (4.5) 5.2 |