Exhibit (c)(8)
| November 27, 2013 Presentation to the Transaction Committee Regarding Project WILDCATS Strictly Private & Confidential SANDLER O’NEILL + PARTNERS, L.P. |
| GENERAL INFORMATION AND LIMITATIONS This presentation, and the oral or video presentation that supplements it, have been developed by and are proprietary to Sandler O'Neill & Partners, L.P. and were prepared exclusively for the benefit and internal use of the recipient. Neither the printed presentation nor the oral or video presentation that supplements it, nor any of their contents, may be reproduced, distributed or used for any other purpose without the prior written consent of Sandler O'Neill & Partners, L.P. The analyses contained herein rely upon information obtained from the recipient or from public sources, the accuracy of which has not been verified, and cannot be assured, by Sandler O'Neill & Partners, L.P. Moreover, many of the projections and financial analyses herein are based on estimated financial performance prepared by or in consultation with the recipient and are intended only to suggest reasonable ranges of results. Finally, the printed presentation is incomplete without the oral or video presentation that supplements it. Sandler O’Neill & Partners, L.P. prohibits employees from offering, directly or indirectly, favorable research, a specific rating or a specific price target, or offering or threatening to change research, a rating or a price target to a company as consideration or inducement for the receipt of business or compensation. The Firm also prohibits research analysts from being compensated for their involvement in, or based upon, specific investment banking transactions. Sandler O'Neill & Partners, L.P. is a limited partnership, the sole general partner of which is Sandler O'Neill & Partners Corp., a New York corporation. Sandler O'Neill & Partners, L.P. is a registered broker-dealer and a member of the Financial Industry Regulatory Authority. Sandler O'Neill Mortgage Finance L.P. is an indirect subsidiary of Sandler O'Neill & Partners Corp. This material is protected under applicable copyright laws and does not carry any rights of publication or disclosure. SANDLER O’NEILL + PARTNERS |
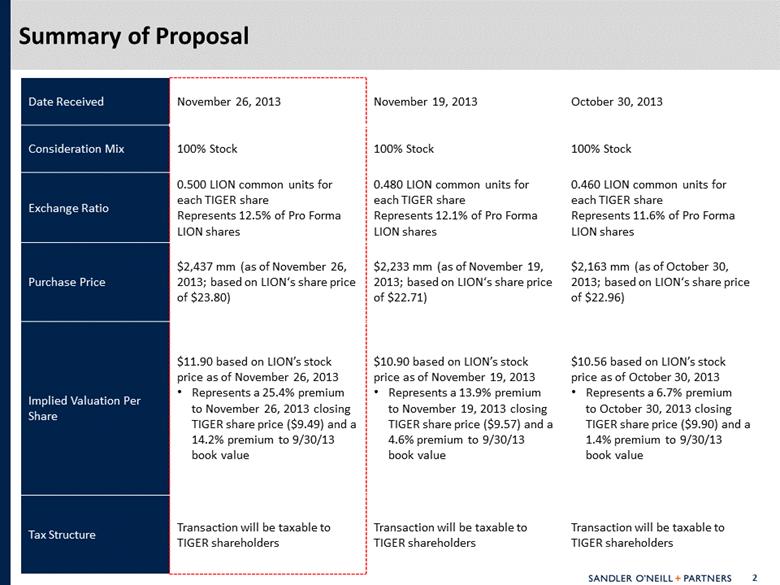
| Date Received November 26, 2013 November 19, 2013 October 30, 2013 Consideration Mix 100% Stock 100% Stock 100% Stock Exchange Ratio 0.500 LION common units for each TIGER share Represents 12.5% of Pro Forma LION shares 0.480 LION common units for each TIGER share Represents 12.1% of Pro Forma LION shares 0.460 LION common units for each TIGER share Represents 11.6% of Pro Forma LION shares Purchase Price $2,437 mm (as of November 26, 2013; based on LION‘s share price of $23.80) $2,233 mm (as of November 19, 2013; based on LION‘s share price of $22.71) $2,163 mm (as of October 30, 2013; based on LION‘s share price of $22.96) Implied Valuation Per Share $11.90 based on LION’s stock price as of November 26, 2013 Represents a 25.4% premium to November 26, 2013 closing TIGER share price ($9.49) and a 14.2% premium to 9/30/13 book value $10.90 based on LION’s stock price as of November 19, 2013 Represents a 13.9% premium to November 19, 2013 closing TIGER share price ($9.57) and a 4.6% premium to 9/30/13 book value $10.56 based on LION’s stock price as of October 30, 2013 Represents a 6.7% premium to October 30, 2013 closing TIGER share price ($9.90) and a 1.4% premium to 9/30/13 book value Tax Structure Transaction will be taxable to TIGER shareholders Transaction will be taxable to TIGER shareholders Transaction will be taxable to TIGER shareholders Summary of Proposal |
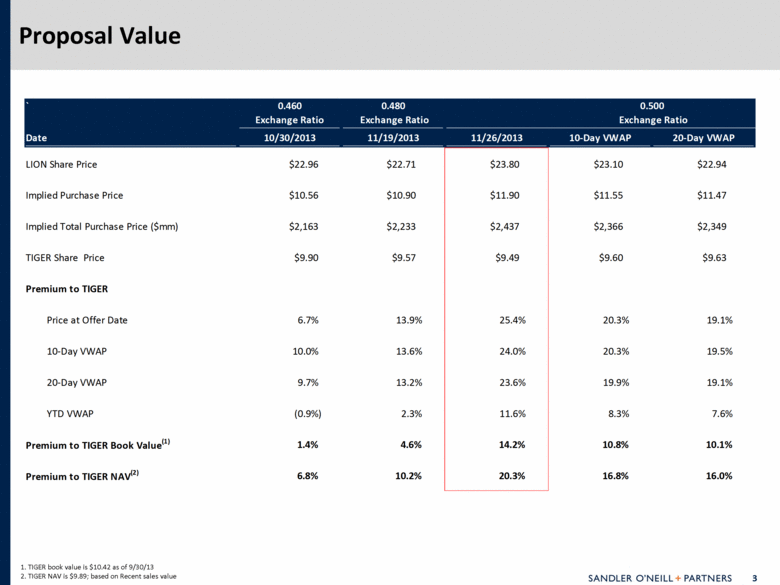
| Proposal Value 1. TIGER book value is $10.42 as of 9/30/13 2. TIGER NAV is $9.89; based on Recent sales value ` 0.460 0.480 0.500 Exchange Ratio Exchange Ratio Exchange Ratio Date 10/30/2013 11/19/2013 11/26/2013 10-Day VWAP 20-Day VWAP LION Share Price $22.96 $22.71 $23.80 $23.10 $22.94 Implied Purchase Price $10.56 $10.90 $11.90 $11.55 $11.47 Implied Total Purchase Price ($mm) $2,163 $2,233 $2,437 $2,366 $2,349 TIGER Share Price $9.90 $9.57 $9.49 $9.60 $9.63 Premium to TIGER Price at Offer Date 6.7% 13.9% 25.4% 20.3% 19.1% 10-Day VWAP 10.0% 13.6% 24.0% 20.3% 19.5% 20-Day VWAP 9.7% 13.2% 23.6% 19.9% 19.1% YTD VWAP (0.9%) 2.3% 11.6% 8.3% 7.6% Premium to TIGER Book Value (1) 1.4% 4.6% 14.2% 10.8% 10.1% Premium to TIGER NAV (2) 6.8% 10.2% 20.3% 16.8% 16.0% |
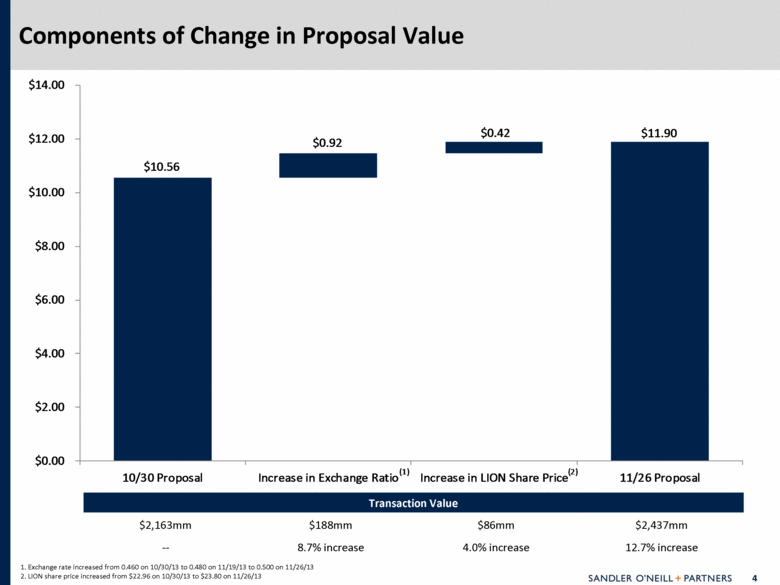
| Components of Change in Proposal Value 1. Exchange rate increased from 0.460 on 10/30/13 to 0.480 on 11/19/13 to 0.500 on 11/26/13 2. LION share price increased from $22.96 on 10/30/13 to $23.80 on 11/26/13 Transaction Value $2,163mm $188mm $86mm $2,437mm -- 8.7% increase 4.0% increase 12.7% increase $10.56 $0.92 $0.42 $11.90 $0.00 $2.00 $4.00 $6.00 $8.00 $10.00 $12.00 $14.00 10/30 Proposal Increase in Exchange Ratio Increase in LION Share Price 11/26 Proposal (1) (2) |
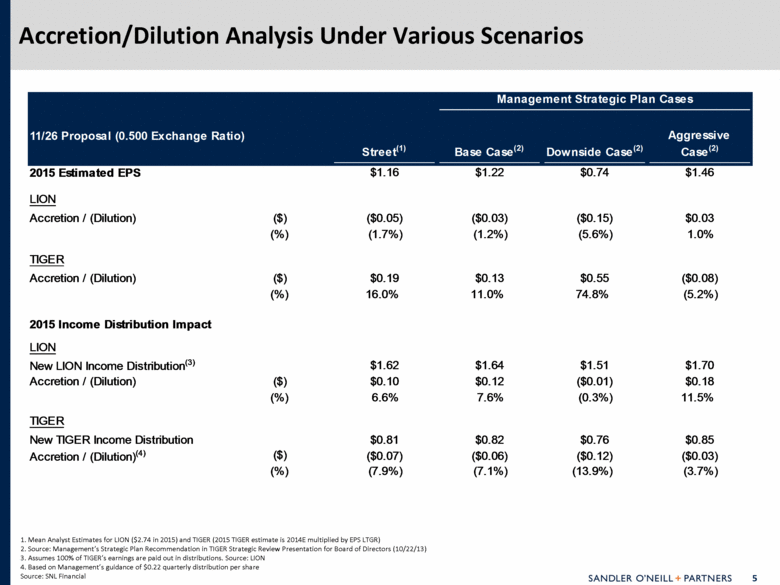
| Accretion/Dilution Analysis Under Various Scenarios 1. Mean Analyst Estimates for LION ($2.74 in 2015) and TIGER (2015 TIGER estimate is 2014E multiplied by EPS LTGR) 2. Source: Management’s Strategic Plan Recommendation in TIGER Strategic Review Presentation for Board of Directors (10/22/13) 3. Assumes 100% of TIGER’s earnings are paid out in distributions. Source: LION 4. Based on Management’s guidance of $0.22 quarterly distribution per share Source: SNL Financial Management Strategic Plan Cases 11/26 Proposal (0.500 Exchange Ratio) Street (1) Base Case (2) Downside Case (2) Aggressive Case (2) 2015 Estimated EPS $1.16 $1.22 $0.74 $1.46 LION Accretion / (Dilution) ($) ($0.05) ($0.03) ($0.15) $0.03 (%) (1.7%) (1.2%) (5.6%) 1.0% TIGER Accretion / (Dilution) ($) $0.19 $0.13 $0.55 ($0.08) (%) 16.0% 11.0% 74.8% (5.2%) 2015 Income Distribution Impact LION New LION Income Distribution (3) $1.62 $1.64 $1.51 $1.70 Accretion / (Dilution) ($) $0.10 $0.12 ($0.01) $0.18 (%) 6.6% 7.6% (0.3%) 11.5% TIGER New TIGER Income Distribution $0.81 $0.82 $0.76 $0.85 Accretion / (Dilution) (4) ($) ($0.07) ($0.06) ($0.12) ($0.03) (%) (7.9%) (7.1%) (13.9%) (3.7%) |
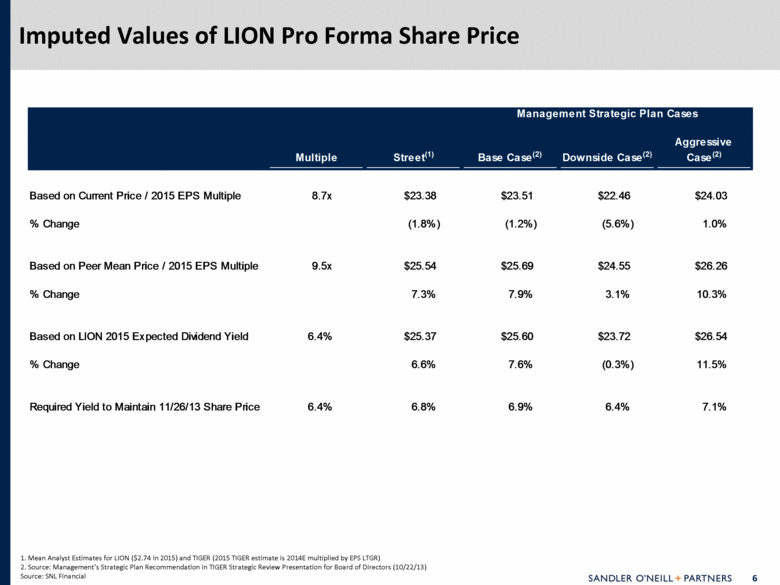
| Imputed Values of LION Pro Forma Share Price 1. Mean Analyst Estimates for LION ($2.74 in 2015) and TIGER (2015 TIGER estimate is 2014E multiplied by EPS LTGR) 2. Source: Management’s Strategic Plan Recommendation in TIGER Strategic Review Presentation for Board of Directors (10/22/13) Source: SNL Financial Management Strategic Plan Cases Multiple Street (1) Base Case (2) Downside Case (2) Aggressive Case (2) Based on Current Price / 2015 EPS Multiple 8.7x $23.38 $23.51 $22.46 $24.03 % Change (1.8%) (1.2%) (5.6%) 1.0% Based on Peer Mean Price / 2015 EPS Multiple 9.5x $25.54 $25.69 $24.55 $26.26 % Change 7.3% 7.9% 3.1% 10.3% Based on LION 2015 Expected Dividend Yield 6.4% $25.37 $25.60 $23.72 $26.54 % Change 6.6% 7.6% (0.3%) 11.5% Required Yield to Maintain 11/26/13 Share Price 6.4% 6.8% 6.9% 6.4% 7.1% |
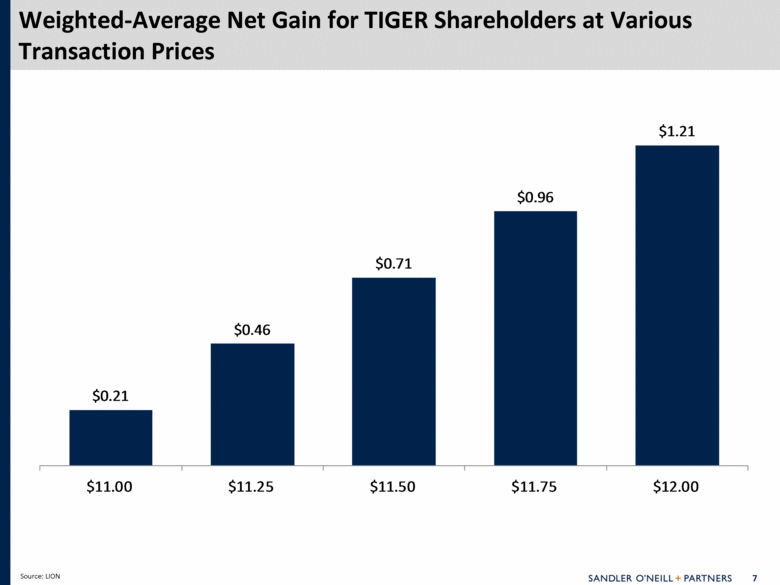
| Weighted-Average Net Gain for TIGER Shareholders at Various Transaction Prices Source: LION $0.21 $0.46 $0.71 $0.96 $1.21 $11.00 $11.25 $11.50 $11.75 $12.00 |
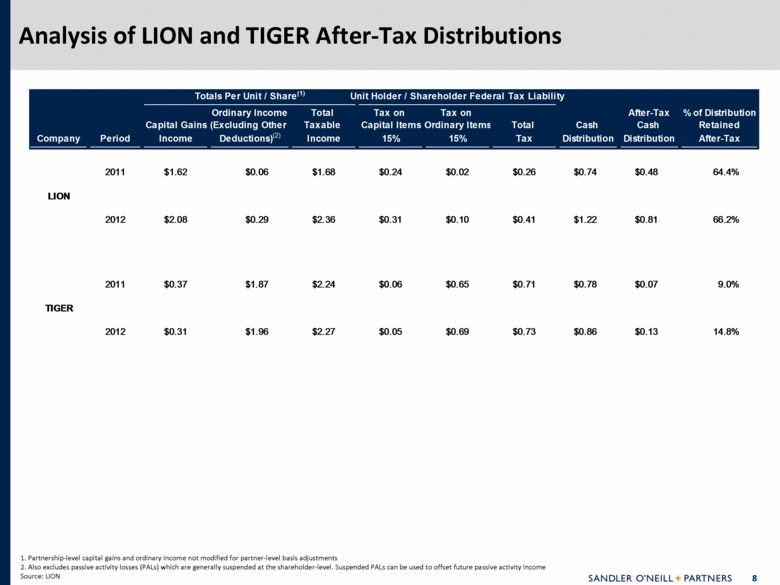
| Analysis of LION and TIGER After-Tax Distributions 1. Partnership-level capital gains and ordinary income not modified for partner-level basis adjustments 2. Also excludes passive activity losses (PALs) which are generally suspended at the shareholder-level. Suspended PALs can be used to offset future passive activity income Source: LION Totals Per Unit / Share (1) Unit Holder / Shareholder Federal Tax Liability Ordinary Income Total Tax on Tax on After-Tax % of Distribution Capital Gains (Excluding Other Taxable Capital Items Ordinary Items Total Cash Cash Retained Company Period Income Deductions) (2) Income 15% 15% Tax Distribution Distribution After-Tax 2011 $1.62 $0.06 $1.68 $0.24 $0.02 $0.26 $0.74 $0.48 64.4% 2012 $2.08 $0.29 $2.36 $0.31 $0.10 $0.41 $1.22 $0.81 66.2% 2011 $0.37 $1.87 $2.24 $0.06 $0.65 $0.71 $0.78 $0.07 9.0% 2012 $0.31 $1.96 $2.27 $0.05 $0.69 $0.73 $0.86 $0.13 14.8% TIGER LION |
| Appendix |

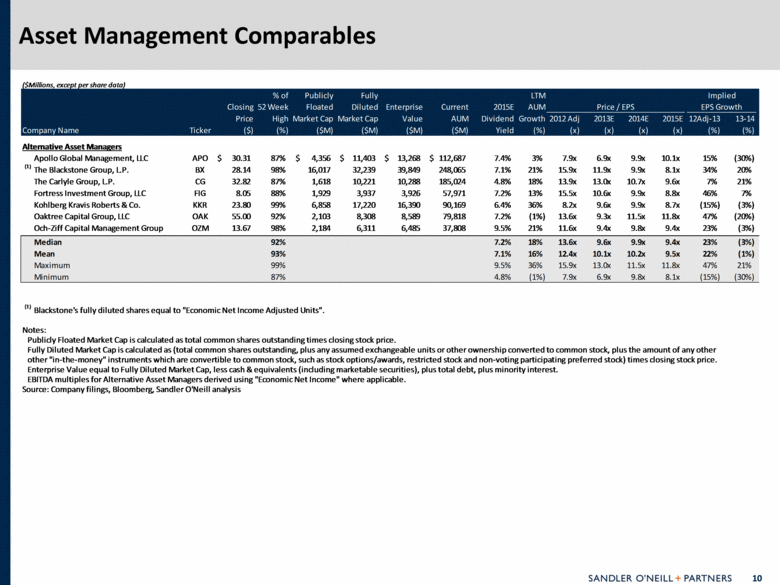
| Asset Management Comparables ($Millions, except per share data) % of Publicly Fully LTM Implied Closing 52 Week Floated Diluted Enterprise Current 2015E AUM Price / EPS EPS Growth Price High Market Cap Market Cap Value AUM Dividend Growth 2012 Adj 2013E 2014E 2015E 12Adj-13 13-14 Company Name Ticker ($) (%) ($M) ($M) ($M) ($M) Yield (%) (x) (x) (x) (x) (%) (%) Alternative Asset Managers Apollo Global Management, LLC APO 30.31 $ 87% 4,356 $ 11,403 $ 13,268 $ 112,687 $ 7.4% 3% 7.9x 6.9x 9.9x 10.1x 15% (30%) (1) The Blackstone Group, L.P. BX 28.14 98% 16,017 32,239 39,849 248,065 7.1% 21% 15.9x 11.9x 9.9x 8.1x 34% 20% The Carlyle Group, L.P. CG 32.82 87% 1,618 10,221 10,288 185,024 4.8% 18% 13.9x 13.0x 10.7x 9.6x 7% 21% Fortress Investment Group, LLC FIG 8.05 88% 1,929 3,937 3,926 57,971 7.2% 13% 15.5x 10.6x 9.9x 8.8x 46% 7% Kohlberg Kravis Roberts & Co. KKR 23.80 99% 6,858 17,220 16,390 90,169 6.4% 36% 8.2x 9.6x 9.9x 8.7x (15%) (3%) Oaktree Capital Group, LLC OAK 55.00 92% 2,103 8,308 8,589 79,818 7.2% (1%) 13.6x 9.3x 11.5x 11.8x 47% (20%) Och-Ziff Capital Management Group OZM 13.67 98% 2,184 6,311 6,485 37,808 9.5% 21% 11.6x 9.4x 9.8x 9.4x 23% (3%) Median 92% 7.2% 18% 13.6x 9.6x 9.9x 9.4x 23% (3%) Mean 93% 7.1% 16% 12.4x 10.1x 10.2x 9.5x 22% (1%) Maximum 99% 9.5% 36% 15.9x 13.0x 11.5x 11.8x 47% 21% Minimum 87% 4.8% (1%) 7.9x 6.9x 9.8x 8.1x (15%) (30%) (1) Blackstone's fully diluted shares equal to "Economic Net Income Adjusted Units". Notes: Publicly Floated Market Cap is calculated as total common shares outstanding times closing stock price. Fully Diluted Market Cap is calculated as (total common shares outstanding, plus any assumed exchangeable units or other ownership converted to common stock, plus the amount of any other other "in-the-money" instruments which are convertible to common stock, such as stock options/awards, restricted stock and non-voting participating preferred stock) times closing stock price. Enterprise Value equal to Fully Diluted Market Cap, less cash & equivalents (including marketable securities), plus total debt, plus minority interest. EBITDA multiples for Alternative Asset Managers derived using "Economic Net Income" where applicable. Source: Company filings, Bloomberg, Sandler O'Neill analysis |