Exhibit (c)(11)

PRELIMINARY CONFIDENTIAL DRAFT Subject to Further Review & Revision
Project Rushmore Presentation Materials to UGI
February 19th, 2019
NEGOTIATING DECK
Materials contain selected analyses, portions of analyses and associated commentary to consider utilizing in negotiations with UGI and advocating for increased value for APU unitholders. Factors that may be important to the
Committee’s overall consideration of a transaction may not be included.
TUDORPICKERING HOLT & CO ENERGY INVESTMENT & MERCHANT BANKING
PRELIMINARY CONFIDENTIAL DRAFT
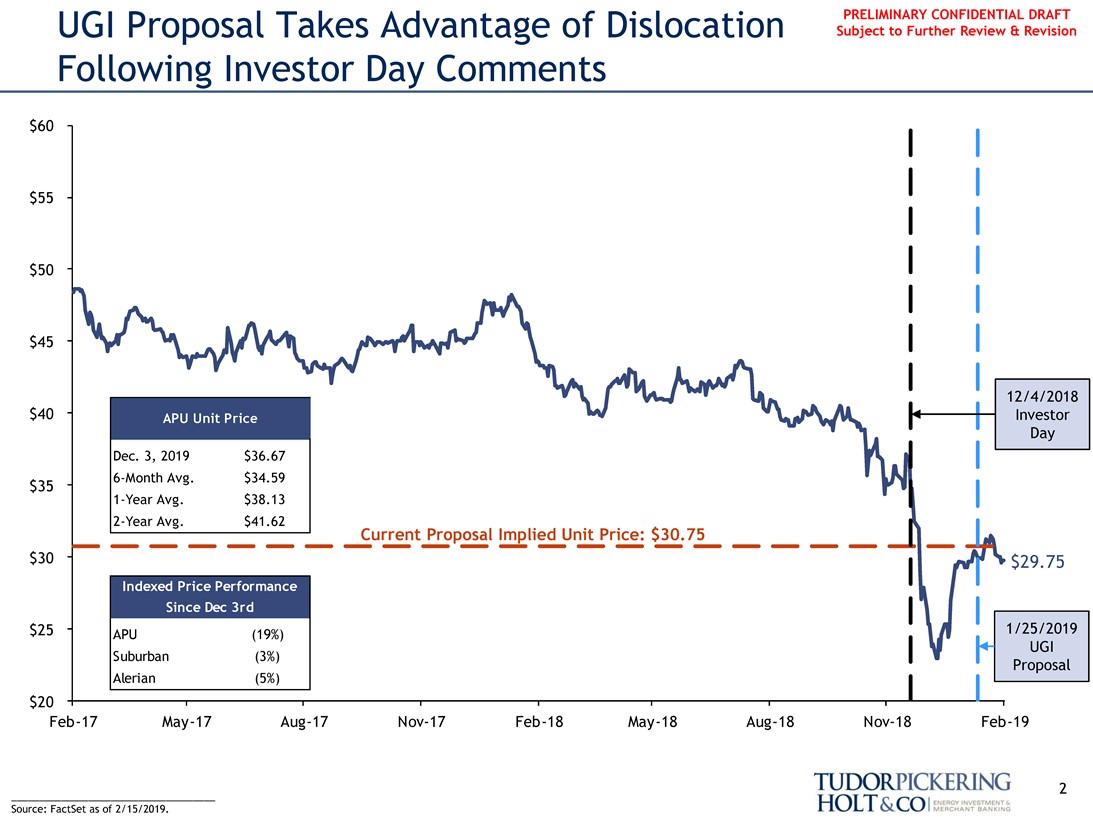
UGI Proposal Takes Advantage of Dislocation Subject to Further Review & Revision Following Investor Day Comments
$60 $55 $50
$45
12/4/2018
$40 Investor Day
APU Unit Price
Dec. 3, 2019 $36.676-Month Avg. $34.59
$351-Year Avg. $38.132-Year Avg. $41.62
Current Proposal Implied Unit Price: $30.75
$30 $29.75
Indexed Price Performance Since Dec 3rd
$25 APU (19%) 1/25/2019 UGI
Suburban (3%)
Alerian (5%) Proposal $20
Feb-17May-17Aug-17Nov-17Feb-18May-18Aug-18Nov-18Feb-19
2
Source: FactSet as of 2/15/2019.
TUDORPICKERING HOLT & CO ENERGY INVESTMENT & MERCHANT BANKING
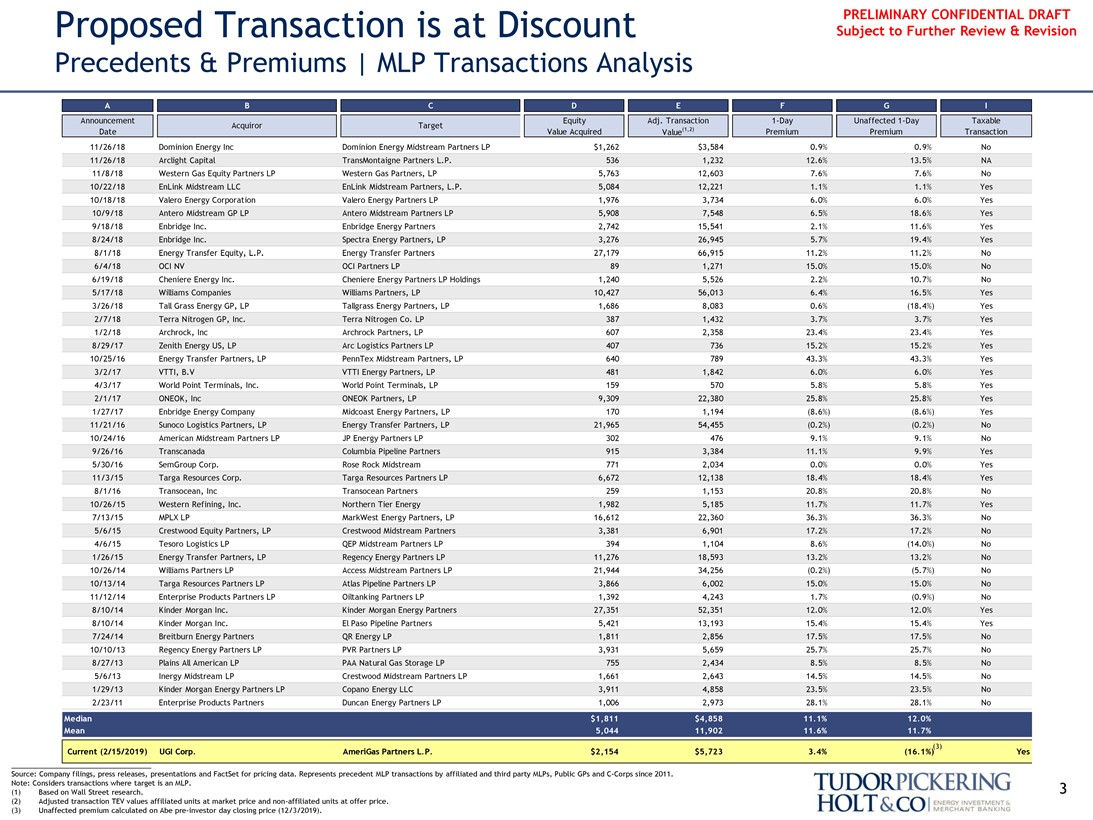
PRELIMINARY CONFIDENTIAL DRAFT Proposed Transaction is at Discount Subject to Further Review & Revision
Precedents & Premiums | MLP Transactions Analysis
A B C D E F G I
Announcement Equity Adj. Transaction1-Day Unaffected1-Day Taxable Acquiror Target Date Value Acquired Value(1,2) Premium Premium Transaction 11/26/18 Dominion Energy Inc Dominion Energy Midstream Partners LP $1,262 $3,584 0.9% 0.9% No 11/26/18 Arclight Capital TransMontaigne Partners L.P. 536 1,232 12.6% 13.5% NA
11/8/18 Western Gas Equity Partners LP Western Gas Partners, LP 5,763 12,603 7.6% 7.6% No 10/22/18 EnLink Midstream LLC EnLink Midstream Partners, L.P. 5,084 12,221 1.1% 1.1% Yes 10/18/18 Valero Energy Corporation Valero Energy Partners LP 1,976 3,734 6.0% 6.0% Yes 10/9/18 Antero Midstream GP LP Antero Midstream Partners LP 5,908 7,548 6.5% 18.6% Yes 9/18/18 Enbridge Inc. Enbridge Energy Partners 2,742 15,541 2.1% 11.6% Yes 8/24/18 Enbridge Inc. Spectra Energy Partners, LP 3,276 26,945 5.7% 19.4% Yes 8/1/18 Energy Transfer Equity, L.P. Energy Transfer Partners 27,179 66,915 11.2% 11.2% No 6/4/18 OCI NV OCI Partners LP 89 1,271 15.0% 15.0% No 6/19/18 Cheniere Energy Inc. Cheniere Energy Partners LP Holdings 1,240 5,526 2.2% 10.7% No 5/17/18 Williams Companies Williams Partners, LP 10,427 56,013 6.4% 16.5% Yes 3/26/18 Tall Grass Energy GP, LP Tallgrass Energy Partners, LP 1,686 8,083 0.6% (18.4%) Yes 2/7/18 Terra Nitrogen GP, Inc. Terra Nitrogen Co. LP 387 1,432 3.7% 3.7% Yes 1/2/18 Archrock, Inc Archrock Partners, LP 607 2,358 23.4% 23.4% Yes 8/29/17 Zenith Energy US, LP Arc Logistics Partners LP 407 736 15.2% 15.2% Yes 10/25/16 Energy Transfer Partners, LP PennTex Midstream Partners, LP 640 789 43.3% 43.3% Yes 3/2/17 VTTI, B.V VTTI Energy Partners, LP 481 1,842 6.0% 6.0% Yes 4/3/17 World Point Terminals, Inc. World Point Terminals, LP 159 570 5.8% 5.8% Yes 2/1/17 ONEOK, Inc ONEOK Partners, LP 9,309 22,380 25.8% 25.8% Yes 1/27/17 Enbridge Energy Company Midcoast Energy Partners, LP 170 1,194 (8.6%) (8.6%) Yes 11/21/16 Sunoco Logistics Partners, LP Energy Transfer Partners, LP 21,965 54,455 (0.2%) (0.2%) No 10/24/16 American Midstream Partners LP JP Energy Partners LP 302 476 9.1% 9.1% No 9/26/16 Transcanada Columbia Pipeline Partners 915 3,384 11.1% 9.9% Yes 5/30/16 SemGroup Corp. Rose Rock Midstream 771 2,034 0.0% 0.0% Yes 11/3/15 Targa Resources Corp. Targa Resources Partners LP 6,672 12,138 18.4% 18.4% Yes 8/1/16 Transocean, Inc Transocean Partners 259 1,153 20.8% 20.8% No 10/26/15 Western Refining, Inc. Northern Tier Energy 1,982 5,185 11.7% 11.7% Yes 7/13/15 MPLX LP MarkWest Energy Partners, LP 16,612 22,360 36.3% 36.3% No 5/6/15 Crestwood Equity Partners, LP Crestwood Midstream Partners 3,381 6,901 17.2% 17.2% No 4/6/15 Tesoro Logistics LP QEP Midstream Partners LP 394 1,104 8.6% (14.0%) No 1/26/15 Energy Transfer Partners, LP Regency Energy Partners LP 11,276 18,593 13.2% 13.2% No 10/26/14 Williams Partners LP Access Midstream Partners LP 21,944 34,256 (0.2%) (5.7%) No 10/13/14 Targa Resources Partners LP Atlas Pipeline Partners LP 3,866 6,002 15.0% 15.0% No 11/12/14 Enterprise Products Partners LP Oiltanking Partners LP 1,392 4,243 1.7% (0.9%) No 8/10/14 Kinder Morgan Inc. Kinder Morgan Energy Partners 27,351 52,351 12.0% 12.0% Yes 8/10/14 Kinder Morgan Inc. El Paso Pipeline Partners 5,421 13,193 15.4% 15.4% Yes 7/24/14 Breitburn Energy Partners QR Energy LP 1,811 2,856 17.5% 17.5% No 10/10/13 Regency Energy Partners LP PVR Partners LP 3,931 5,659 25.7% 25.7% No 8/27/13 Plains All American LP PAA Natural Gas Storage LP 755 2,434 8.5% 8.5% No 5/6/13 Inergy Midstream LP Crestwood Midstream Partners LP 1,661 2,643 14.5% 14.5% No 1/29/13 Kinder Morgan Energy Partners LP Copano Energy LLC 3,911 4,858 23.5% 23.5% No 2/23/11 Enterprise Products Partners Duncan Energy Partners LP 1,006 2,973 28.1% 28.1% No
Median $1,811 $4,858 11.1% 12.0% Mean 5,044 11,902 11.6% 11.7%
(3)
Current (2/15/2019) UGI Corp. AmeriGas Partners L.P. $2,154 $5,723 3.4% (16.1%) Yes
Source: Company filings, press releases, presentations and FactSet for pricing data. Represents precedent MLP transactions by affiliated and third party MLPs, Public GPs andC-Corps since 2011.
Note: Considers transactions where target is an MLP. 3 (1) Based on Wall Street research.
(2) Adjusted transaction TEV values affiliated units at market price andnon-affiliated units at offer price. (3) Unaffected premium calculated on Abepre-investor day closing price (12/3/2019).
TUDORPICKERING HOLT & CO ENERGY INVESTMENT & MERCHANT BANKING
PRELIMINARY CONFIDENTIAL DRAFT
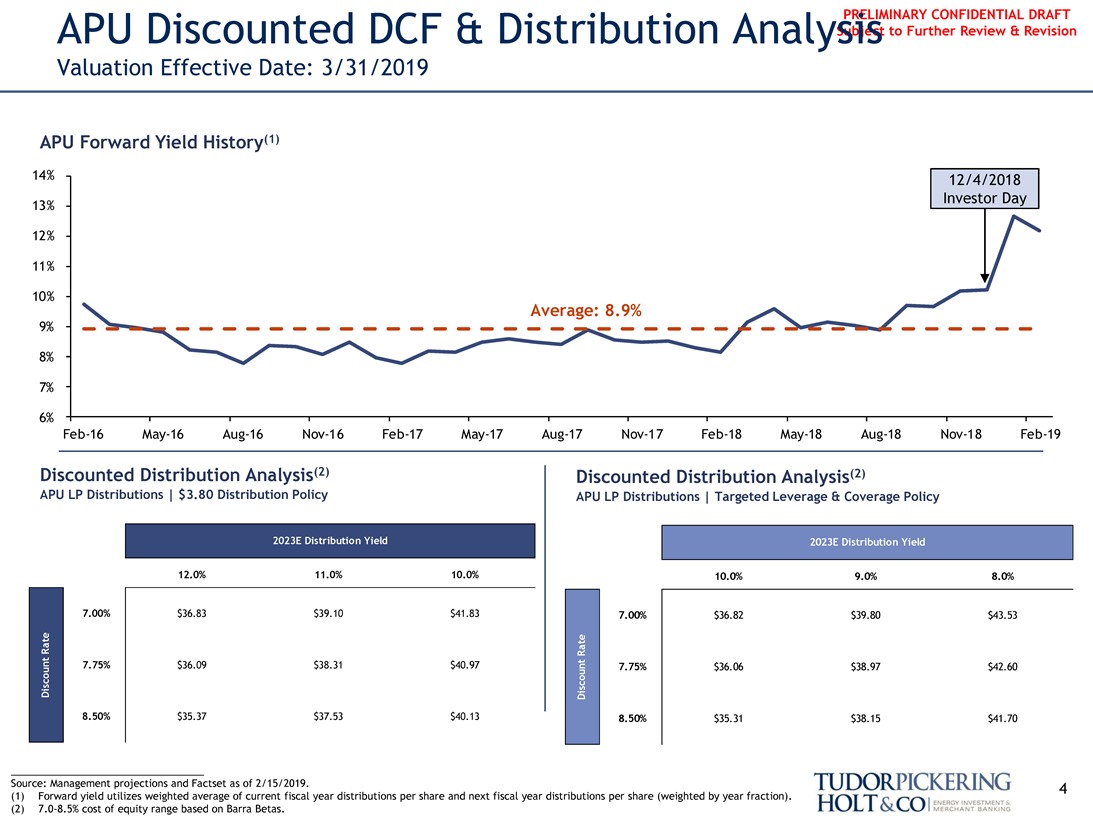
APU Discounted DCF & Distribution Analysis Subject to Further Review & Revision
Valuation Effective Date: 3/31/2019
APU Forward Yield History(1)
14% 12/4/2018 Investor Day
13% 12% 11%
10% Average: 8.9%
9% 8% 7%
6%
Feb-16May-16Aug-16Nov-16Feb-17May-17Aug-17Nov-17Feb-18May-18Aug-18Nov-18Feb-19
Discounted Distribution Analysis(2) Discounted Distribution Analysis(2)
APU LP Distributions | $3.80 Distribution Policy APU LP Distributions | Targeted Leverage & Coverage Policy
2023E Distribution Yield 2023E Distribution Yield
Discount Rate Discount Rate
12.0% 11.0% 10.0% 10.0% 9.0% 8.0%
7.00% $36.83 $39.10 $41.83 7.00% $36.82 $39.80 $43.53
7.75% $36.09 $38.31 $40.97 7.75% $36.06 $38.97 $42.60 8.50% $35.37 $37.53 $40.13 8.50% $35.31 $38.15 $41.70
Source: Management projections and Factset as of 2/15/2019. 4 (1) Forward yield utilizes weighted average of current fiscal year distributions per share and next fiscal year distributions per share (weighted by year fraction).
(2)7.0-8.5% cost of equity range based on Barra Betas.
TUDORPICKERING HOLT & CO ENERGY INVESTMENT & MERCHANT BANKING
PRELIMINARY CONFIDENTIAL DRAFT Subject to Further Review & Revision
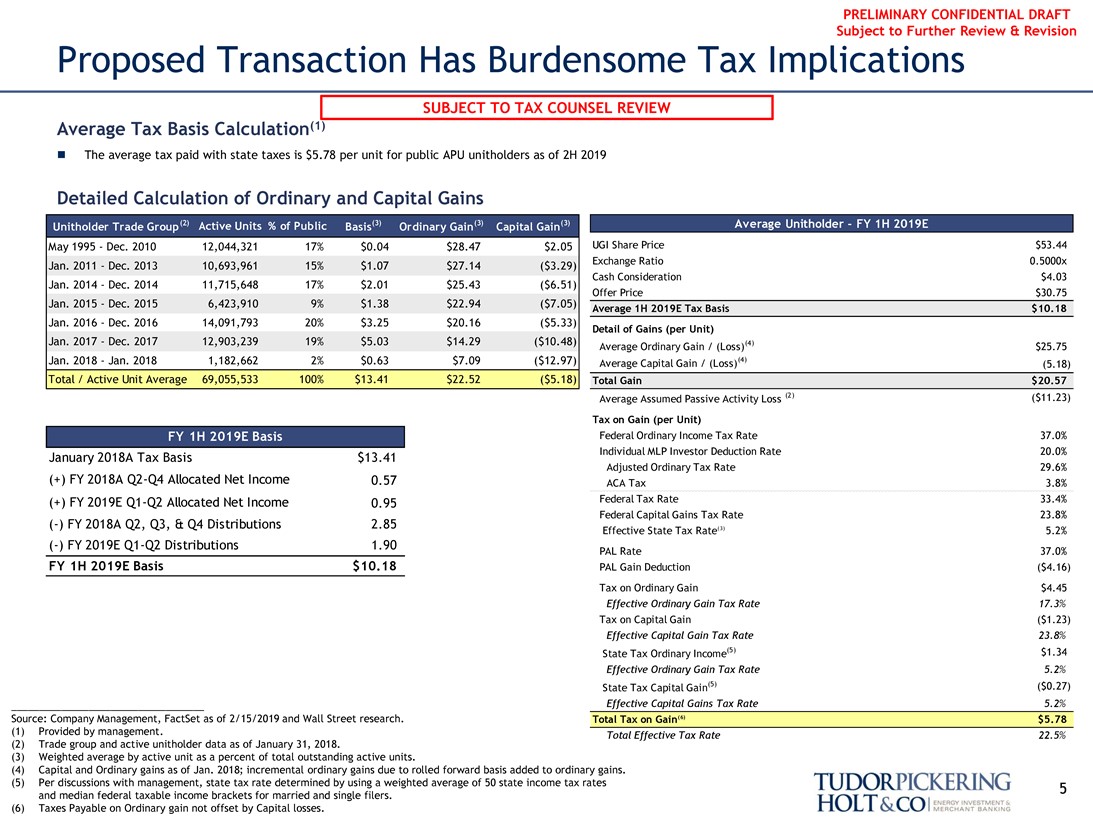
Proposed Transaction Has Burdensome Tax Implications
SUBJECT TO TAX COUNSEL REVIEW
Average Tax Basis Calculation(1)
∎ The average tax paid with state taxes is $5.78 per unit for public APU unitholders as of 2H 2019
Detailed Calculation of Ordinary and Capital Gains
Unitholder Trade Group(2) Active Units % of Public Basis(3) Ordinary Gain(3) Capital Gain(3) Average Unitholder - FY 1H 2019E
May 1995 - Dec. 2010 12,044,321 17% $0.04 $28.47 $2.05 UGI Share Price $53.44 Jan. 2011 - Dec. 2013 10,693,961 15% $1.07 $27.14 ($3.29) Exchange Ratio 0.5000x Cash Consideration $4.03
Jan. 2014 - Dec. 2014 11,715,648 17% $2.01 $25.43 ($6.51)
Jan. 2015 - Dec. 2015 6,423,910 9% $1.38 $22.94 ($7.05) Offer Price $30.75
Average 1H 2019E Tax Basis $10.18
Jan. 2016 - Dec. 2016 14,091,793 20% $3.25 $20.16 ($5.33)
Detail of Gains (per Unit)
Jan. 2017 - Dec. 2017 12,903,239 19% $5.03 $14.29 ($10.48) (4)
Average Ordinary Gain / (Loss) $25.75
Jan. 2018 - Jan. 2018 1,182,662 2% $0.63 $7.09 ($12.97) Average Capital Gain / (Loss)(4) (5.18) Total / Active Unit Average 69,055,533 100% $13.41 $22.52 ($5.18) Total Gain $20.57
Average Assumed Passive Activity Loss (2) ($11.23)
Tax on Gain (per Unit)
Federal Ordinary Income Tax Rate 37.0% January 2018A Tax Basis $13.41 Individual MLP Investor Deduction Rate 20.0% Adjusted Ordinary Tax Rate 29.6%
FY 1H 2019E Basis
(+) FY 2018AQ2-Q4 Allocated Net Income 0.57 ACA Tax 3.8% (+) FY 2019EQ1-Q2 Allocated Net Income 0.95 Federal Tax Rate 33.4% Federal Capital Gains Tax Rate 23.8%
(-) FY 2018A Q2, Q3, & Q4 Distributions 2.85 (3)
Effective State Tax Rate 5.2%
(-) FY 2019EQ1-Q2 Distributions 1.90
PAL Rate 37.0% FY 1H 2019E Basis $10.18 PAL Gain Deduction ($4.16) Tax on Ordinary Gain $4.45
Effective Ordinary Gain Tax Rate 17.3%
Tax on Capital Gain ($1.23)
Effective Capital Gain Tax Rate 23.8%
State Tax Ordinary Income(5) $1.34
Effective Ordinary Gain Tax Rate 5.2%
State Tax Capital Gain(5) ($0.27)
Effective Capital Gains Tax Rate 5.2% Source: Company Management, FactSet as of 2/15/2019 and Wall Street research. Total Tax on Gain(6) $5.78
(1) Provided by management. Total Effective Tax Rate 22.5%
(2) Trade group and active unitholder data as of January 31, 2018.
(3) Weighted average by active unit as a percent of total outstanding active units.
(4) Capital and Ordinary gains as of Jan. 2018; incremental ordinary gains due to rolled forward basis added to ordinary gains.
(5) Per discussions with management, state tax rate determined by using a weighted average of 50 state income tax rates 5 and median federal taxable income brackets for married and single filers.
(6) Taxes Payable on Ordinary gain not offset by Capital losses.
TUDORPICKERING HOLT & CO ENERGY INVESTMENT & MERCHANT BANKING
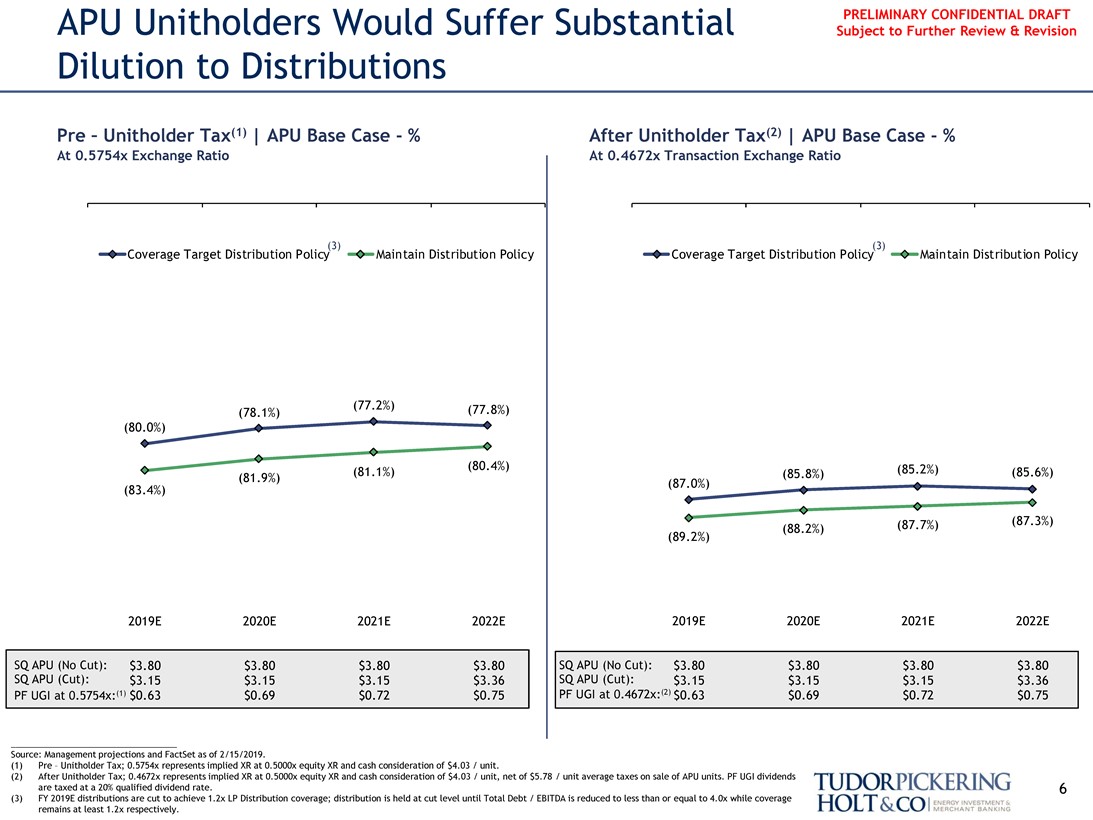
APU Unitholders Would Suffer Substantial PRELIMINARY CONFIDENTIAL DRAFT
Subject to Further Review & Revision
Dilution to Distributions
Pre - Unitholder Tax(1) | APU Base Case - % After Unitholder Tax(2) | APU Base Case - %
At 0.5754x Exchange Ratio At 0.4672x Transaction Exchange Ratio
(3) (3)
Coverage Target Distribution Policy Maintain Distribution Policy Coverage Target Distribution Policy Maintain Distribution Policy
(77.2%) (77.8%)
(78.1%)
(80.0%)
(80.4%) (85.2%)
(81.1%) (85.8%) (85.6%) (83.4%) (81.9%) (87.0%)
(87.7%) (87.3%) (88.2%) (89.2%)
2019E 2020E 2021E 2022E 2019E 2020E 2021E 2022E
SQ APU (No Cut): $3.80 $3.80 $3.80 $3.80 SQ APU (No Cut): $3.80 $3.80 $3.80 $3.80
SQ APU (Cut): $3.15 $3.15 $3.15 $3.36 SQ APU (Cut): $3.15 $3.15 $3.15 $3.36 PF UGI at 0.5754x:(1) $0.63 $0.69 $0.72 $0.75 PF UGI at 0.4672x:(2) $0.63 $0.69 $0.72 $0.75
Source: Management projections and FactSet as of 2/15/2019.
(1) Pre - Unitholder Tax; 0.5754x represents implied XR at 0.5000x equity XR and cash consideration of $4.03 / unit.
(2) After Unitholder Tax; 0.4672x represents implied XR at 0.5000x equity XR and cash consideration of $4.03 / unit, net of $5.78 / unit average taxes on sale of APU units. PF UGI dividends are taxed at a 20% qualified dividend rate. 6 (3) FY 2019E distributions are cut to achieve 1.2x LP Distribution coverage; distribution is held at cut level until Total Debt / EBITDA is reduced to less than or equal to 4.0x while coverage remains at least 1.2x respectively.
TUDORPICKERING HOLT & CO ENERGY INVESTMENT & MERCHANT BANKING
PRELIMINARY CONFIDENTIAL DRAFT Subject to Further Review & Revision
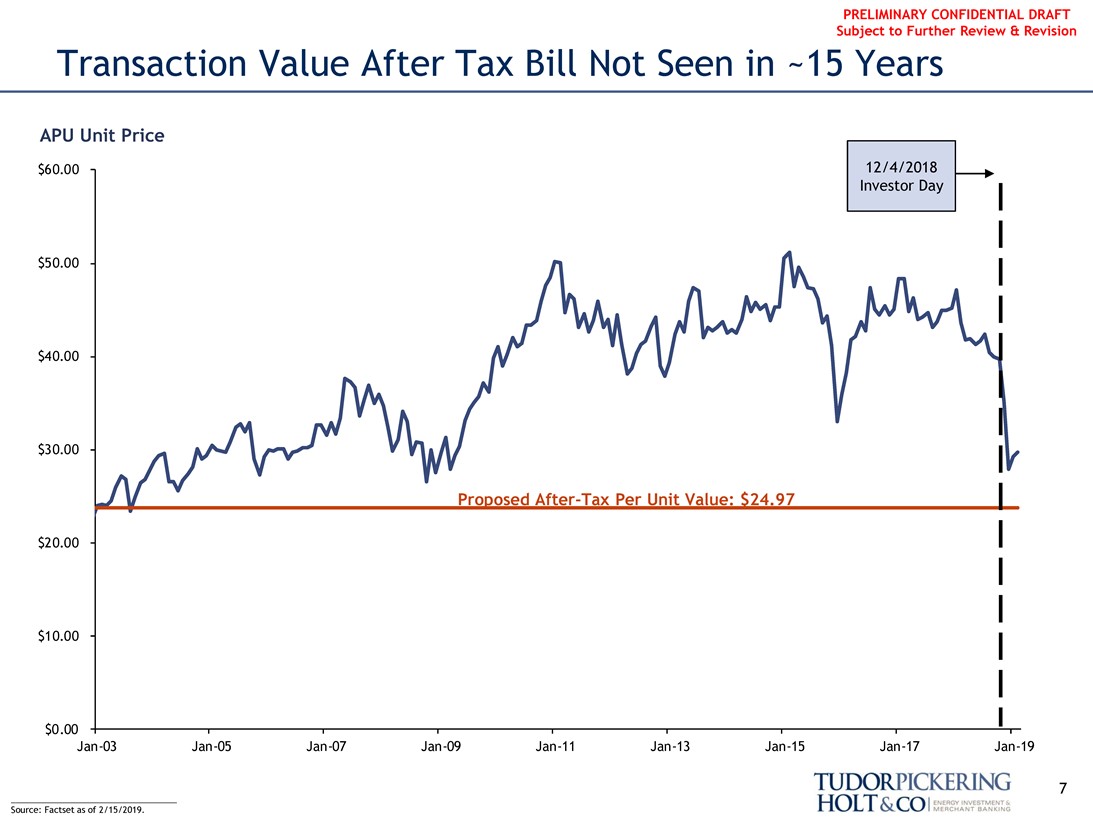
Transaction Value After Tax Bill Not Seen in ~15 Years
APU Unit Price
$60.00 12/4/2018 Investor Day
$50.00
$40.00
$30.00
ProposedAfter-Tax Per Unit Value: $24.97
$20.00
$10.00
$0.00
Jan-03Jan-05Jan-07Jan-09Jan-11Jan-13Jan-15Jan-17Jan-19
7 Source: Factset as of 2/15/2019.
TUDORPICKERING HOLT & CO ENERGY INVESTMENT & MERCHANT BANKING
PRELIMINARY CONFIDENTIAL DRAFT
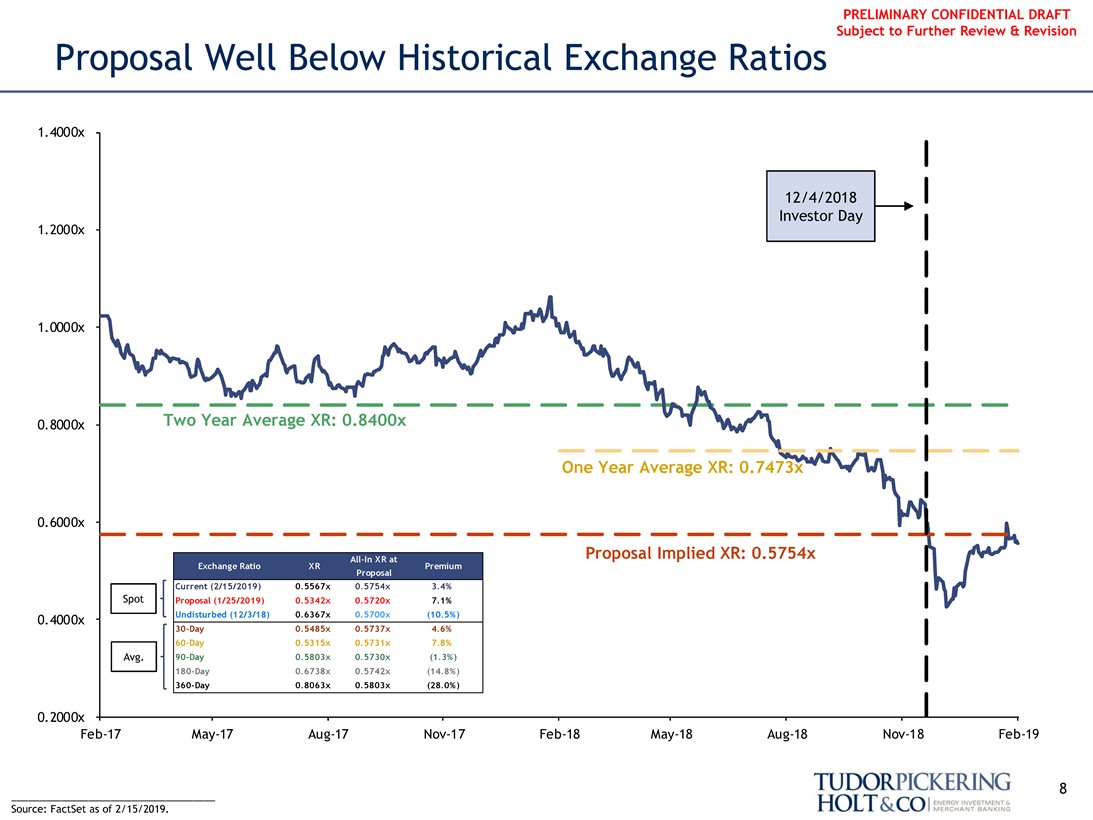
Proposal Well Below Historical Exchange Ratios Subject to Further Review & Revision
1.4000x
12/4/2018 Investor Day
1.2000x
1.0000x
0.8000x Two Year Average XR: 0.8400x
One Year Average XR: 0.7473x
0.6000x
Proposal Implied XR: 0.5754x
Exchange Ratio XR Premium All-In XR at Proposal
Current (2/15/2019) 0.5567x 0.5754x 3.4% Spot Proposal (1/25/2019) 0.5342x 0.5720x 7.1%
0.4000x Undisturbed (12/3/18) 0.6367x 0.5700x (10.5%)30-Day 0.5485x 0.5737x 4.6%60-Day 0.5315x 0.5731x 7.8% Avg.90-Day 0.5803x 0.5730x (1.3%)180-Day 0.6738x 0.5742x (14.8%)360-Day 0.8063x 0.5803x (28.0%)
0.2000x
Feb-17May-17Aug-17Nov-17Feb-18May-18Aug-18Nov-18Feb-19
8
Source: FactSet as of 2/15/2019.
TUDORPICKERING HOLT & CO ENERGY INVESTMENT & MERCHANT BANKING
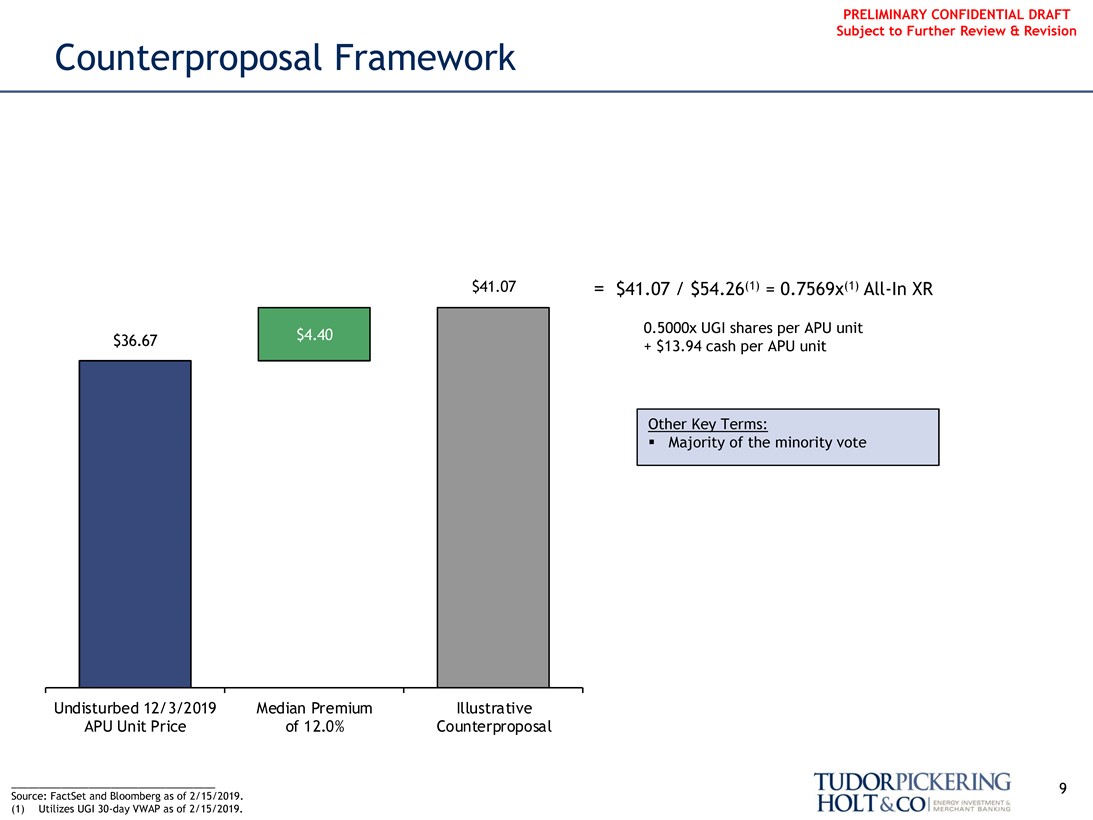
PRELIMINARY CONFIDENTIAL DRAFT Counterproposal Framework Subject to Further Review & Revision
$41.07 = $41.07 / $54.26(1) = 0.7569x(1)All-In XR
0.5000x UGI shares per APU unit $36.67 + $13.94 cash per APU unit
Other Key Terms:
$4.40
◾ Majority of the minority vote
Undisturbed 12/3/2019 Median Premium Illustrative APU Unit Price of 12.0% Counterproposal
9 Source: FactSet and Bloomberg as of 2/15/2019.
(1) Utilizes UGI30-day VWAP as of 2/15/2019.
TUDORPICKERING HOLT & CO ENERGY INVESTMENT & MERCHANT BANKING
PRELIMINARY CONFIDENTIAL DRAFT Subject to Further Review & Revision
Appendix
10
TUDORPICKERING HOLT & CO ENERGY INVESTMENT & MERCHANT BANKING
PRELIMINARY CONFIDENTIAL DRAFT Subject to Further Review & Revision
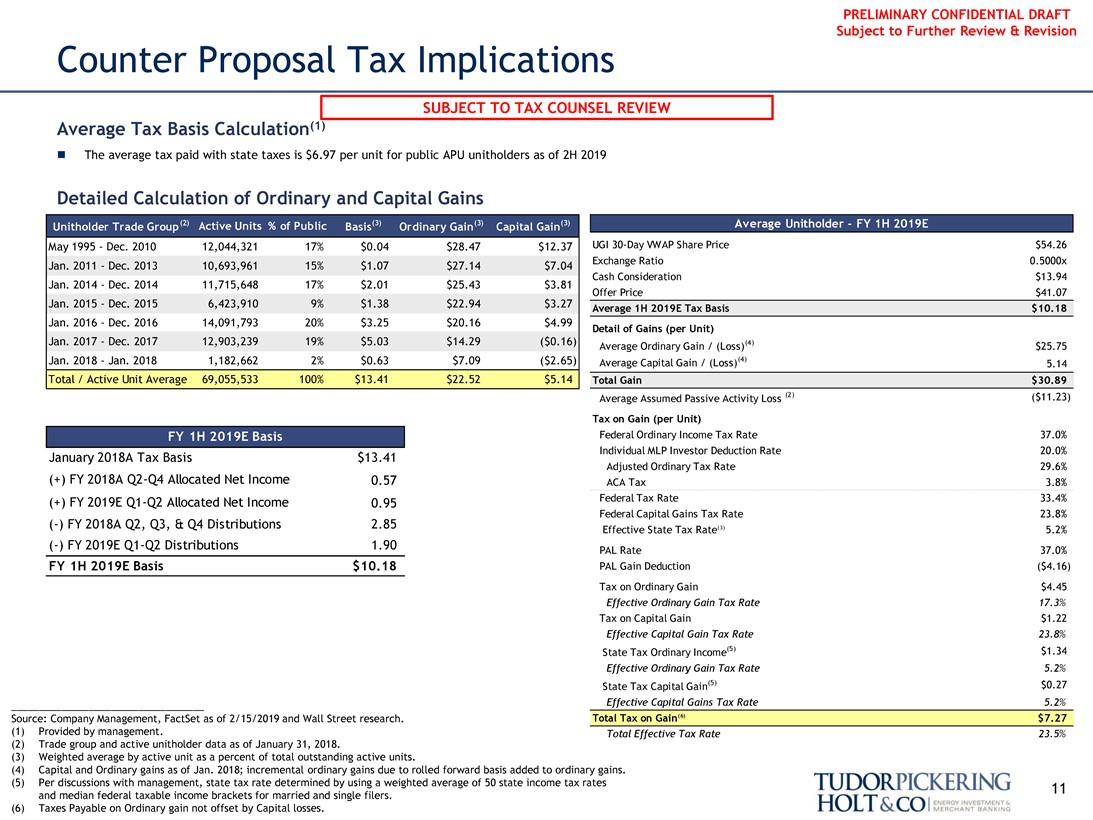
Counter Proposal Tax Implications
SUBJECT TO TAX COUNSEL REVIEW
Average Tax Basis Calculation(1)
∎ The average tax paid with state taxes is $6.97 per unit for public APU unitholders as of 2H 2019
Detailed Calculation of Ordinary and Capital Gains
Unitholder Trade Group(2) Active Units % of Public Basis(3) Ordinary Gain(3) Capital Gain(3) Average Unitholder - FY 1H 2019E
May 1995 - Dec. 2010 12,044,321 17% $0.04 $28.47 $12.37 UGI30-Day VWAP Share Price $54.26 Jan. 2011 - Dec. 2013 10,693,961 15% $1.07 $27.14 $7.04 Exchange Ratio 0.5000x Cash Consideration $13.94
Jan. 2014 - Dec. 2014 11,715,648 17% $2.01 $25.43 $3.81
Offer Price $41.07
Jan. 2015 - Dec. 2015 6,423,910 9% $1.38 $22.94 $3.27 Average 1H 2019E Tax Basis $10.18 Jan. 2016 - Dec. 2016 14,091,793 20% $3.25 $20.16 $4.99
Detail of Gains (per Unit)
Jan. 2017 - Dec. 2017 12,903,239 19% $5.03 $14.29 ($0.16) Average Ordinary Gain / (Loss)(4) $25.75 Jan. 2018 - Jan. 2018 1,182,662 2% $0.63 $7.09 ($2.65) Average Capital Gain / (Loss)(4) 5.14 Total / Active Unit Average 69,055,533 100% $13.41 $22.52 $5.14 Total Gain $30.89
Average Assumed Passive Activity Loss (2) ($11.23)
Tax on Gain (per Unit)
Federal Ordinary Income Tax Rate 37.0% Individual MLP Investor Deduction Rate 20.0%
January 2018A Tax Basis $13.41
Adjusted Ordinary Tax Rate 29.6%
FY 1H 2019E Basis
(+) FY 2018AQ2-Q4 Allocated Net Income 0.57 ACA Tax 3.8% (+) FY 2019EQ1-Q2 Allocated Net Income 0.95 Federal Tax Rate 33.4% Federal Capital Gains Tax Rate 23.8%
(-) FY 2018A Q2, Q3, & Q4 Distributions 2.85 Effective State Tax Rate(3) 5.2% (-) FY 2019EQ1-Q2 Distributions 1.90 PAL Rate 37.0%
FY 1H 2019E Basis $10.18 PAL Gain Deduction ($4.16) Tax on Ordinary Gain $4.45
Effective Ordinary Gain Tax Rate 17.3%
Tax on Capital Gain $1.22
Effective Capital Gain Tax Rate 23.8%
State Tax Ordinary Income(5) $1.34
Effective Ordinary Gain Tax Rate 5.2%
State Tax Capital Gain(5) $0.27
Effective Capital Gains Tax Rate 5.2% Source: Company Management, FactSet as of 2/15/2019 and Wall Street research. Total Tax on Gain(6) $7.27
(1) Provided by management. Total Effective Tax Rate 23.5%
(2) Trade group and active unitholder data as of January 31, 2018.
(3) Weighted average by active unit as a percent of total outstanding active units.
(4) Capital and Ordinary gains as of Jan. 2018; incremental ordinary gains due to rolled forward basis added to ordinary gains.
(5) Per discussions with management, state tax rate determined by using a weighted average of 50 state income tax rates 11 and median federal taxable income brackets for married and single filers.
(6) Taxes Payable on Ordinary gain not offset by Capital losses.
TUDORPICKERING HOLT & CO ENERGY INVESTMENT & MERCHANT BANKING
PRELIMINARY CONFIDENTIAL DRAFT Subject to Further Review & Revision
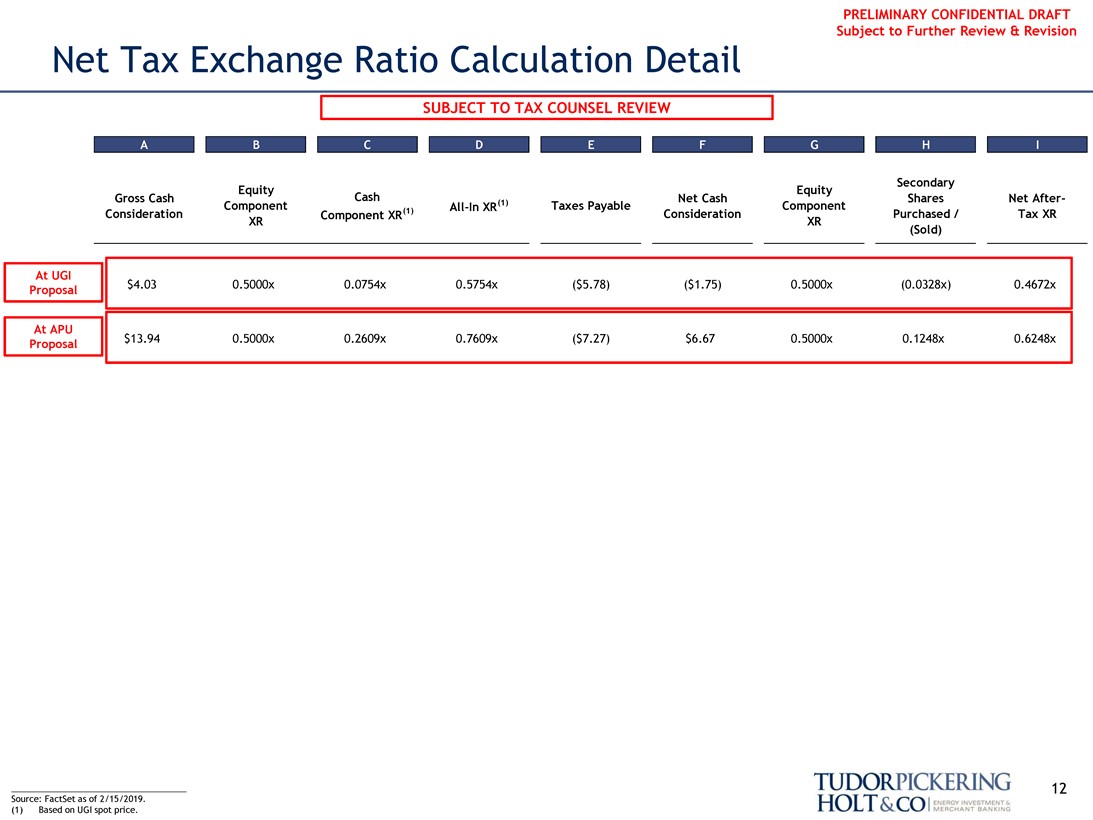
Net Tax Exchange Ratio Calculation Detail
SUBJECT TO TAX COUNSEL REVIEW
A B C D E F G H I
Secondary Equity Equity
Gross Cash Cash Net Cash Shares Net After-Component(1) All-In XR(1) Taxes Payable Component Consideration Component XR Consideration Purchased / Tax XR
XR XR
(Sold)
At UGI
Proposal $4.03 0.5000x 0.0754x 0.5754x ($5.78) ($1.75) 0.5000x (0.0328x) 0.4672x
At APU
Proposal $13.94 0.5000x 0.2609x 0.7609x ($7.27) $6.67 0.5000x 0.1248x 0.6248x
12 Source: FactSet as of 2/15/2019.
(1) Based on UGI spot price.
TUDORPICKERING HOLT & CO ENERGY INVESTMENT & MERCHANT BANKING
PRELIMINARY CONFIDENTIAL DRAFT Subject to Further Review & Revision
TUDORPICKERING HOLT & CO ENERGY INVESTMENT & MERCHANT BANKING
About The Firm
Tudor, Pickering, Holt & Co. is an integrated energy investment and merchant bank, providing high quality advice and services to institutional and corporate clients. Through the company’s two broker-dealer units, Tudor, Pickering, Holt & Co. Securities, Inc. (TPHCSI) and Tudor Pickering Holt & Co Advisors LP (TPHCA), members FINRA, together with affiliates in the United Kingdom and Canada, the company offers securities and investment banking services to the energy community. Perella Weinberg Partners Capital Management LP is an SEC registered investment adviser that delivers a suite of energy investment strategies.
The firm, headquartered in Houston, Texas, has approximately 170 employees and offices in Calgary, Canada; Denver, Colorado; New York, New York; and London, England.
Contact Us
Houston (Research, Sales and Trading): 713-333-2960 Houston (Investment Banking): 713-333-7100 Houston (Asset Management): 713-337-3999 Denver (Sales): 303-300-1900 Denver (Investment Banking): 303-300-1900
New York (Investment Banking): 212-610-1660
New York (Research, Sales): 212-610-1600 London: +011 44(0) 20 7268 2800 Calgary: 403-705-7830
www.TPHco.com
Copyright 2019 — Tudor, Pickering, Holt & Co.
Disclosure Statement
Tudor, Pickering, Holt & Co. does not provide accounting, tax or legal advice. This presentation does not constitute a tax opinion and cannot be used by any taxpayer for the purpose of avoiding tax penalties. We (i) make no conclusion on the valuation or pricing for tax purposes or the effects of federal income tax laws on any party and (ii) have assumed that the party’s intended tax treatment will be respected. Each person should seek legal, regulatory, accounting and tax advice based on his, her or its particular circumstances from independent advisors regarding the evaluation and impact of any transactions or matters described herein.
The information contained herein is confidential (except for information relating to United States tax issues) and may not be reproduced in whole or in part except as set forth in a written agreement between the Audit Committee of the Board of Directors of AmeriGas Propane, Inc. and Tudor, Pickering, Holt & Co.
Tudor, Pickering, Holt & Co. assumes no responsibility for independent verification of third-party information and has relied on such information being complete and accurate in all material respects. To the extent such information includes estimates and forecasts of future financial performance (including estimates of potential cost savings and synergies) prepared by, reviewed or discussed with the managements of your company and/ or other potential transaction participants or obtained from public sources, we have assumed that such estimates and forecasts have been reasonably prepared on bases reflecting the best currently available estimates and judgments of such managements (or, with respect to estimates and forecasts obtained from public sources, represent reasonable estimates). These materials were designed for use by specific persons familiar with the business and the affairs of your company and Tudor, Pickering, Holt & Co. materials.
Under no circumstances is this presentation to be used or considered as an offer to sell or a solicitation of any offer to buy, any security. Prior to making any trade, you should discuss with your professional tax, accounting, or regulatory advisers how such particular trade(s) affect you. This brief statement does not disclose all of the risks and other significant aspects of entering into any particular transaction.
Tudor, Pickering, Holt & Co. operates in the United Kingdom under the trading name Perella Weinberg Partners UK LLP (authorized and regulated by the Financial Conduct Authority), and in Canada through its affiliate, Tudor, Pickering, Holt & Co. Securities
– Canada, ULC, located in Calgary, Alberta.
13


