Exhibit (c)(4)
Private and confidential – illustrative and for discussion purposes only Analysis subject to change based on revised financials and conclusions of UGI and PWC tax analysis S T R I C T L Y P R I V A T E A N D C O N F I D E N T I A L Discussion materials January 25, 2019 Update
Private and confidential – illustrative and for discussion purposes only Analysis subject to change based on revised financials and conclusions of UGI and PWC tax analysis C O N F I D E N T I A L This presentation was prepared exclusively for the benefit and internal use of the J.P. Morgan client to whom it is directly addressed and delivered (including such client’s subsidiaries, the “Company”) in order to assist the Company in evaluating, on a preliminary basis, the feasibility of a possible transaction or transactions and does not carry any right of publication or disclosure, in whole or in part, to any other party. This presentation is for discussion purposes only and is incomplete without reference to, and should be viewed solely in conjunction with, the oral briefing provided by J.P. Morgan. Neither this presentation nor any of its contents may be disclosed or used for any other purpose without the prior written consent of J.P. Morgan. The information in this presentation is based upon any management forecasts supplied to us and reflects prevailing conditions and our views as of this date, all of which are accordingly subject to change. J.P. Morgan’s opinions and estimates constitute J.P. Morgan’s judgment and should be regarded as indicative, preliminary and for illustrative purposes only. In preparing this presentation, we have relied upon and assumed, without independent verification, the accuracy and completeness of all information available from public sources or which was provided to us by or on behalf of the Company or which was otherwise reviewed by us. In addition, our analyses are not and do not purport to be appraisals of the assets, stock, or business of the Company or any other entity. J.P. Morgan makes no representations as to the actual value which may be received in connection with a transaction nor the legal, tax or accounting effects of consummating a transaction. Unless expressly contemplated hereby, the information in this presentation does not take into account the effects of a possible transaction or transactions involving an actual or potential change of control, which may have significant valuation and other effects. Notwithstanding anything herein to the contrary, the Company and each of its employees, representatives or other agents may disclose to any and all persons, without limitation of any kind, the U.S. federal and state income tax treatment and the U.S. federal and state income tax structure of the transactions contemplated hereby and all materials of any kind (including opinions or other tax analyses) that are provided to the Company relating to such tax treatment and tax structure insofar as such treatment and/or structure relates to a U.S. federal or state income tax strategy provided to the Company by J.P. Morgan. J.P. Morgan’s policies on data privacy can be found at http://www.jpmorgan.com/pages/privacy. J.P. Morgan’s policies prohibit employees from offering, directly or indirectly, a favorable research rating or specific price target, or offering to change a rating or price target, to a subject company as consideration or inducement for the receipt of business or for compensation. J.P. Morgan also prohibits its research analysts from being compensated for involvement in investment banking transactions except to the extent that such participation is intended to benefit investors. IRS Circular 230 Disclosure: JPMorgan Chase & Co. and its affiliates do not provide tax advice. Accordingly, any discussion of U.S. tax matters included herein (including any attachments) is not intended or written to be used, and cannot be used, in connection with the promotion, marketing or recommendation by anyone not affiliated with JPMorgan Chase & Co. of any of the matters addressed herein or for the purpose of avoiding U.S.tax-related penalties. J.P. Morgan is the marketing name for the Corporate and Investment Banking activities of JPMorgan Chase Bank, N.A., JPMS (member, NYSE), J.P. Morgan PLC authorized by the Prudential Regulation Authority and regulated by the Financial Conduct Authority and the Prudential Regulation Authority and their investment banking affiliates. This presentation does not constitute a commitment by any J.P. Morgan entity to underwrite, subscribe for or place any securities or to extend or arrange credit or to provide any other services. Copyright 2018 JPMorgan Chase & Co. All rights reserved. U G I
Private and confidential – illustrative and for discussion purposes only Analysis subject to change based on revised financials and conclusions of UGI and PWC tax analysis C O N F I D E N T I A L Agenda Page 1Buy-in of APU 1 2 Appendix 9 U G I

Private and confidential – illustrative and for discussion purposes only Analysis subject to change based on revised financials and conclusions of UGI and PWC tax analysisBuy-in of APU C O N F I D E N T I A L UGI / APU relative price performance Last two years Last three months UGI APU UGI peers1 APU peers2 40% 40% 30% 30% 20% 21% 20% 10% 10% 4% 0% 1% 0% 1% (10%) (7%) (10%) (20%) (20%) (22%) (30%) (31%) (30%) (37%) (40%) (40%) (50%) (50%) (60%) (60%)Jan-17Jun-17Nov-17Apr-18Aug-18Jan-19Oct-18Nov-18Dec-18Jan-19 Price performance YTD 4% 20% 1 month (0%) 27% 3 months 1% (22%) 6 months 5% (30%) 1 year 20% (37%) Source: FactSet as of 1/23/19; 1 UGI peers include CNP, MDU, MIC, and NFG; 2 APU peers include FGP and SPH U G I 1
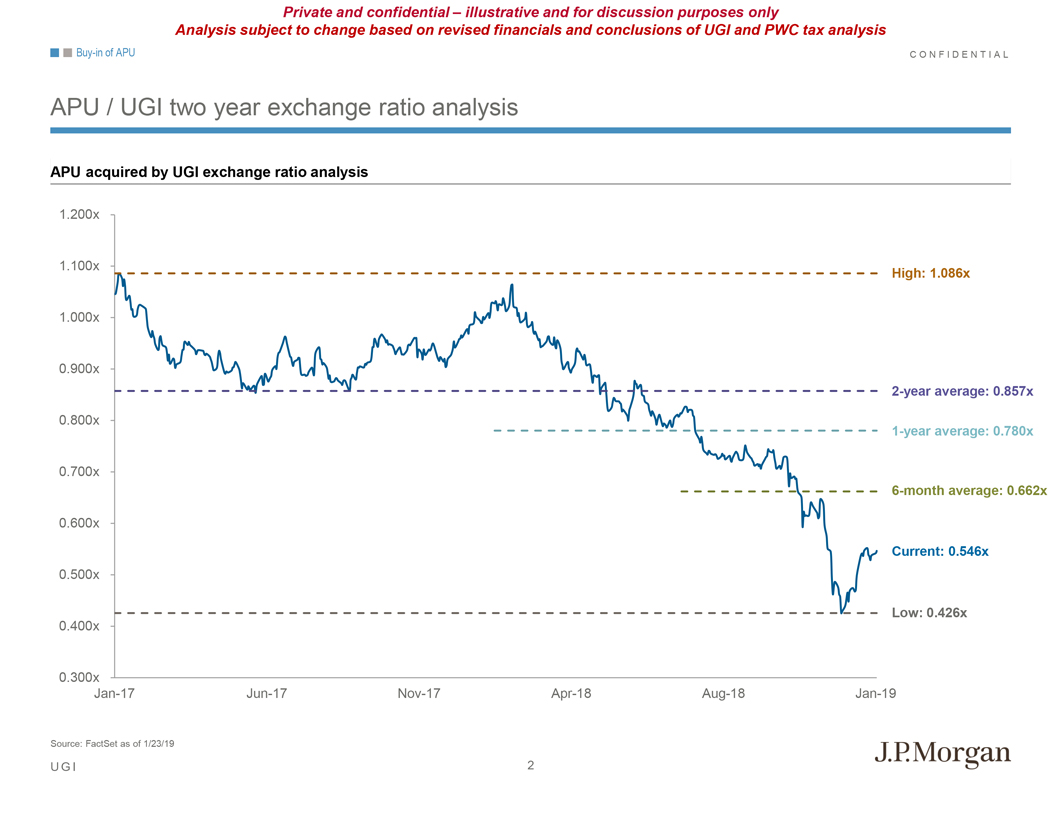
Private and confidential – illustrative and for discussion purposes only Analysis subject to change based on revised financials and conclusions of UGI and PWC tax analysisBuy-in of APU C O N F I D E N T I A L APU / UGI two year exchange ratio analysis APU acquired by UGI exchange ratio analysis 1.200x 1.100x High: 1.086x 1.000x 0.900x2-year average: 0.857x 0.800x1-year average: 0.780x 0.700x6-month average: 0.662x 0.600x Current: 0.546x 0.500x Low: 0.426x 0.400x 0.300xJan-17Jun-17Nov-17Apr-18Aug-18Jan-19 Source: FactSet as of 1/23/19 U G I 2

Private and confidential – illustrative and for discussion purposes only Analysis subject to change based on revised financials and conclusions of UGI and PWC tax analysisBuy-in of APU C O N F I D E N T I A L Illustrative APU analysis at various purchase prices Based on consensus estimates Offer premium Current 5% 10% 15% 20% Implied exchange ratio 0.546x 0.574x 0.601x 0.628x 0.656x UGI share price $55.63 $55.63 $55.63 $55.63 $55.63 Implied APU unit purchase price $30.40 $31.92 $33.44 $34.96 $36.48 Implied LP equity value $2,827 $2,968 $3,109 $3,250 $3,392 Memo: Purchase price based on public ownership¹ $2,104 $2,209 $2,314 $2,419 $2,525 (+) Net debt, pref. stock, and NCI and assumed illustrative GP / IDR value 3,328 3,328 3,328 3,328 3,328 Implied transaction value $6,154 $6,296 $6,437 $6,578 $6,720 Implied transaction value / EBITDA EBITDA metric 2018A EBITDA $606 10.2x 10.4x 10.6x 10.9x 11.1x 2019E EBITDA 629 9.8x 10.0x 10.2x 10.5x 10.7x 2020E EBITDA 633 9.7x 9.9x 10.2x 10.4x 10.6x Implied APU unit price / LP DCF / unit DCF / unit metric 2018A LP DCF / unit $3.71 8.2x 8.6x 9.0x 9.4x 9.8x 2019E LP DCF / unit 3.78 8.0x 8.4x 8.8x 9.2x 9.6x 2020E LP DCF / unit 3.78 8.0x 8.4x 8.8x 9.2x 9.6x Implied APU unit price / EPS EPS metric 2018A EPS $2.35 2 12.9x 13.6x 14.2x 14.9x 15.5x 2019E EPS 2.39 12.7x 13.4x 14.0x 14.6x 15.3x 2020E EPS 2.44 12.5x 13.1x 13.7x 14.3x 15.0x Premium / (discount) to:30-day VWAP $26.54 15% 20% 26% 32% 37%60-day VWAP 29.27 4% 9% 14% 19% 25% Source: Equity research consensus projections as of 1/23/19; company filings; Bloomberg; Note: Financials based on 9/30 FYE 1 Public ownership of approximately 74%; 2 Excludes $75mm impairment charge; including impairment results in EPS of $1.54 U G I 3
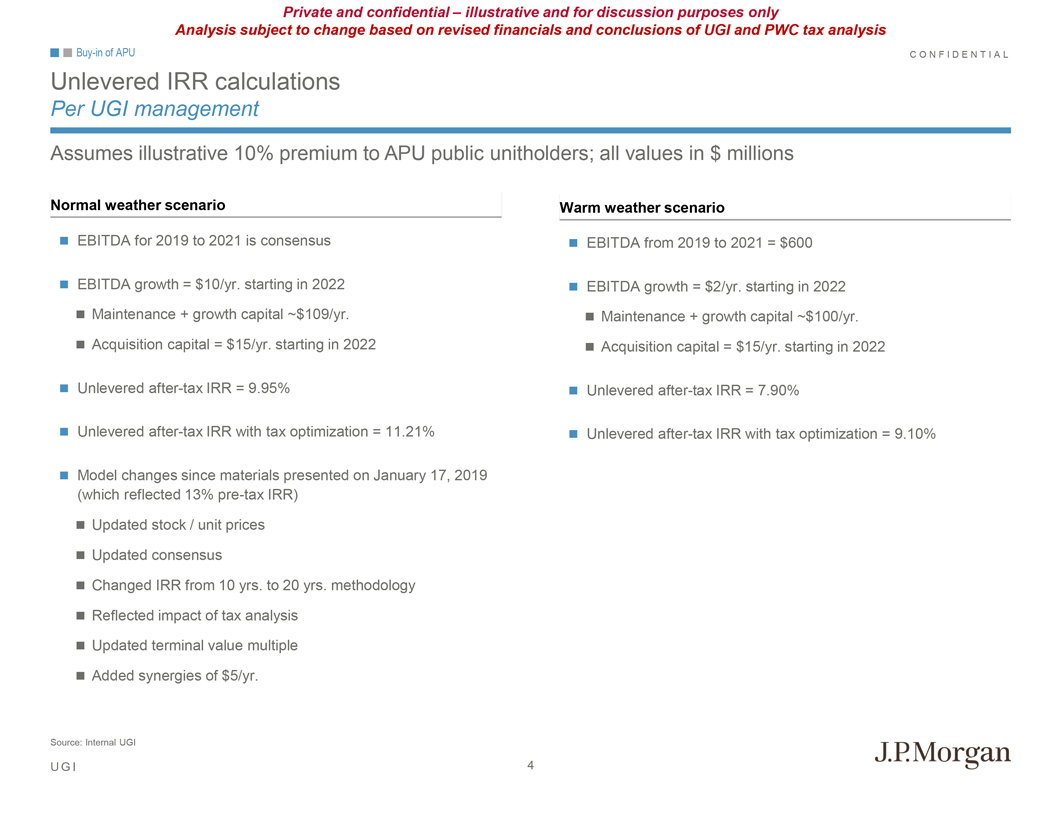
Private and confidential – illustrative and for discussion purposes only Analysis subject to change based on revised financials and conclusions of UGI and PWC tax analysisBuy-in of APU C O N F I D E N T I A L Unlevered IRR calculations Per UGI management Assumes illustrative 10% premium to APU public unitholders; all values in $ millions Normal weather scenario Warm weather scenario EBITDA for 2019 to 2021 is consensus EBITDA from 2019 to 2021 = $600 EBITDA growth = $10/yr. starting in 2022 EBITDA growth = $2/yr. starting in 2022 Maintenance + growth capital ~$109/yr. Maintenance + growth capital ~$100/yr. Acquisition capital = $15/yr. starting in 2022 Acquisition capital = $15/yr. starting in 2022 Unleveredafter-tax IRR = 9.95% Unleveredafter-tax IRR = 7.90% Unleveredafter-tax IRR with tax optimization = 11.21% Unleveredafter-tax IRR with tax optimization = 9.10% Model changes since materials presented on January 17, 2019 (which reflected 13%pre-tax IRR) Updated stock / unit prices Updated consensus Changed IRR from 10 yrs. to 20 yrs. methodology Reflected impact of tax analysis Updated terminal value multiple Added synergies of $5/yr. Source: Internal UGI U G I 4
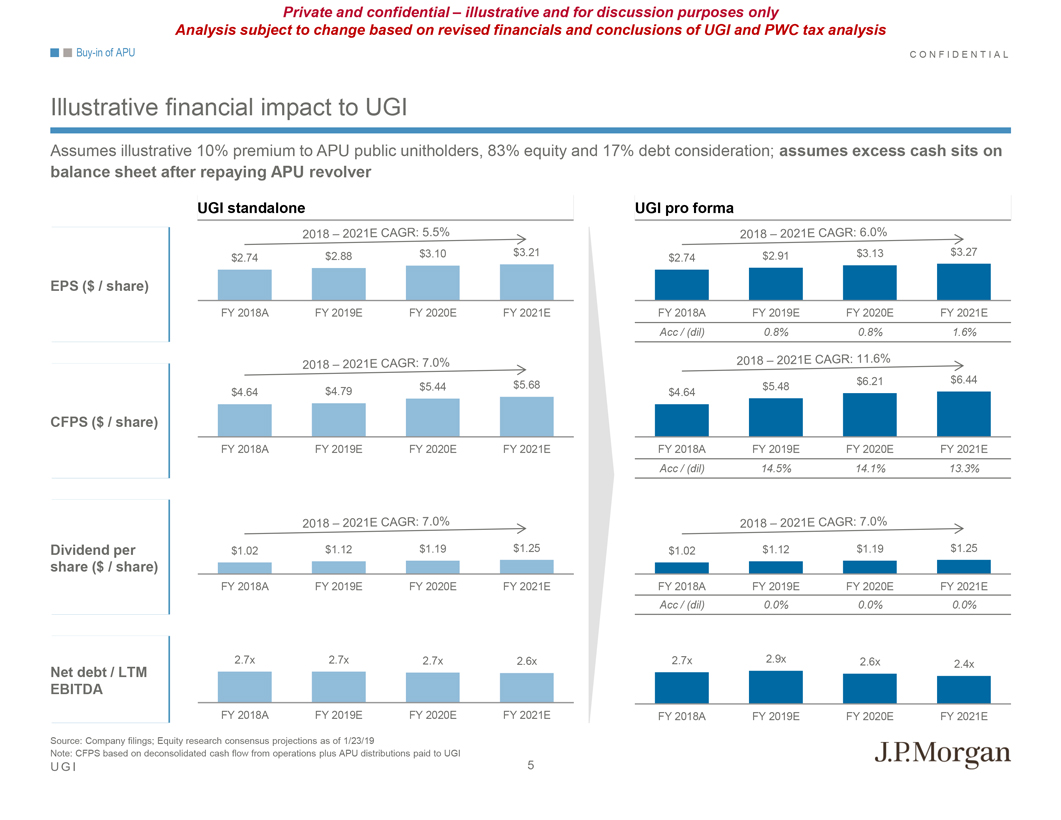
Private and confidential – illustrative and for discussion purposes only Analysis subject to change based on revised financials and conclusions of UGI and PWC tax analysisBuy-in of APU C O N F I D E N T I A L Illustrative financial impact to UGI Assumes illustrative 10% premium to APU public unitholders, 83% equity and 17% debt consideration; assumes excess cash sits on balance sheet after repaying APU revolver UGI standalone UGI pro forma $2.88 $3.10 $3.21 $2.91 $3.13 $3.27 $2.74 $2.74 EPS ($ / share) FY 2018A FY 2019E FY 2020E FY 2021E FY 2018A FY 2019E FY 2020E FY 2021E Acc / (dil) 0.8% 0.8% 1.6% $6.21 $6.44 $5.44 $5.68 $5.48 $4.64 $4.79 $4.64 CFPS ($ / share) FY 2018A FY 2019E FY 2020E FY 2021E FY 2018A FY 2019E FY 2020E FY 2021E Acc / (dil) 14.5% 14.1% 13.3% Dividend per $1.02 $1.12 $1.19 $1.25 $1.02 $1.12 $1.19 $1.25 share ($ / share) FY 2018A FY 2019E FY 2020E FY 2021E FY 2018A FY 2019E FY 2020E FY 2021E Acc / (dil) 0.0% 0.0% 0.0% 2.7x 2.7x 2.7x 2.6x 2.7x 2.9x 2.6x 2.4x Net debt / LTM EBITDA FY 2018A FY 2019E FY 2020E FY 2021E FY 2018A FY 2019E FY 2020E FY 2021E Source: Company filings; Equity research consensus projections as of 1/23/19 Note: CFPS based on deconsolidated cash flow from operations plus APU distributions paid to UGI U G I 5
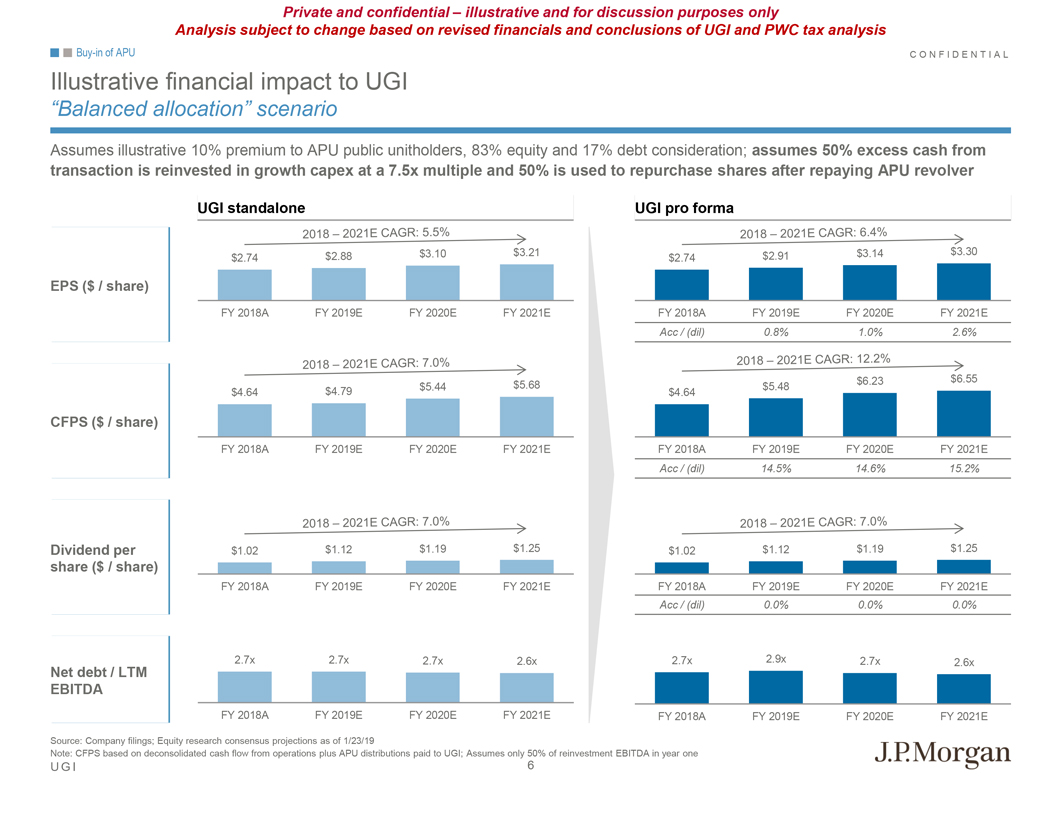
Private and confidential – illustrative and for discussion purposes only Analysis subject to change based on revised financials and conclusions of UGI and PWC tax analysisBuy-in of APU C O N F I D E N T I A L Illustrative financial impact to UGI “Balanced allocation” scenario Assumes illustrative 10% premium to APU public unitholders, 83% equity and 17% debt consideration; assumes 50% excess cash from transaction is reinvested in growth capex at a 7.5x multiple and 50% is used to repurchase shares after repaying APU revolver UGI standalone UGI pro forma $3.10 $3.21 $2.91 $3.14 $3.30 $2.74 $2.88 $2.74 EPS ($ / share) FY 2018A FY 2019E FY 2020E FY 2021E FY 2018A FY 2019E FY 2020E FY 2021E Acc / (dil) 0.8% 1.0% 2.6% $6.23 $6.55 $5.44 $5.68 $5.48 $4.64 $4.79 $4.64 CFPS ($ / share) FY 2018A FY 2019E FY 2020E FY 2021E FY 2018A FY 2019E FY 2020E FY 2021E Acc / (dil) 14.5% 14.6% 15.2% Dividend per $1.02 $1.12 $1.19 $1.25 $1.02 $1.12 $1.19 $1.25 share ($ / share) FY 2018A FY 2019E FY 2020E FY 2021E FY 2018A FY 2019E FY 2020E FY 2021E Acc / (dil) 0.0% 0.0% 0.0% 2.7x 2.7x 2.7x 2.6x 2.7x 2.9x 2.7x 2.6x Net debt / LTM EBITDA FY 2018A FY 2019E FY 2020E FY 2021E FY 2018A FY 2019E FY 2020E FY 2021E Source: Company filings; Equity research consensus projections as of 1/23/19 Note: CFPS based on deconsolidated cash flow from operations plus APU distributions paid to UGI; Assumes only 50% of reinvestment EBITDA in year one U G I 6
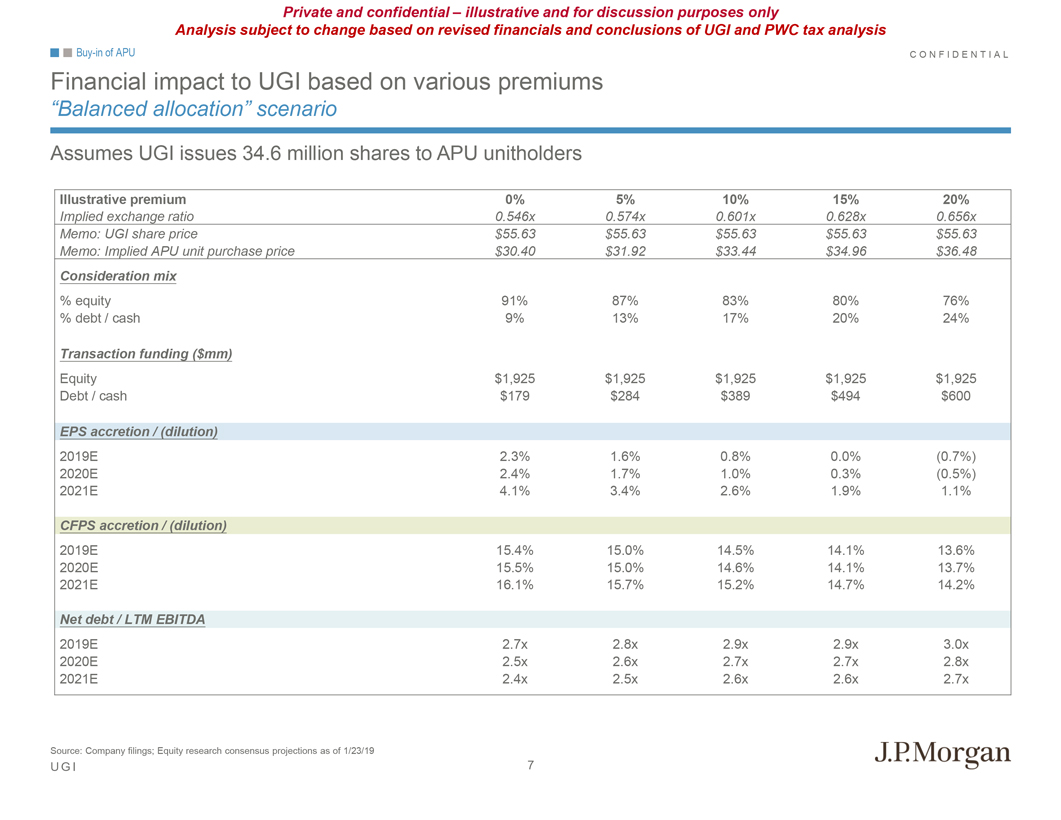
Private and confidential – illustrative and for discussion purposes only Analysis subject to change based on revised financials and conclusions of UGI and PWC tax analysisBuy-in of APU C O N F I D E N T I A L Financial impact to UGI based on various premiums “Balanced allocation” scenario Assumes UGI issues 34.6 million shares to APU unitholders Illustrative premium 0% 5% 10% 15% 20% Implied exchange ratio 0.546x 0.574x 0.601x 0.628x 0.656x Memo: UGI share price $55.63 $55.63 $55.63 $55.63 $55.63 Memo: Implied APU unit purchase price $30.40 $31.92 $33.44 $34.96 $36.48 Consideration mix % equity 91% 87% 83% 80% 76% % debt / cash 9% 13% 17% 20% 24% Transaction funding ($mm) Equity $1,925 $1,925 $1,925 $1,925 $1,925 Debt / cash $179 $284 $389 $494 $600 EPS accretion / (dilution) 2019E 2.3% 1.6% 0.8% 0.0% (0.7%) 2020E 2.4% 1.7% 1.0% 0.3% (0.5%) 2021E 4.1% 3.4% 2.6% 1.9% 1.1% CFPS accretion / (dilution) 2019E 15.4% 15.0% 14.5% 14.1% 13.6% 2020E 15.5% 15.0% 14.6% 14.1% 13.7% 2021E 16.1% 15.7% 15.2% 14.7% 14.2% Net debt / LTM EBITDA 2019E 2.7x 2.8x 2.9x 2.9x 3.0x 2020E 2.5x 2.6x 2.7x 2.7x 2.8x 2021E 2.4x 2.5x 2.6x 2.6x 2.7x Source: Company filings; Equity research consensus projections as of 1/23/19 U G I 7
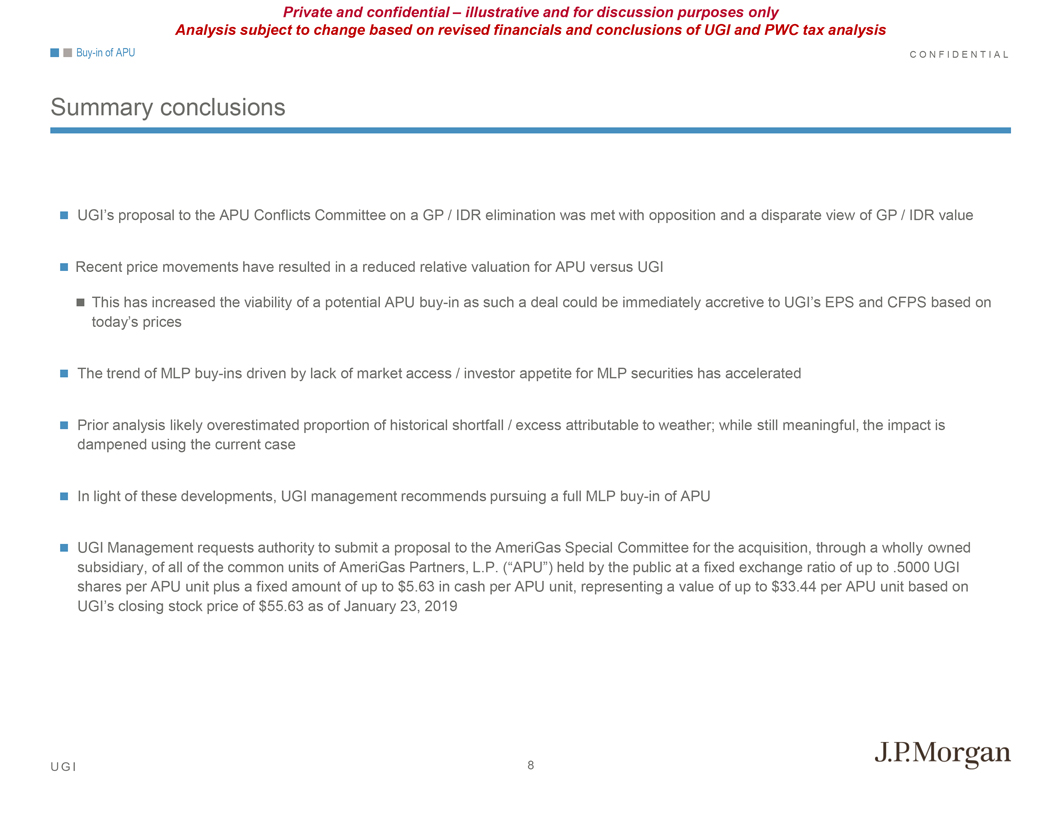
Private and confidential – illustrative and for discussion purposes only Analysis subject to change based on revised financials and conclusions of UGI and PWC tax analysisBuy-in of APU C O N F I D E N T I A L Summary conclusions UGI’s proposal to the APU Conflicts Committee on a GP / IDR elimination was met with opposition and a disparate view of GP / IDR value Recent price movements have resulted in a reduced relative valuation for APU versus UGI This has increased the viability of a potential APUbuy-in as such a deal could be immediately accretive to UGI’s EPS and CFPS based on today’s prices The trend of MLPbuy-ins driven by lack of market access / investor appetite for MLP securities has accelerated Prior analysis likely overestimated proportion of historical shortfall / excess attributable to weather; while still meaningful, the impact is dampened using the current case In light of these developments, UGI management recommends pursuing a full MLPbuy-in of APU UGI Management requests authority to submit a proposal to the AmeriGas Special Committee for the acquisition, through a wholly owned subsidiary, of all of the common units of AmeriGas Partners, L.P. (“APU”) held by the public at a fixed exchange ratio of up to .5000 UGI shares per APU unit plus a fixed amount of up to $5.63 in cash per APU unit, representing a value of up to $33.44 per APU unit based on UGI’s closing stock price of $55.63 as of January 23, 2019 U G I 8
Private and confidential – illustrative and for discussion purposes only Analysis subject to change based on revised financials and conclusions of UGI and PWC tax analysis C O N F I D E N T I A L Agenda Page 1Buy-in of APU 1 2 Appendix 9 Additionalbuy-in of APU considerations 9 U G I
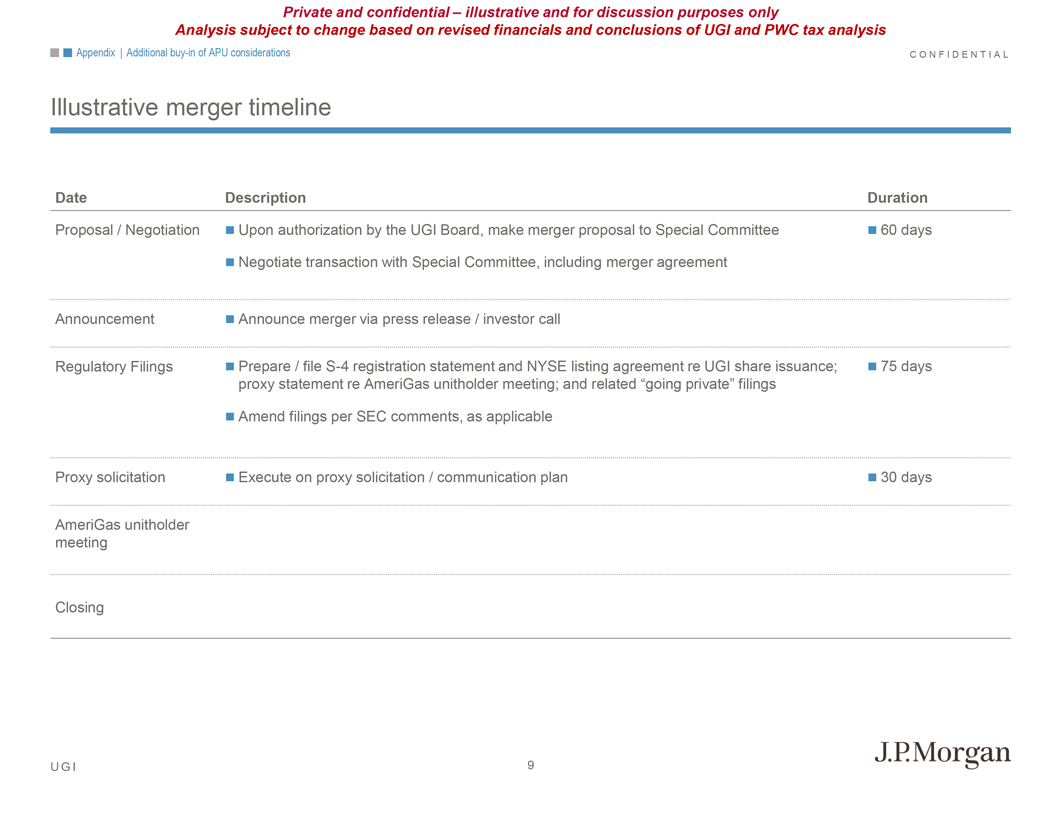
Private and confidential – illustrative and for discussion purposes only Analysis subject to change based on revised financials and conclusions of UGI and PWC tax analysis Appendix | Additionalbuy-in of APU considerations C O N F I D E N T I A L Illustrative merger timeline Date Description Duration Proposal / Negotiation Upon authorization by the UGI Board, make merger proposal to Special Committee 60 days Negotiate transaction with Special Committee, including merger agreement Announcement Announce merger via press release / investor call Regulatory Filings Prepare / fileS-4 registration statement and NYSE listing agreement re UGI share issuance; 75 days proxy statement re AmeriGas unitholder meeting; and related “going private” filings Amend filings per SEC comments, as applicable Proxy solicitation Execute on proxy solicitation / communication plan 30 days AmeriGas unitholder meeting Closing U G I 9
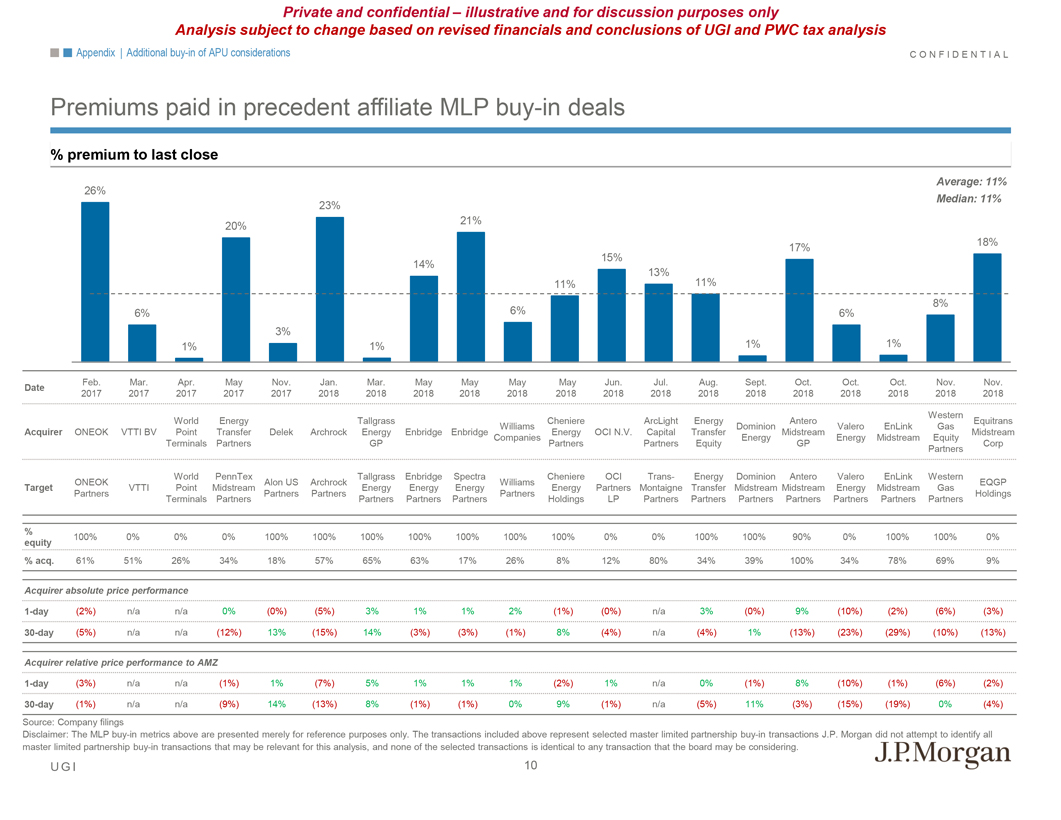
Private and confidential – illustrative and for discussion purposes only Analysis subject to change based on revised financials and conclusions of UGI and PWC tax analysis Appendix | Additionalbuy-in of APU considerations C O N F I D E N T I A L Premiums paid in precedent affiliate MLPbuy-in deals % premium to last close Average: 11% 26% Median: 11% 23% 21% 20% 18% 15% 17% 14% 13% 11% 11% 8% 6% 6% 6% 3% 1% 1% 1% 1% Feb. Mar. Apr. May Nov. Jan. Mar. May May May May Jun. Jul. Aug. Sept. Oct. Oct. Oct. Nov. Nov. Date 2017 2017 2017 2017 2017 2018 2018 2018 2018 2018 2018 2018 2018 2018 2018 2018 2018 2018 2018 2018 Western World Energy Tallgrass Cheniere ArcLight Energy Antero Equitrans Williams Dominion Valero EnLink Gas Acquirer ONEOK VTTI BV Point Transfer Delek Archrock Energy Enbridge Enbridge Energy OCI N.V. Capital Transfer Midstream Midstream Companies Energy Energy Midstream Equity Terminals Partners GP Partners Partners Equity GP Corp Partners World PennTex Tallgrass Enbridge Spectra Cheniere OCI Trans- Energy Dominion Antero Valero EnLink Western ONEOK Alon US Archrock Williams EQGP Target VTTI Point Midstream Energy Energy Energy Energy Partners Montaigne Transfer Midstream Midstream Energy Midstream Gas Partners Partners Partners Partners Holdings Terminals Partners Partners Partners Partners Holdings LP Partners Partners Partners Partners Partners Partners Partners % 100% 0% 0% 0% 100% 100% 100% 100% 100% 100% 100% 0% 0% 100% 100% 90% 0% 100% 100% 0% equity % acq. 61% 51% 26% 34% 18% 57% 65% 63% 17% 26% 8% 12% 80% 34% 39% 100% 34% 78% 69% 9% Acquirer absolute price performance1-day (2%) n/a n/a 0% (0%) (5%) 3% 1% 1% 2% (1%) (0%) n/a 3% (0%) 9% (10%) (2%) (6%) (3%)30-day (5%) n/a n/a (12%) 13% (15%) 14% (3%) (3%) (1%) 8% (4%) n/a (4%) 1% (13%) (23%) (29%) (10%) (13%) Acquirer relative price performance to AMZ1-day (3%) n/a n/a (1%) 1% (7%) 5% 1% 1% 1% (2%) 1% n/a 0% (1%) 8% (10%) (1%) (6%) (2%)30-day (1%) n/a n/a (9%) 14% (13%) 8% (1%) (1%) 0% 9% (1%) n/a (5%) 11% (3%) (15%) (19%) 0% (4%) Source: Company filings Disclaimer: The MLPbuy-in metrics above are presented merely for reference purposes only. The transactions included above represent selected master limited partnershipbuy-in transactions J.P. Morgan did not attempt to identify all master limited partnershipbuy-in transactions that may be relevant for this analysis, and none of the selected transactions is identical to any transaction that the board may be considering. U G I 10
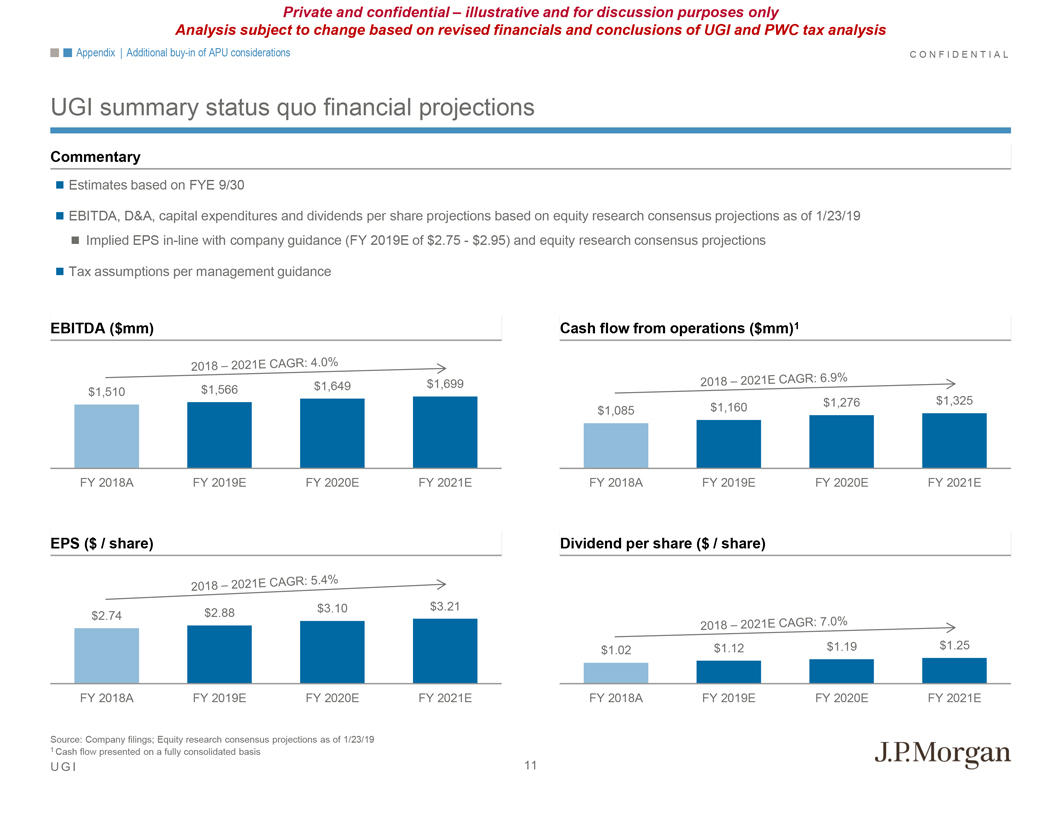
Private and confidential – illustrative and for discussion purposes only Analysis subject to change based on revised financials and conclusions of UGI and PWC tax analysis Appendix | Additionalbuy-in of APU considerations C O N F I D E N T I A L UGI summary status quo financial projections Commentary Estimates based on FYE 9/30 EBITDA, D&A, capital expenditures and dividends per share projections based on equity research consensus projections as of 1/23/19 Implied EPSin-line with company guidance (FY 2019E of $2.75 - $2.95) and equity research consensus projections Tax assumptions per management guidance EBITDA ($mm) Cash flow from operations ($mm)1 $1,649 $1,699 $1,510 $1,566 $1,325 $1,160 $1,276 $1,085 FY 2018A FY 2019E FY 2020E FY 2021E FY 2018A FY 2019E FY 2020E FY 2021E EPS ($ / share) Dividend per share ($ / share) $3.10 $3.21 $2.74 $2.88 $1.02 $1.12 $1.19 $1.25 FY 2018A FY 2019E FY 2020E FY 2021E FY 2018A FY 2019E FY 2020E FY 2021E Source: Company filings; Equity research consensus projections as of 1/23/19 1 Cash flow presented on a fully consolidated basis U G I 11
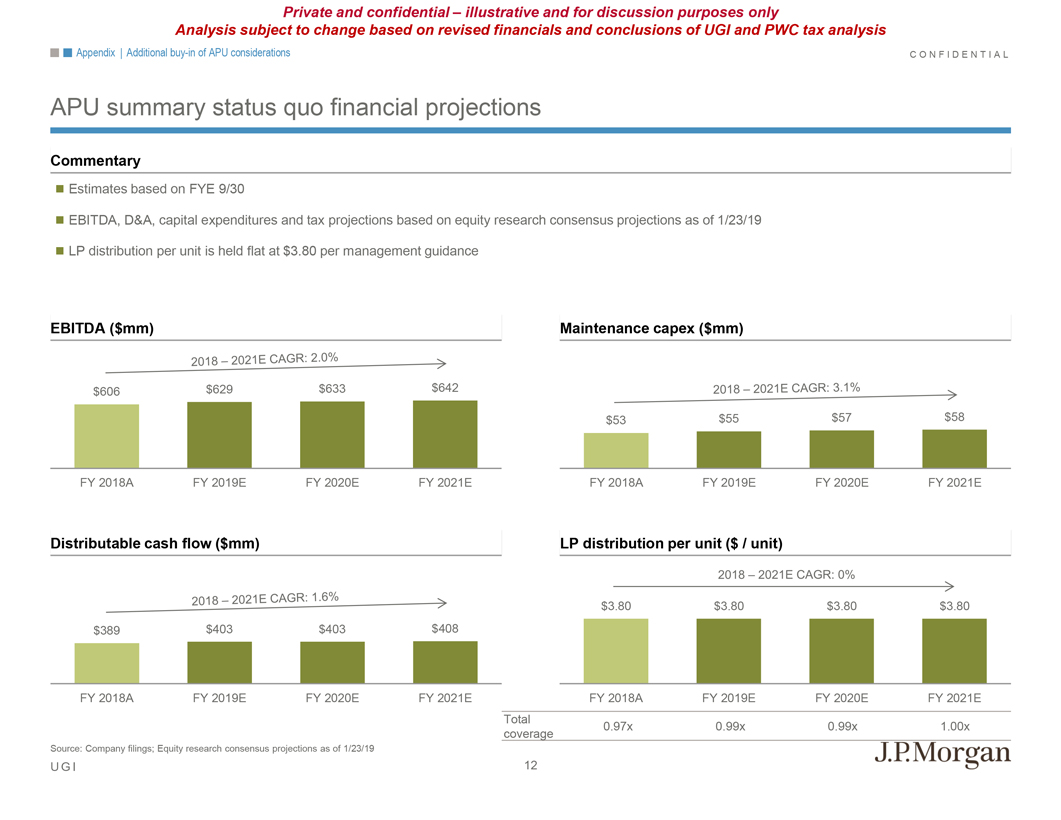
Private and confidential – illustrative and for discussion purposes only Analysis subject to change based on revised financials and conclusions of UGI and PWC tax analysis Appendix | Additionalbuy-in of APU considerations C O N F I D E N T I A L APU summary status quo financial projections Commentary Estimates based on FYE 9/30 EBITDA, D&A, capital expenditures and tax projections based on equity research consensus projections as of 1/23/19 LP distribution per unit is held flat at $3.80 per management guidance EBITDA ($mm) Maintenance capex ($mm) $606 $629 $633 $642 $53 $55 $57 $58 FY 2018A FY 2019E FY 2020E FY 2021E FY 2018A FY 2019E FY 2020E FY 2021E Distributable cash flow ($mm) LP distribution per unit ($ / unit) $3.80 $3.80 $3.80 $3.80 $389 $403 $403 $408 FY 2018A FY 2019E FY 2020E FY 2021E FY 2018A FY 2019E FY 2020E FY 2021E Total 0.97x 0.99x 0.99x 1.00x coverage Source: Company filings; Equity research consensus projections as of 1/23/19 U G I 12
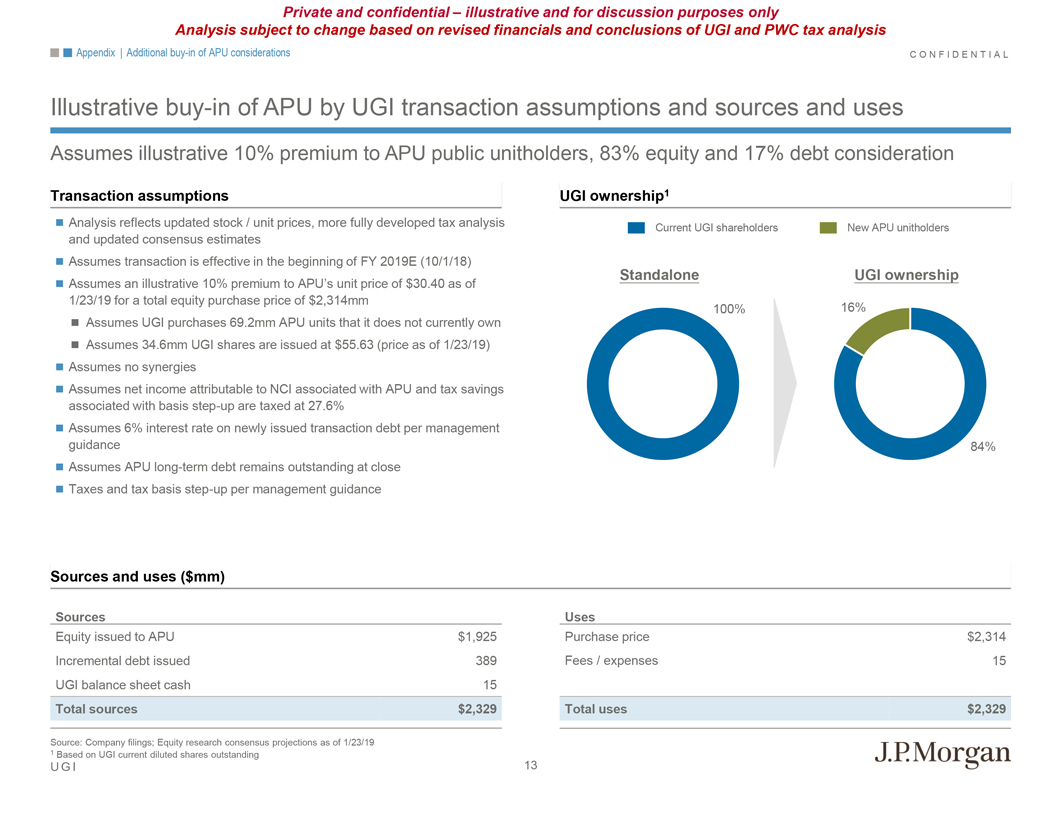
Private and confidential – illustrative and for discussion purposes only Analysis subject to change based on revised financials and conclusions of UGI and PWC tax analysis Appendix | Additionalbuy-in of APU considerations C O N F I D E N T I A L Illustrativebuy-in of APU by UGI transaction assumptions and sources and uses Assumes illustrative 10% premium to APU public unitholders, 83% equity and 17% debt consideration Transaction assumptions UGI ownership1 Analysis reflects updated stock / unit prices, more fully developed tax analysis Current UGI shareholders New APU unitholders and updated consensus estimates Assumes transaction is effective in the beginning of FY 2019E (10/1/18) Standalone UGI ownership Assumes an illustrative 10% premium to APU’s unit price of $30.40 as of 1/23/19 for a total equity purchase price of $2,314mm 100% 16% Assumes UGI purchases 69.2mm APU units that it does not currently own Assumes 34.6mm UGI shares are issued at $55.63 (price as of 1/23/19) Assumes no synergies Assumes net income attributable to NCI associated with APU and tax savings associated with basisstep-up are taxed at 27.6% Assumes 6% interest rate on newly issued transaction debt per management guidance 84% Assumes APU long-term debt remains outstanding at close Taxes and tax basisstep-up per management guidance Sources and uses ($mm) Sources Uses Equity issued to APU $1,925 Purchase price $2,314 Incremental debt issued 389 Fees / expenses 15 UGI balance sheet cash 15 Total sources $2,329 Total uses $2,329 Source: Company filings; Equity research consensus projections as of 1/23/19 1 Based on UGI current diluted shares outstanding U G I 13
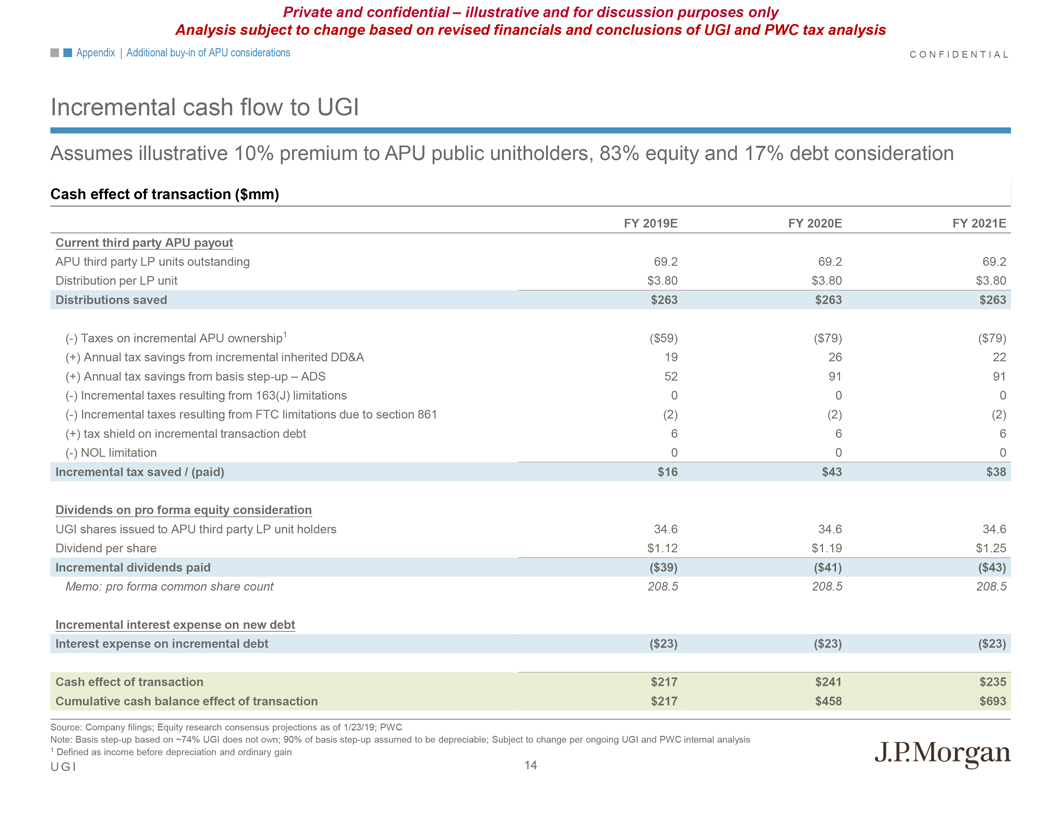
Private and confidential – illustrative and for discussion purposes only Analysis subject to change based on revised financials and conclusions of UGI and PWC tax analysis Appendix | Additionalbuy-in of APU considerations C O N F I D E N T I A L Incremental cash flow to UGI Assumes illustrative 10% premium to APU public unitholders, 83% equity and 17% debt consideration Cash effect of transaction ($mm) FY 2019E FY 2020E FY 2021E Current third party APU payout APU third party LP units outstanding 69.2 69.2 69.2 Distribution per LP unit $3.80 $3.80 $3.80 Distributions saved $263 $263 $263 (-) Taxes on incremental APU ownership1 ($59) ($79) ($79) (+) Annual tax savings from incremental inherited DD&A 19 26 22 (+) Annual tax savings from basisstep-up – ADS 52 91 91 (-) Incremental taxes resulting from 163(J) limitations 0 0 0 (-) Incremental taxes resulting from FTC limitations due to section 861 (2) (2) (2) (+) tax shield on incremental transaction debt 6 6 6 (-) NOL limitation 0 0 0 Incremental tax saved / (paid) $16 $43 $38 Dividends on pro forma equity consideration UGI shares issued to APU third party LP unit holders 34.6 34.6 34.6 Dividend per share $1.12 $1.19 $1.25 Incremental dividends paid ($39) ($41) ($43) Memo: pro forma common share count 208.5 208.5 208.5 Incremental interest expense on new debt Interest expense on incremental debt ($23) ($23) ($23) Cash effect of transaction $217 $241 $235 Cumulative cash balance effect of transaction $217 $458 $693 Source: Company filings; Equity research consensus projections as of 1/23/19; PWC Note: Basisstep-up based on ~74% UGI does not own; 90% of basisstep-up assumed to be depreciable; Subject to change per ongoing UGI and PWC internal analysis 1 Defined as income before depreciation and ordinary gain U G I 14
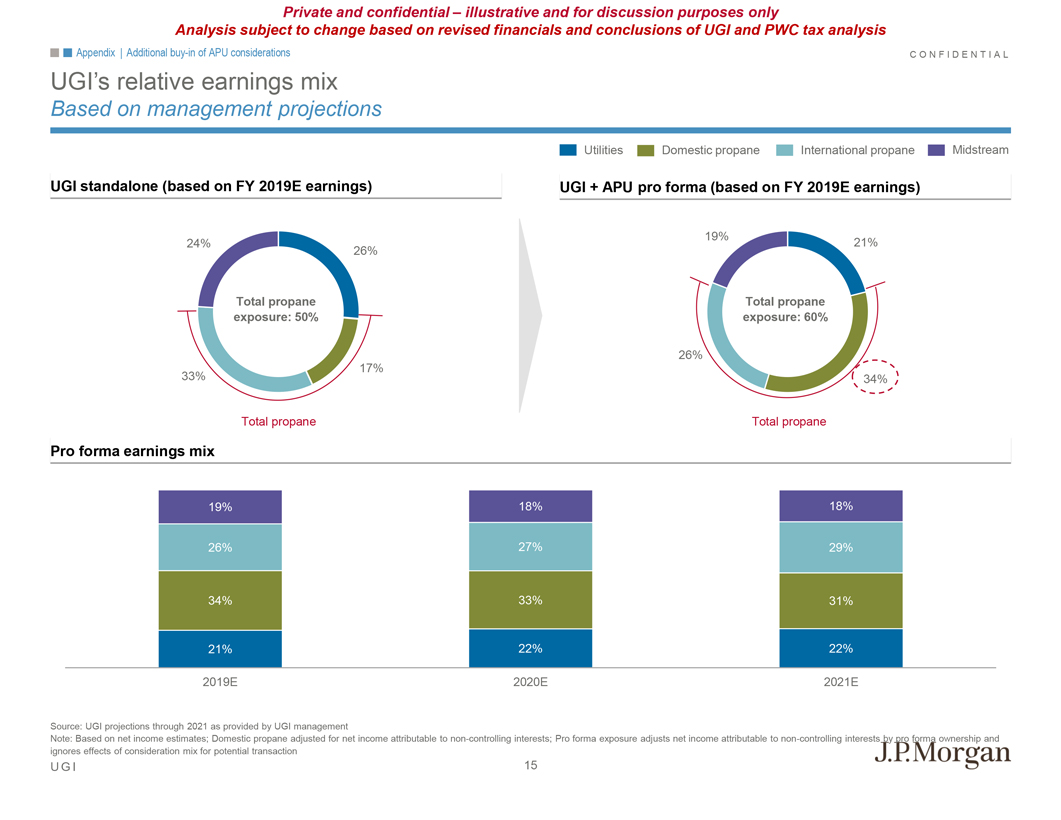
Private and confidential – illustrative and for discussion purposes only Analysis subject to change based on revised financials and conclusions of UGI and PWC tax analysis Appendix | Additionalbuy-in of APU considerations C O N F I D E N T I A L UGI’s relative earnings mix Based on management projections Utilities Domestic propane International propane Midstream UGI standalone (based on FY 2019E earnings) UGI + APU pro forma (based on FY 2019E earnings) 19% 24% 21% 26% Total propane Total propane exposure: 50% exposure: 60% 26% 17% 33% 34% Total propane Total propane Pro forma earnings mix 19% 18% 18% 26% 27% 29% 34% 33% 31% 21% 22% 22% 2019E 2020E 2021E Source: UGI projections through 2021 as provided by UGI management Note: Based on net income estimates; Domestic propane adjusted for net income attributable tonon-controlling interests; Pro forma exposure adjusts net income attributable tonon-controlling interests by pro forma ownership and ignores effects of consideration mix for potential transaction U G I 15


