Exhibit (c)(16)

PRELIMINARY CONFIDENTIAL DRAFT Subject to Further Review & Revision
Project Rushmore Discussion Materials
March 13th, 2019
TUDORPICKERING HOLT&CO ENERGY INVESTMENT & MERCHANT BANKING
PRELIMINARY CONFIDENTIAL DRAFT Subject to Further Review & Revision
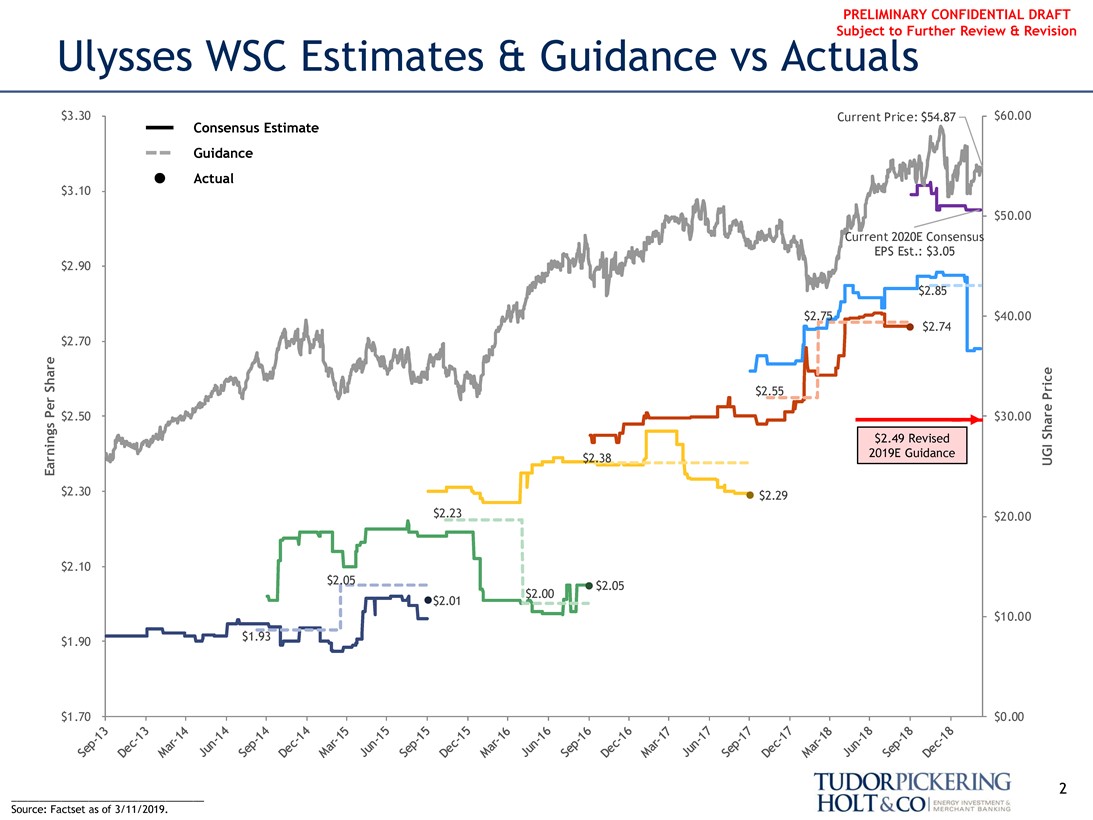
Ulysses WSC Estimates & Guidance vs Actuals
$3.30 Consensus Estimate Current Price: $54.87 $60.00
Guidance
$3.10 Actual $50.00 Current 2020E Consensus EPS Est.: $3.05
$2.90
$2.85
$2.75 $40.00
$2.74
$2.70
UGI Share Price
$2.55
$2.50 $30.00
$2.49 Revised
Earning Per Share
$2.38 2019E Guidance
$2.30 $2.29
$2.23 $20.00
$2.10
$2.05 $2.05
$2.00
$2.01 $10.00
$1.90 $1.93
$1.70 $0.00
2
Sep-13
Dec-13
Mar-14
Jun-14
Sep-14
Dec-14
Mar-15
Jun-15
Sep-15
Dec-15
Mar-16
Jun-16
Sep-16
Dec-16
Mar-17
Jun-17
Sep-17
Dec-17
Mar-18
Jun-18
Sep-18
Dec-18
Source: Factset as of 3/11/2019.
TUDORPICKERING HOLT&CO ENERGY INVESTMENT & MERCHANT BANKING
PRELIMINARY CONFIDENTIAL DRAFT Subject to Further Review & Revision
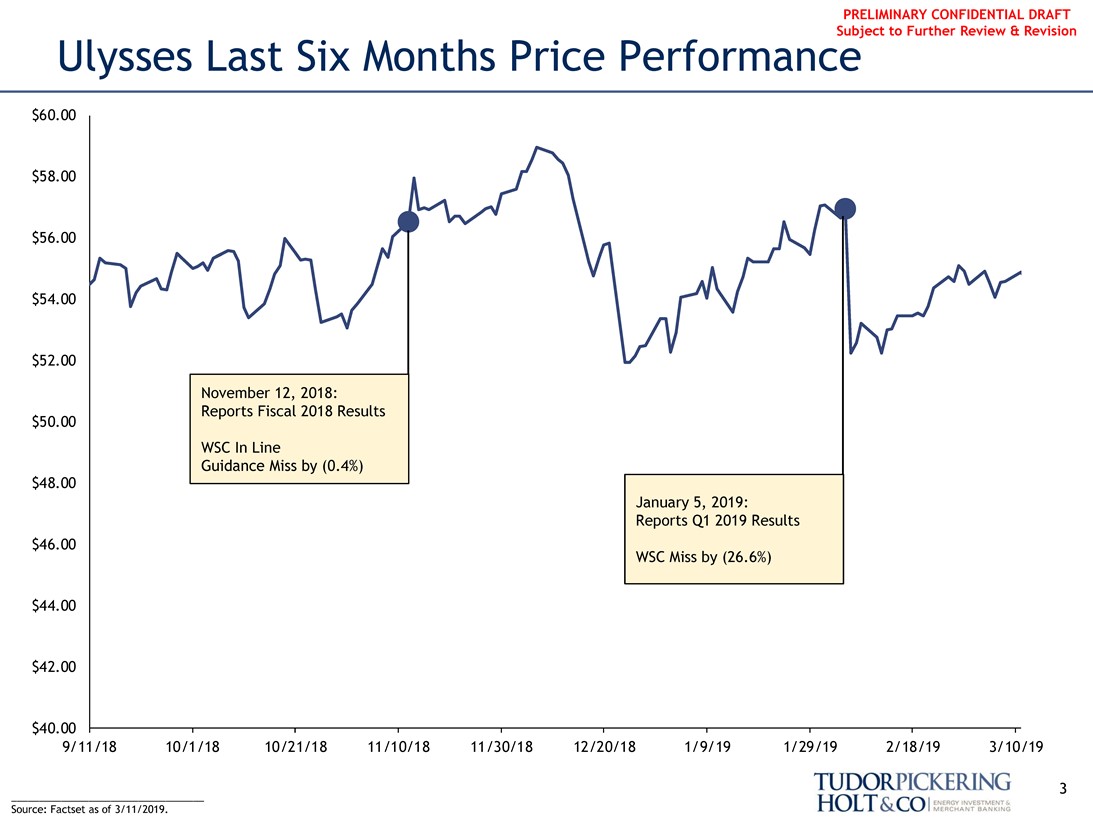
Ulysses Last Six Months Price Performance
$60.00 $58.00 $56.00 $54.00
$52.00
November 12, 2018: Reports Fiscal 2018 Results $50.00
WSC In Line
Guidance Miss by (0.4%) $48.00
January 5, 2019: Reports Q1 2019 Results $46.00
WSC Miss by (26.6%) $44.00 $42.00
$40.00
9/11/18 10/1/18 10/21/18 11/10/18 11/30/18 12/20/18 1/9/19 1/29/19 2/18/19 3/10/19
3
Source: Factset as of 3/11/2019.
TUDORPICKERING HOLT&CO ENERGY INVESTMENT & MERCHANT BANKING
PRELIMINARY CONFIDENTIAL DRAFT Subject to Further Review & Revision
Ulysses Q1 Results Analyst Commentary
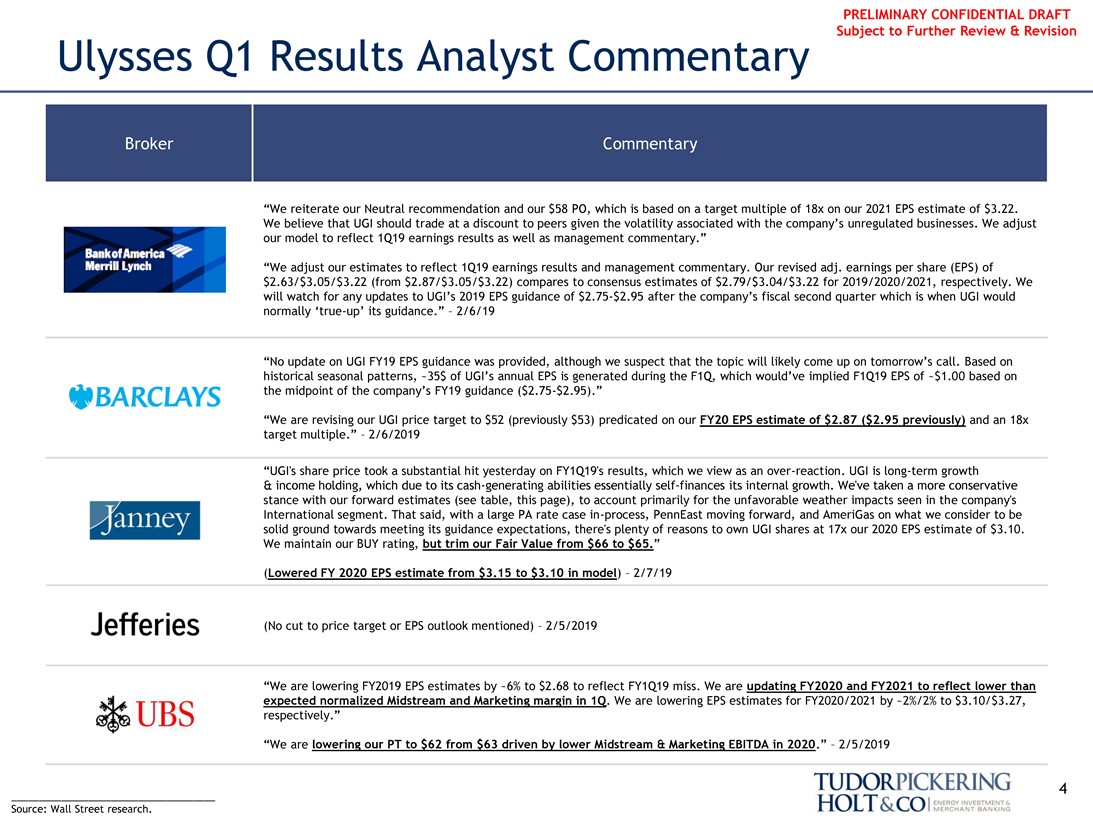
“We reiterate our Neutral recommendation and our $58 PO, which is based on a target multiple of 18x on our 2021 EPS estimate of $3.22. We believe that UGI should trade at a discount to peers given the volatility associated with the company’s unregulated businesses. We adjust our model to reflect 1Q19 earnings results as well as management commentary.”
“We adjust our estimates to reflect 1Q19 earnings results and management commentary. Our revised adj. earnings per share (EPS) of $2.63/$3.05/$3.22 (from $2.87/$3.05/$3.22) compares to consensus estimates of $2.79/$3.04/$3.22 for 2019/2020/2021, respectively. We will watch for any updates to UGI’s 2019 EPS guidance of$2.75-$2.95 after the company’s fiscal second quarter which is when UGI would normally‘true-up’ its guidance.” – 2/6/19
“No update on UGI FY19 EPS guidance was provided, although we suspect that the topic will likely come up on tomorrow’s call. Based on historical seasonal patterns, ~35$ of UGI’s annual EPS is generated during the F1Q, which would’ve implied F1Q19 EPS of ~$1.00 based on the midpoint of the company’s FY19 guidance($2.75-$2.95).”
“We are revising our UGI price target to $52 (previously $53) predicated on our FY20 EPS estimate of $2.87 ($2.95 previously) and an 18x target multiple.” – 2/6/2019
“UGI’s share price took a substantial hit yesterday on FY1Q19’s results, which we view as an over-reaction. UGI is long-term growth
& income holding, which due to its cash-generating abilities essentially self-finances its internal growth. We’ve taken a more conservative stance with our forward estimates (see table, this page), to account primarily for the unfavorable weather impacts seen in the company’s International segment. That said, with a large PA rate casein-process, PennEast moving forward, and AmeriGas on what we consider to be solid ground towards meeting its guidance expectations, there’s plenty of reasons to own UGI shares at 17x our 2020 EPS estimate of $3.10. We maintain our BUY rating, but trim our Fair Value from $66 to $65.”
(Lowered FY 2020 EPS estimate from $3.15 to $3.10 in model) – 2/7/19
(No cut to price target or EPS outlook mentioned) – 2/5/2019
“We are lowering FY2019 EPS estimates by ~6% to $2.68 to reflect FY1Q19 miss. We are updating FY2020 and FY2021 to reflect lower than expected normalized Midstream and Marketing margin in 1Q. We are lowering EPS estimates for FY2020/2021 by ~2%/2% to $3.10/$3.27, respectively.”
“We are lowering our PT to $62 from $63 driven by lower Midstream & Marketing EBITDA in 2020.” – 2/5/2019
4
Source: Wall Street research.
TUDORPICKERING HOLT&CO ENERGY INVESTMENT & MERCHANT BANKING
PRELIMINARY CONFIDENTIAL DRAFT Subject to Further Review & Revision
Appendix
5
TUDORPICKERING HOLT&CO ENERGY INVESTMENT & MERCHANT BANKING
Fiscal 2019 First Quarter Results
John L. Walsh
President & CEO, UGI Corporation
Ted J. Jastrzebski
Chief Financial Officer, UGI Corporation
Hugh J. Gallagher
President & CEO, AmeriGas
About This Presentation
This presentation contains certain forward-looking statements that management believes to be reasonable as of today’s date only. Actual results may differ significantly because of risks and uncertainties that are difficult to predict and many of which are beyond management’s control. You should read UGI’s Annual Report on Form10-K for a more extensive list of factors that could affect results. Among them are adverse weather conditions, cost volatility and availability of all energy products, including propane, natural gas, electricity and fuel oil, increased customer conservation measures, the impact of pending and future legal proceedings, continued analysis of recent tax legislation, liability for uninsured claims and for claims in excess of insurance
coverage, domestic and international political, regulatory and economic conditions in the United States and in foreign countries, including the current conflicts in the Middle East, and foreign currency exchange rate fluctuations (particularly the euro), changes in Marcellus Shale gas production, the availability, timing and success of our acquisitions, commercial initiatives and
investments to grow our business, our ability to successfully integrate acquired businesses and achieve anticipated synergies, and the interruption, disruption, failure, malfunction, or breach of our information technology systems, including due to cyber-attack. UGI undertakes no obligation to release revisions to its forward-looking statements to reflect events or circumstances occurring after today. In addition, this presentation uses certainnon-GAAP financial measures. Please see the appendix for reconciliations of these measures to the most comparable GAAP financial measure.
UGI Corporation | Fiscal 2019 First Quarter Results 2
First Quarter Recap
John L. Walsh
President & CEO, UGI
First Quarter Earnings Recap
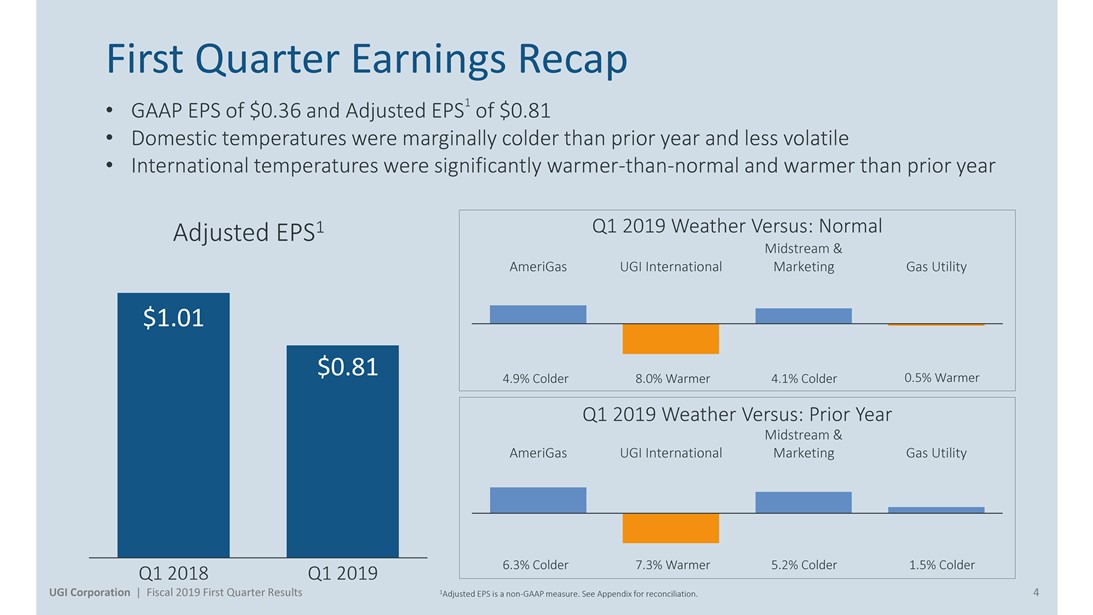
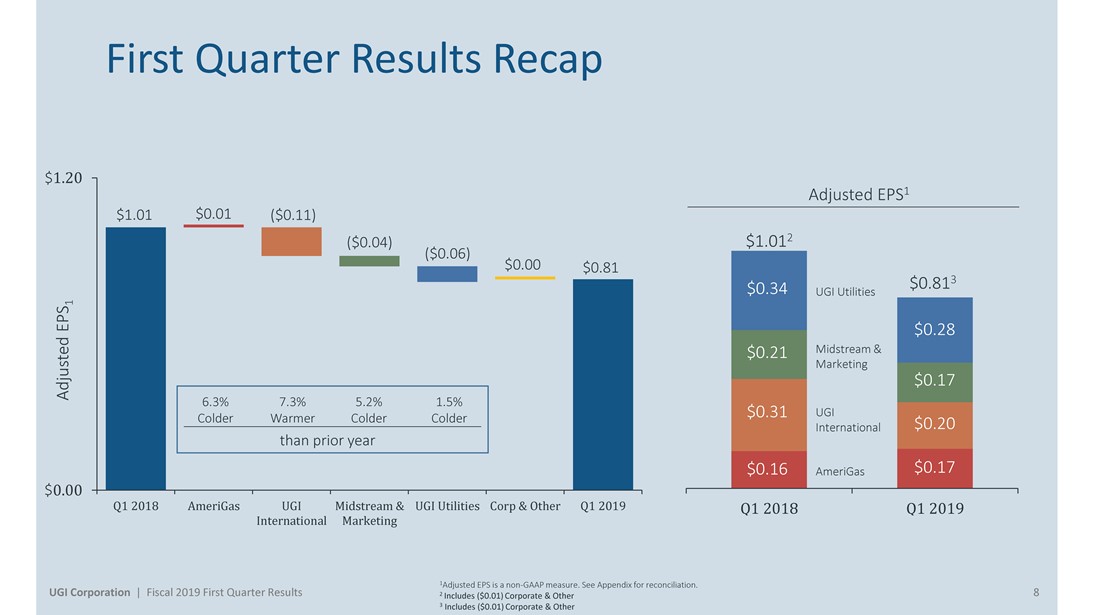
• GAAP EPS of $0.36 and Adjusted EPS1 of $0.81
• Domestic temperatures were marginally colder than prior year and less volatile
• International temperatures were significantly warmer-than-normal and warmer than prior year
Adjusted EPS1 Q1 2019 Weather Versus: Normal
Midstream &
AmeriGas UGI International Marketing Gas Utility
4.9% Colder 8.0% Warmer 4.1% Colder 0.5% Warmer
Q1 2019 Weather Versus: Prior Year
Midstream &
AmeriGas UGI International Marketing Gas Utility
6.3% Colder 7.3% Warmer 5.2% Colder 1.5% Colder
$1.01
$0.81
Q1 2018 Q1 2019
UGI Corporation | Fiscal 2019 First Quarter Results 1Adjusted EPS is anon-GAAP measure. See Appendix for reconciliation. 4
Key Accomplishments
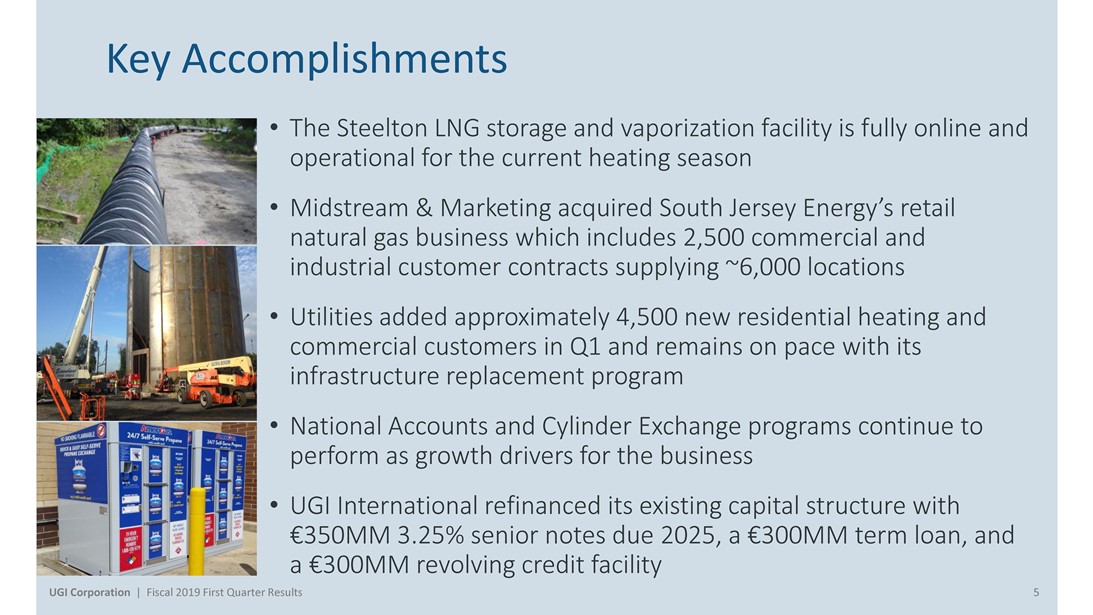
• The Steelton LNG storage and vaporization facility is fully online and operational for the current heating season
• Midstream & Marketing acquired South Jersey Energy’s retail natural gas business which includes 2,500 commercial and industrial customer contracts supplying ~6,000 locations
• Utilities added approximately 4,500 new residential heating and commercial customers in Q1 and remains on pace with its infrastructure replacement program
• National Accounts and Cylinder Exchange programs continue to perform as growth drivers for the business
• UGI International refinanced its existing capital structure with
€350MM 3.25% senior notes due 2025, a €300MM term loan, and a €300MM revolving credit facility
UGI Corporation | Fiscal 2019 First Quarter Results 5

First Quarter Financial Review
Ted J. Jastrzebski
Chief Financial Officer, UGI
First Quarter Adjusted Earnings
(Millions of dollars, except per share)
Q1 FY18 Q1 FY19
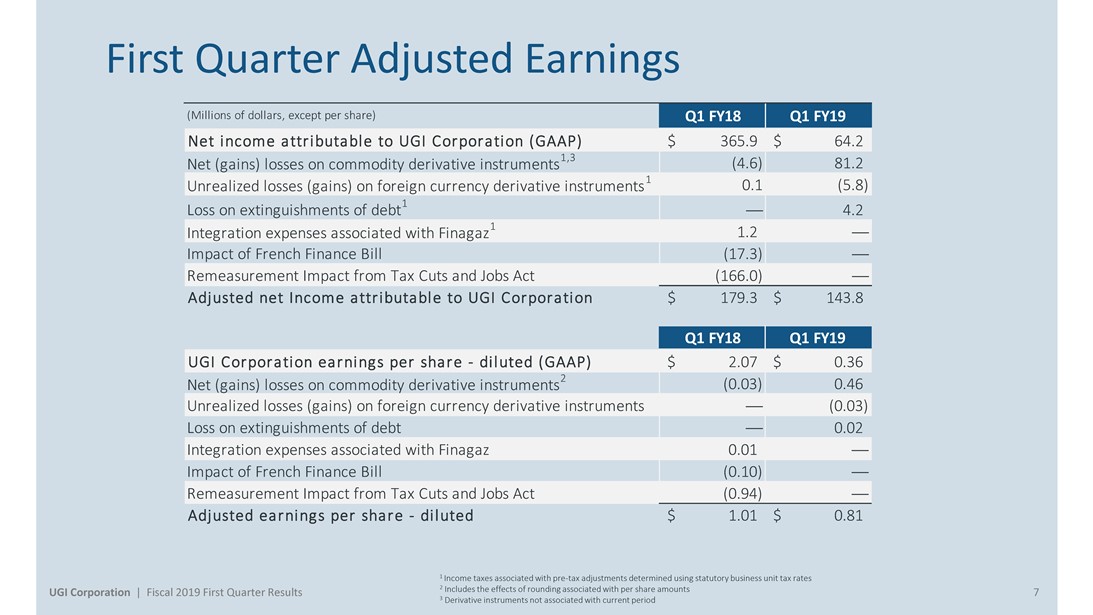
Net income attributable to UGI Corporation (GAAP) $ 365.9 $ 64.2 1,3 (4.6) 81.2 Net (gains) losses on commodity derivative instruments
1 0.1 (5.8) Unrealized losses (gains) on foreign currency derivative instruments
1
Loss on extinguishments of debt — 4.2
1 1.2 — Integration expenses associated with Finagaz Impact of French Finance Bill (17.3) —— Remeasurement Impact from Tax Cuts and Jobs Act (166.0) — Adjusted net Income attributable to UGI Corporation $ 179.3 $ 143.8
UGI Corporation earnings per share—diluted (GAAP) $ 2.07 $ 0.36
2 (0.03) 0.46 Net (gains) losses on commodity derivative instruments Unrealized losses (gains) on foreign currency derivative instruments — (0.03) Loss on extinguishments of debt — 0.02 Integration expenses associated with Finagaz 0.01 — Impact of French Finance Bill (0.10) — Remeasurement Impact from Tax Cuts and Jobs Act (0.94) — Adjusted earnings per share - diluted $ 1.01 $ 0.81
1 Income taxes associated withpre-tax adjustments determined using statutory business unit tax rates
UGI Corporation | Fiscal 2019 First Quarter Results 2 Includes the effects of rounding associated with per share amounts 7
3 Derivative instruments not associated with current period
First Quarter Results Recap
$1.20
Adjusted EPS1
$1.01 $0.01 ($0.11)
($0.04) $1.012
($0.06)
$0.00 $0.81
$0.813
UGI Utilities
EPS1
Midstream & Marketing
Adjusted
6.3% 7.3% 5.2% 1.5%
UGI
Colder Warmer Colder Colder
International
than prior year
AmeriGas
$0.00
Q1 2018 AmeriGas UGI Midstream & UGI Utilities Corp & Other Q1 2019 Q1 2018 Q1 2019
International Marketing
1Adjusted EPS is anon-GAAP measure. See Appendix for reconciliation.
UGI Corporation | Fiscal 2019 First Quarter Results 2 Includes ($0.01) Corporate & Other 8
3 Includes ($0.01) Corporate & Other
Financial Results - AmeriGas
Q1 FY18
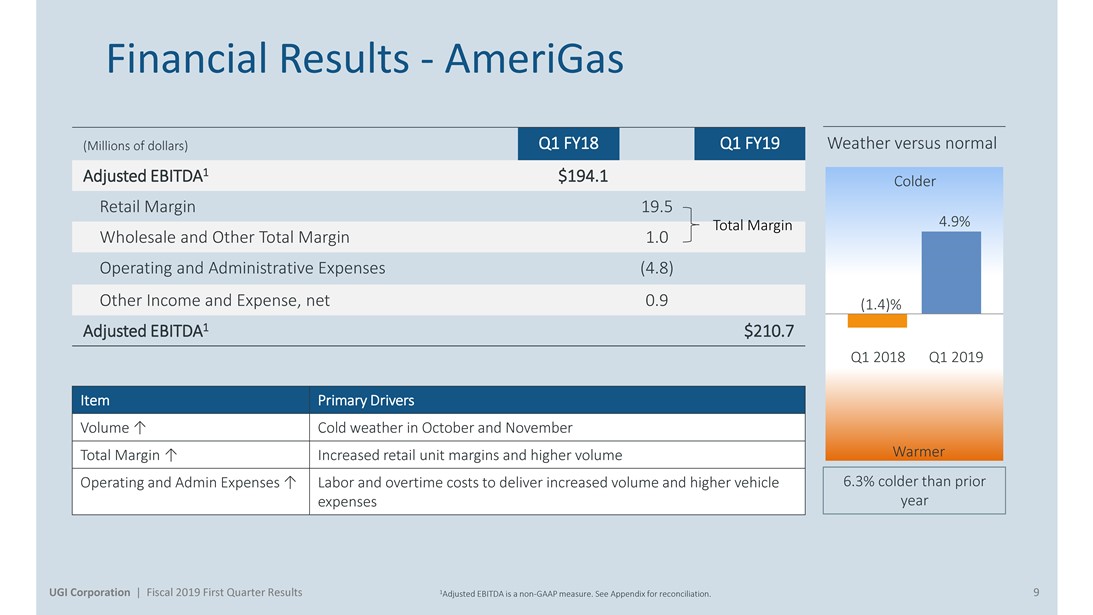
(Millions of dollars) Weather versus normal Adjusted EBITDA1 $194.1
Colder
Q1 FY19
Retail Margin 19.5
Total Margin 4.9%
Wholesale and Other Total Margin 1.0 Operating and Administrative Expenses (4.8)
Other Income and Expense, net 0.9 (1.4)% Adjusted EBITDA1 $210.7
Q1 2018 Q1 2019
Item Primary Drivers
Volume ↑ Cold weather in October and November
Total Margin ↑ Increased retail unit margins and higher volume Warmer Operating and Admin Expenses ↑ Labor and overtime costs to deliver increased volume and higher vehicle 6.3% colder than prior expenses year
UGI Corporation | Fiscal 2019 First Quarter Results 1Adjusted EBITDA is anon-GAAP measure. See Appendix for reconciliation. 9
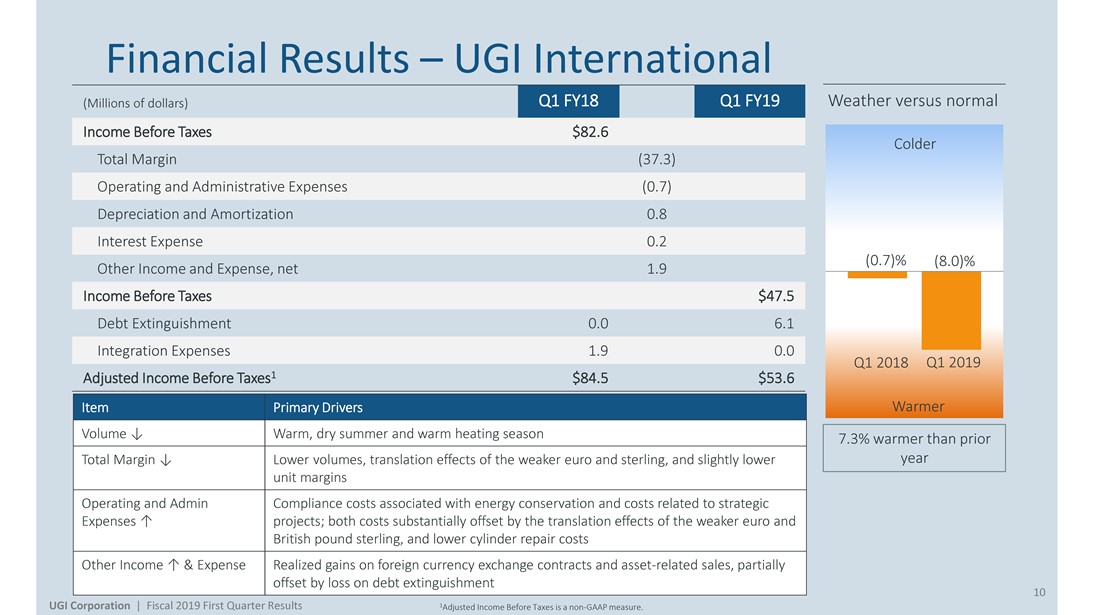
Financial Results – UGI International
(Millions of dollars) Weather versus normal
Q1 FY18 Q1 FY19
Income Before Taxes $82.6 Colder Total Margin (37.3)
Operating and Administrative Expenses (0.7)
Depreciation and Amortization 0.8
Interest Expense 0.2
(0.7)% (8.0)% Other Income and Expense, net 1.9
Income Before Taxes $47.5
Debt Extinguishment 0.0 6.1
Integration Expenses 1.9 0.0 Q1 2018 Q1 2019 Adjusted Income Before Taxes1 $84.5 $53.6
Item Primary Drivers
Warmer Volume ↓ Warm, dry summer and warm heating season 7.3% warmer than prior Total Margin ↓ Lower volumes, translation effects of the weaker euro and sterling, and slightly lower year unit margins
Operating and Admin Compliance costs associated with energy conservation and costs related to strategic Expenses ↑ projects; both costs substantially offset by the translation effects of the weaker euro and British pound sterling, and lower cylinder repair costs
Other Income ↑ & Expense Realized gains on foreign currency exchange contracts and asset-related sales, partially offset by loss on debt extinguishment 10
UGI Corporation | Fiscal 2019 First Quarter Results 1Adjusted Income Before Taxes is anon-GAAP measure.
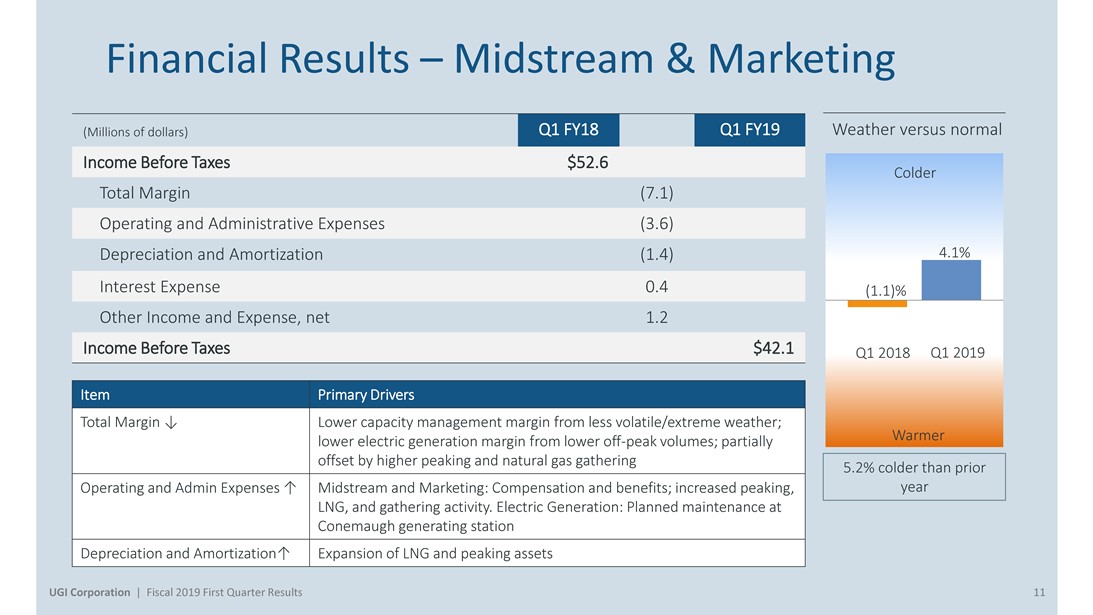
Financial Results – Midstream & Marketing
Q1 FY18 Q1 FY19
(Millions of dollars) Weather versus normal Income Before Taxes $52.6
Colder
Total Margin (7.1) Operating and Administrative Expenses (3.6)
Depreciation and Amortization (1.4) 4.1%
Interest Expense 0.4 (1.1)% Other Income and Expense, net 1.2
Income Before Taxes $42.1 Q1 2018 Q1 2019
Item Primary Drivers
Total Margin ↓ Lower capacity management margin from less volatile/extreme weather; lower electric generation margin from loweroff-peak volumes; partially Warmer offset by higher peaking and natural gas gathering 5.2% colder than prior Operating and Admin Expenses ↑ Midstream and Marketing: Compensation and benefits; increased peaking, year LNG, and gathering activity. Electric Generation: Planned maintenance at Conemaugh generating station
Depreciation and Amortization↑ Expansion of LNG and peaking assets
UGI Corporation | Fiscal 2019 First Quarter Results 11
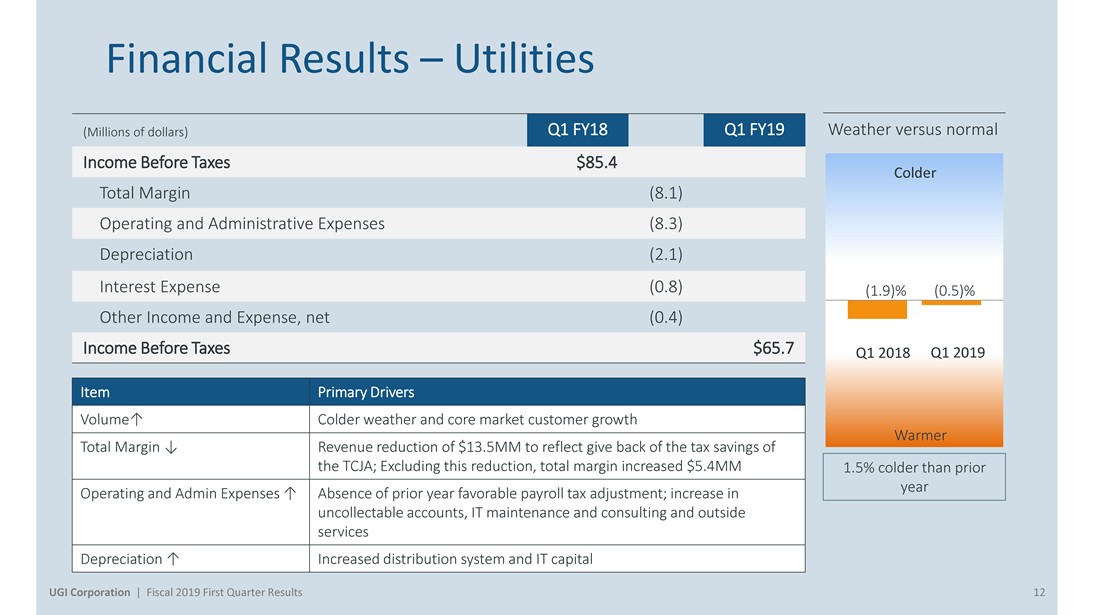
Financial Results – Utilities
(Millions of dollars) Weather versus normal Income Before Taxes $85.4
Colder
Total Margin (8.1) Operating and Administrative Expenses (8.3) Depreciation (2.1)
Interest Expense (0.8) (1.9)% (0.5)% Other Income and Expense, net (0.4) Income Before Taxes $65.7 Q1 2018 Q1 2019
Volume↑ Colder weather and core market customer growth
Total Margin ↓ Revenue reduction of $13.5MM to reflect give back of the tax savings of Warmer the TCJA; Excluding this reduction, total margin increased $5.4MM 1.5% colder than prior year Operating and Admin Expenses ↑ Absence of prior year favorable payroll tax adjustment; increase in uncollectable accounts, IT maintenance and consulting and outside services
Depreciation ↑ Increased distribution system and IT capital
UGI Corporation | Fiscal 2019 First Quarter Results 12
AmeriGas First Quarter Recap
Hugh J. Gallagher
President and CEO, AmeriGas
First Quarter Earnings Recap
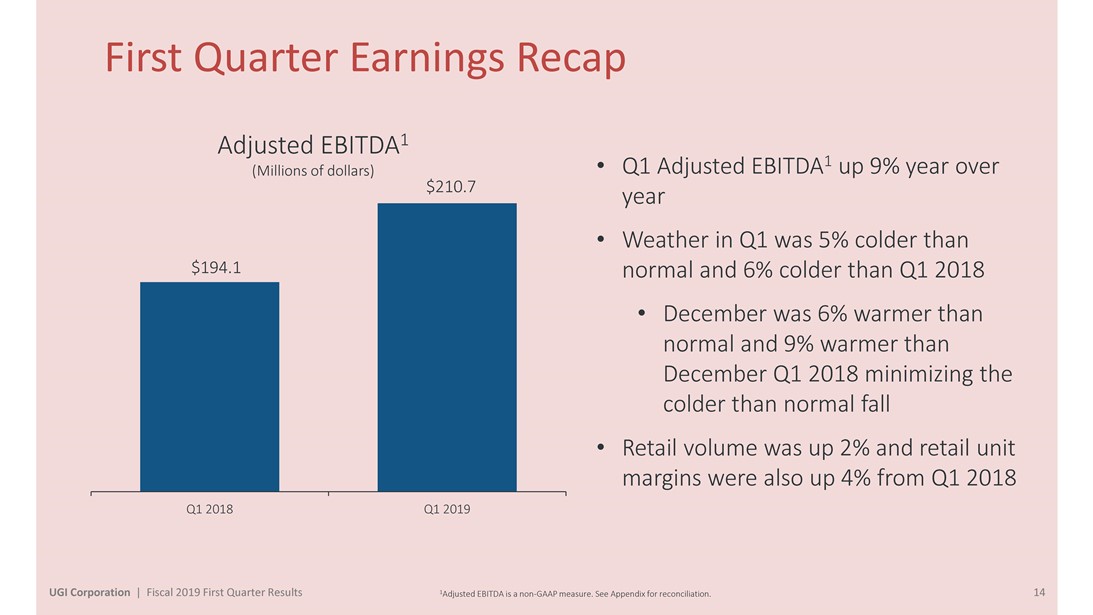
Adjusted EBITDA1
• Q1 Adjusted EBITDA1 up 9% year over
(Millions of dollars) $210.7 year
• Weather in Q1 was 5% colder than $194.1 normal and 6% colder than Q1 2018
• December was 6% warmer than normal and 9% warmer than December Q1 2018 minimizing the colder than normal fall
• Retail volume was up 2% and retail unit margins were also up 4% from Q1 2018
Q1 2018 Q1 2019
UGI Corporation | Fiscal 2019 First Quarter Results 1Adjusted EBITDA is anon-GAAP measure. See Appendix for reconciliation. 14
Growth Initiatives
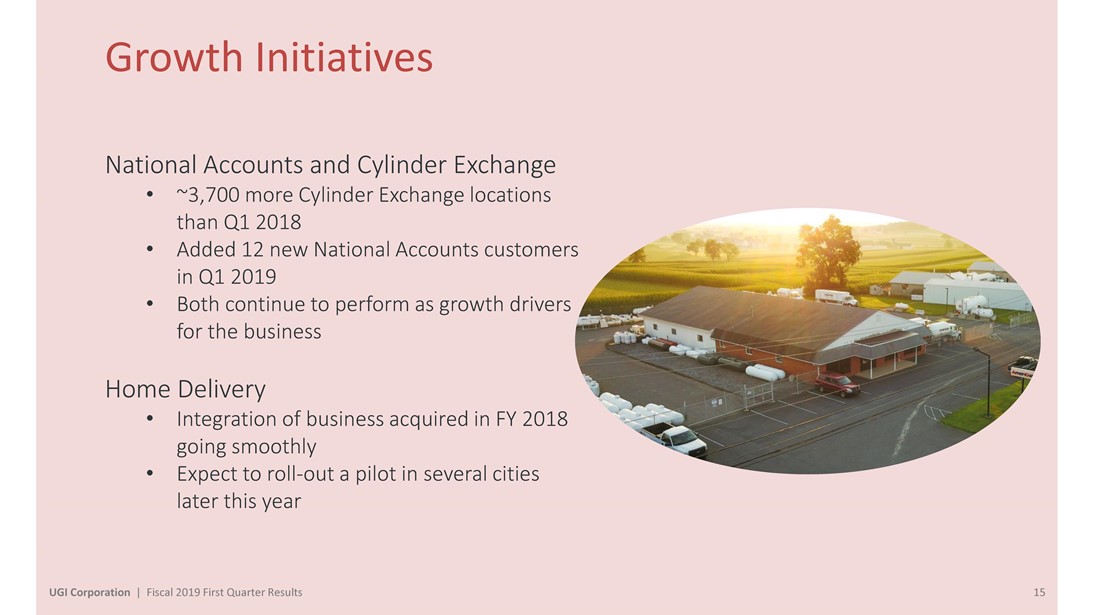
National Accounts and Cylinder Exchange
• ~3,700 more Cylinder Exchange locations than Q1 2018
• Added 12 new National Accounts customers in Q1 2019
• Both continue to perform as growth drivers for the business
Home Delivery
• Integration of business acquired in FY 2018 going smoothly
• Expect toroll-out a pilot in several cities later this year
UGI Corporation | Fiscal 2019 First Quarter Results 15
Conclusion and Q&A
John L. Walsh
President & CEO, UGI
Strategic Overview
• The PennEast Partnership submitted its PA DEP permit application and received approval to perform necessary surveys on the privately owned properties in
NJ. We expect to have the pipeline in service by the end of 2020
• New Bethlehem LNG storage and vaporization will come online for the winter of
FY21
• The Auburn Gathering System expansion is expected to be completed in the first quarter of FY20
• UGI Utilities filed the first combined rate case for the Gas Utility
• Request is for $71.1MM increase in operating revenues
• UGI Utilities plans to deploy close to $400MM in capital expenditure in FY19 and $1.6B in capital over the next 4 years
• AmeriGas strategic review is progressing and we are on track to provide an update following the conclusion of our review in April
UGI Corporation | Fiscal 2019 First Quarter Results 17

Q&A
Appendix
UGI Supplemental Footnotes
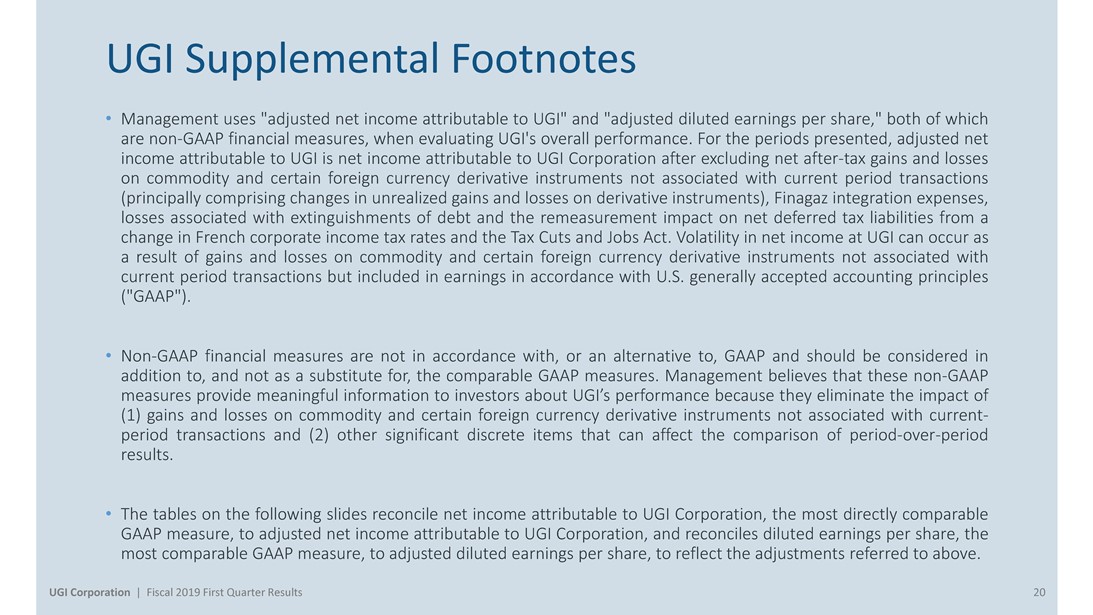
• Management uses “adjusted net income attributable to UGI” and “adjusted diluted earnings per share,” both of which arenon-GAAP financial measures, when evaluating UGI’s overall performance. For the periods presented, adjusted net income attributable to UGI is net income attributable to UGI Corporation after excluding netafter-tax gains and losses on commodity and certain foreign currency derivative instruments not associated with current period transactions (principally comprising changes in unrealized gains and losses on derivative instruments), Finagaz integration expenses, losses associated with extinguishments of debt and the remeasurement impact on net deferred tax liabilities from a change in French corporate income tax rates and the Tax Cuts and Jobs Act. Volatility in net income at UGI can occur as a result of gains and losses on commodity and certain foreign currency derivative instruments not associated with current period transactions but included in earnings in accordance with U.S. generally accepted accounting principles (“GAAP”).
•Non-GAAP financial measures are not in accordance with, or an alternative to, GAAP and should be considered in addition to, and not as a substitute for, the comparable GAAP measures. Management believes that thesenon-GAAP measures provide meaningful information to investors about UGI’s performance because they eliminate the impact of (1) gains and losses on commodity and certain foreign currency derivative instruments not associated with current-
period transactions and (2) other significant discrete items that can affect the comparison of period-over-period results.
• The tables on the following slides reconcile net income attributable to UGI Corporation, the most directly comparable GAAP measure, to adjusted net income attributable to UGI Corporation, and reconciles diluted earnings per share, the most comparable GAAP measure, to adjusted diluted earnings per share, to reflect the adjustments referred to above.
UGI Corporation | Fiscal 2019 First Quarter Results 20
UGI Adjusted Net Income and EPS
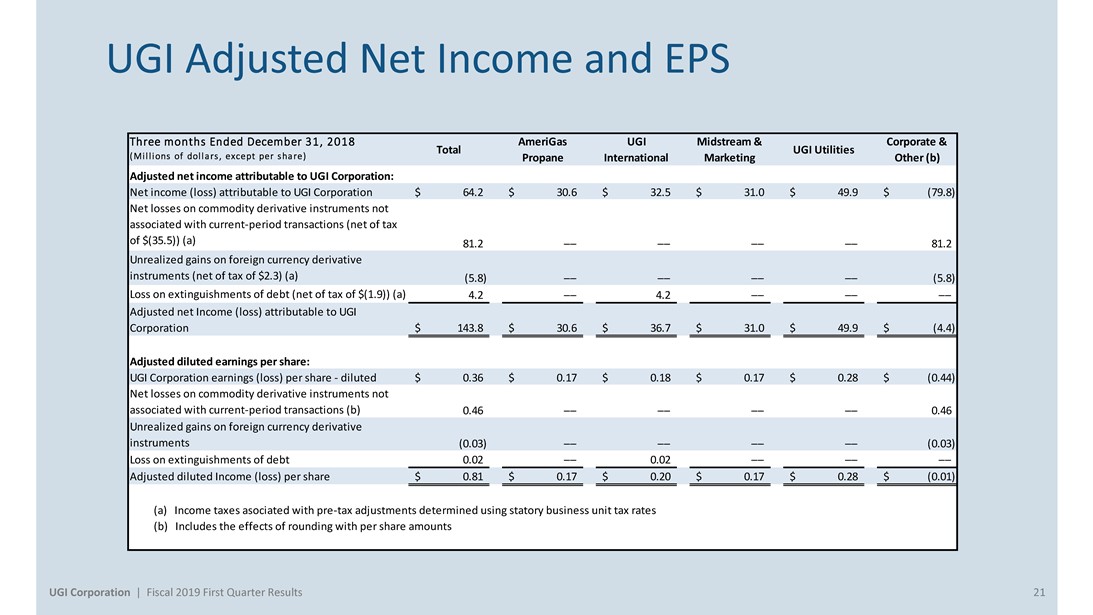
Three months Ended December 31, 2018 AmeriGas UGI Midstream & Corporate & Total UGI Utilities (Millions of dollars, except per share) Propane International Marketing Other (b) Adjusted net income attributable to UGI Corporation:
Net income (loss) attributable to UGI Corporation $ 64.2 $ 30.6 $ 32.5 $ 31.0 $ 49.9 $ (79.8) Net losses on commodity derivative instruments not associated with current-period transactions (net of tax of $(35.5)) (a) 81.2 —— —— —— —— 81.2 Unrealized gains on foreign currency derivative instruments (net of tax of $2.3) (a) (5.8) —— —— —— —— (5.8) Loss on extinguishments of debt (net of tax of $(1.9)) (a) 4.2 —— 4.2 —— —— —— Adjusted net Income (loss) attributable to UGI
Corporation $ 143.8 $ 30.6 $ 36.7 $ 31.0 $ 49.9 $ (4.4)
Adjusted diluted earnings per share:
UGI Corporation earnings (loss) per share—diluted $ 0.36 $ 0.17 $ 0.18 $ 0.17 $ 0.28 $ (0.44) Net losses on commodity derivative instruments not associated with
current-period transactions (b) 0.46 —— —— —— —— 0.46 Unrealized gains on foreign currency derivative instruments (0.03) —— —— —— —— (0.03) Loss on extinguishments of debt 0.02 —— 0.02 —— —— ——
Adjusted diluted Income (loss) per share $ 0.81 $ 0.17 $ 0.20 $ 0.17 $ 0.28 $ (0.01)
(a) Income taxes asociated withpre-tax adjustments determined using statory business unit tax rates (b) Includes the effects of rounding with per share amounts
UGI Corporation | Fiscal 2019 First Quarter Results 21
UGI Adjusted Net Income and EPS
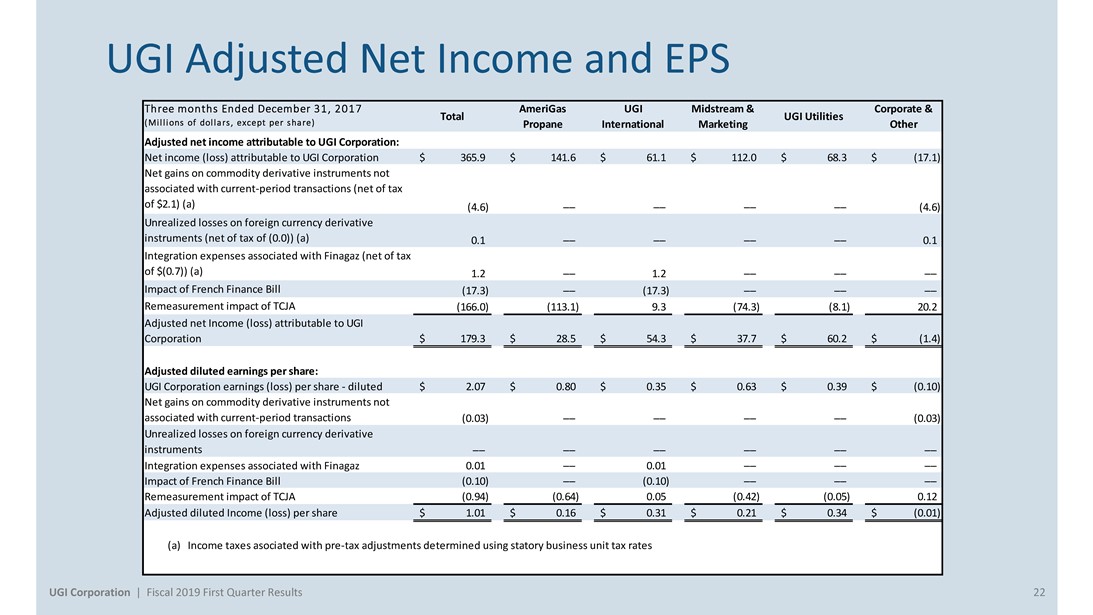
Three months Ended December 31, 2017 AmeriGas UGI Midstream & Corporate & Total UGI Utilities
(Millions of dollars, except per share) Propane International Marketing Other
Adjusted net income attributable to UGI Corporation:
Net income (loss) attributable to UGI Corporation $ 365.9 $ 141.6 $ 61.1 $ 112.0 $ 68.3 $ (17.1) Net gains on commodity derivative instruments not associated with current-period transactions (net of tax of $2.1) (a) (4.6) —— —— —— —— (4.6) Unrealized losses on foreign currency derivative instruments (net of tax of (0.0)) (a) 0.1 —— —— —— —— 0.1 Integration expenses associated with Finagaz (net of tax of $(0.7)) (a) 1.2 —— 1.2 —— —— —— Impact of French Finance Bill (17.3) —— (17.3) —— —— —— Remeasurement impact of TCJA (166.0) (113.1) 9.3 (74.3) (8.1) 20.2 Adjusted net Income (loss) attributable to UGI
Corporation $ 179.3 $ 28.5 $ 54.3 $ 37.7 $ 60.2 $ (1.4)
Adjusted diluted earnings per share:
UGI Corporation earnings (loss) per share—diluted $ 2.07 $ 0.80 $ 0.35 $ 0.63 $ 0.39 $ (0.10) Net gains on commodity derivative instruments not associated with current-period transactions (0.03) —— —— —— —— (0.03) Unrealized losses on foreign currency derivative instruments —— —— —— —— —— ——
Integration expenses associated with Finagaz 0.01 —— 0.01 —— —— ——
Impact of French Finance Bill (0.10) —— (0.10) —— —— —— Remeasurement impact of TCJA (0.94) (0.64) 0.05 (0.42) (0.05) 0.12 Adjusted diluted Income (loss) per share $ 1.01 $ 0.16 $ 0.31 $ 0.21 $ 0.34 $ (0.01)
(a) Income taxes asociated withpre-tax adjustments determined using statory business unit tax rates
UGI Corporation | Fiscal 2019 First Quarter Results 22
AmeriGas Supplemental Footnotes
• The enclosed supplemental information contains a reconciliation of earnings before interest expense, income taxes, depreciation and amortization (“EBITDA”) and Adjusted EBITDA to Net Income.
• EBITDA and Adjusted EBITDA are not measures of performance or financial condition under GAAP. Management believes EBITDA and Adjusted EBITDA are meaningfulnon-GAAP financial measures used by investors to compare the Partnership’s operating performance with that of other companies within the propane industry. The Partnership’s definitions of EBITDA and Adjusted EBITDA may be different from those used by other companies.
• EBITDA and Adjusted EBITDA should not be considered as alternatives to net income (loss) attributable to AmeriGas Partners, L.P. Management uses EBITDA to compare year-over-year profitability of
the business without regard to capital structure as well as to compare the relative performance of the Partnership to that of other master limited partnerships without regard to their financing methods, capital structure, income taxes or historical cost basis. Management uses Adjusted EBITDA to exclude from AmeriGas Partners’ EBITDA gains and losses that competitors do not necessarily have to provide additional insight into the comparison of year-over-year profitability to that of other master limited partnerships. In view of the omission of interest, income taxes, depreciation and amortization, gains and losses on commodity derivative instruments not associated with current-period transactions, and other gains and losses that competitors do not necessarily have from Adjusted EBITDA, management also assesses the profitability of the business by comparing net income attributable to AmeriGas Partners, L.P. for the relevant periods. Management also uses Adjusted EBITDA to assess the Partnership’s profitability because its parent, UGI Corporation, uses the Partnership’s Adjusted EBITDA to assess the profitability of the Partnership, which is one of UGI Corporation’s business segments. UGI Corporation discloses the Partnership’s Adjusted EBITDA as the profitability measure for its domestic propane segment.
UGI Corporation | Fiscal 2019 First Quarter Results 23
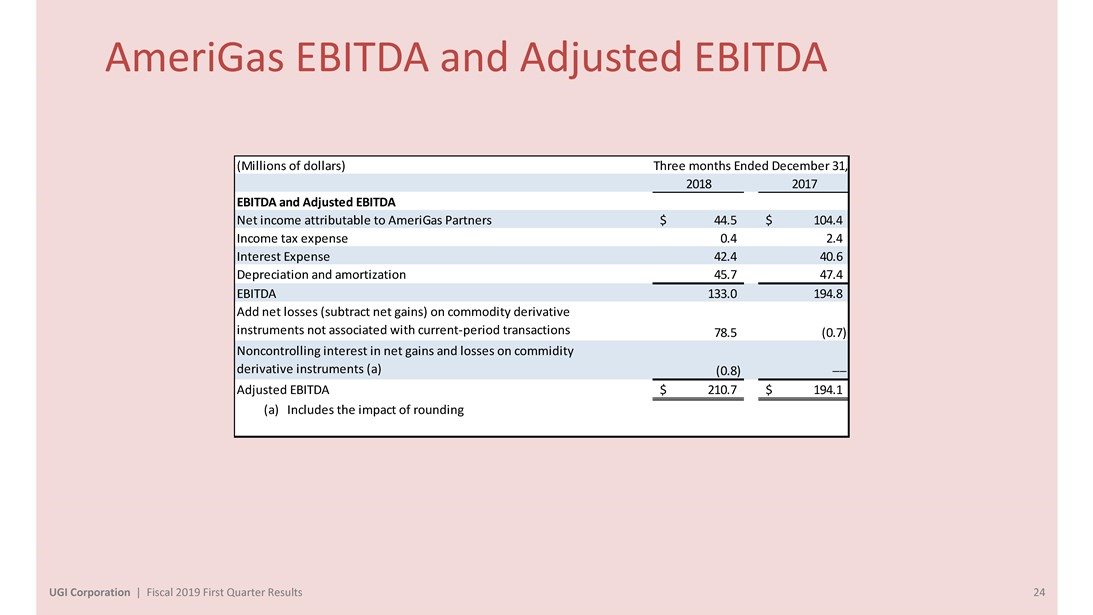
AmeriGas EBITDA and Adjusted EBITDA
(Millions of dollars) Three months Ended December 31, 2018 2017
EBITDA and Adjusted EBITDA
Net income attributable to AmeriGas Partners $ 44.5 $ 104.4 Income tax expense 0.4 2.4 Interest Expense 42.4 40.6 Depreciation and amortization 45.7 47.4 EBITDA 133.0 194.8 Add net losses (subtract net gains) on commodity derivative instruments not associated with current-period transactions 78.5 (0.7) Noncontrolling interest in net gains and losses on commidity derivative instruments (a) (0.8) ——
Adjusted EBITDA $ 210.7 $ 194.1 (a) Includes the impact of rounding
UGI Corporation | Fiscal 2019 First Quarter Results 24

Investor Relations:
Brendan Heck610-456-6608 heckb@ugicorp.com

PRELIMINARY CONFIDENTIAL DRAFT Subject to Further Review & Revision
Disclosure Statement
Tudor, Pickering, Holt & Co. does not provide accounting, tax or legal advice. This presentation does not constitute a tax opinion and cannot be used by any taxpayer for the purpose of avoiding tax penalties. We (i) make no conclusion on the valuation or About The Firm pricing for tax purposes or the effects of federal income tax laws on any party and (ii) have assumed that the party’s intended tax treatment will be respected. Each person should seek legal, regulatory, accounting and tax advice based on his, her or its Tudor, Pickering, Holt & Co. is an integrated energy investment and merchant particular circumstances from independent advisors regarding the evaluation and bank, providing high quality advice and services to institutional and corporate impact of any transactions or matters described herein. clients. Through the company’s two broker-dealer units, Tudor, Pickering, Holt & Co. Securities, Inc. (TPHCSI) and Tudor Pickering Holt & Co Advisors LP (TPHCA), The information contained herein is confidential (except for information relating to members FINRA, together with affiliates in the United Kingdom and Canada, the United States tax issues) and may not be reproduced in whole or in part except as set company offers securities and investment banking services to the energy forth in a written agreement between the Audit Committee of the Board of Directors community. Perella Weinberg
Partners Capital Management LP is an SEC of AmeriGas Propane, Inc. and Tudor, Pickering, Holt & Co. registered investment adviser that delivers a suite of energy investment strategies. Tudor, Pickering, Holt & Co. assumes no responsibility for independent verification of third-party information and has relied on such information being complete and The firm, headquartered in Houston, Texas, has approximately 170 employees accurate in all material respects. To the extent such information includes estimates and offices in Calgary, Canada; Denver, Colorado; New York, New York; and and forecasts of future financial performance (including estimates of potential cost London, England. savings and synergies) prepared by, reviewed or discussed with the managements of your company and/ or other potential transaction participants or obtained from public
Contact Us sources, we have assumed that such estimates and forecasts have been reasonably
Houston (Research, Sales and Trading):713-333-2960 prepared on bases reflecting the best currently available estimates and judgments of Houston (Investment Banking):713-333-7100 such managements (or, with respect to estimates and forecasts obtained from public Houston (Asset Management):713-337-3999 sources, represent reasonable estimates). These materials were designed for use by Denver (Sales):303-300-1900 specific persons familiar with the business and the affairs of your company and Tudor, Denver (Investment Banking):303-300-1900 Pickering, Holt & Co. materials.
New York (Investment Banking):212-610-1660
New York (Research, Sales):212-610-1600 Under no circumstances is this presentation to be used or considered as an offer to London: +011 44(0) 20 7268 2800 sell or a solicitation of any offer to buy, any security. Prior to making any trade, you Calgary:403-705-7830 should discuss with your professional tax, accounting, or regulatory advisers how such particular trade(s) affect you. This brief statement does not disclose all of the risks www.TPHco.com and other significant aspects of entering into any particular transaction.
Copyright 2019 — Tudor, Pickering, Holt & Co. Tudor, Pickering, Holt & Co. operates in the United Kingdom under the trading name Perella Weinberg Partners UK LLP (authorized and regulated by the Financial Conduct Authority), and in Canada through its affiliate, Tudor, Pickering, Holt & Co. Securities
– Canada, ULC, located in Calgary, Alberta.


