Exhibit (c)(9)

PRELIMINARY CONFIDENTIAL DRAFT Subject to Further Review & Revision
Project Rushmore Discussion Materials
February 12th, 2019
TUDORPICKERING HOLT&CO
ENERGY INVESTMENT & MERCHANT BANKING
PRELIMINARY CONFIDENTIAL DRAFT Subject to Further Review & Revision
Table of Contents
I. Situation Overview
II. Status Quo Management Projections Overview III. Abe Financial Analysis IV. Ulysses Financial Analysis V. Transaction Analysis
Supplemental Analysis
Appendix
2
TUDORPICKERING HOLT&CO
ENERGY INVESTMENT & MERCHANT BANKING
PRELIMINARY CONFIDENTIAL DRAFT Subject to Further Review & Revision
I. Situation Overview
3
TUDORPICKERING HOLT&CO
ENERGY INVESTMENT & MERCHANT BANKING
PRELIMINARY CONFIDENTIAL DRAFT Subject to Further Review & Revision
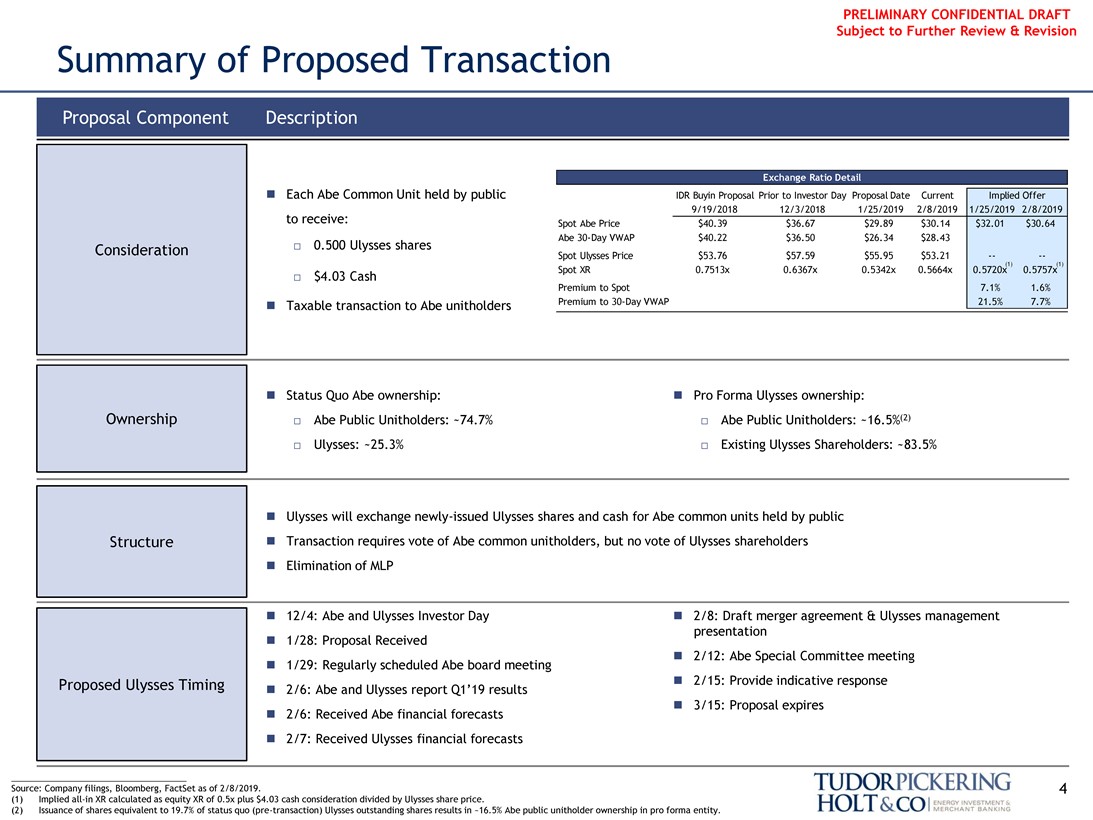
Summary of Proposed Transaction
Proposal Component Description
Exchange Ratio Detail
∎ Each Abe Common Unit held by public IDR Buyin Proposal Prior to Investor Day Proposal Date Current Implied Offer 9/19/2018 12/3/2018 1/25/2019 2/8/2019 1/25/2019 2/8/2019 to receive: Spot Abe Price $40.39 $36.67 $29.89 $30.14 $32.01 $30.64 Abe30-Day VWAP $40.22 $36.50 $26.34 $28.43 Consideration ☐ 0.500 Ulysses shares Spot Ulysses Price $53.76 $57.59 $55.95 $53.21
Spot XR 0.7513x 0.6367x 0.5342x 0.5664x 0.5720x(1) 0.5757x(1)
☐ $4.03 Cash
Premium to Spot 7.1% 1.6%
∎ Taxable transaction to Abe unitholders Premium to30-Day VWAP 21.5% 7.7%
∎ Status Quo Abe ownership:∎ Pro Forma Ulysses ownership:
Ownership ☐ Abe Public Unitholders: ~74.7% ☐ Abe Public Unitholders: ~16.5%(2)
☐ Ulysses: ~25.3% ☐ Existing Ulysses Shareholders: ~83.5%
∎ Ulysses will exchange newly-issued Ulysses shares and cash for Abe common units held by public Structure∎ Transaction requires vote of Abe common unitholders, but no vote of Ulysses shareholders∎ Elimination of MLP
∎ 12/4: Abe and Ulysses Investor Day∎ 2/8: Draft merger agreement & Ulysses management presentation ∎ 1/28: Proposal Received∎ 2/12: Abe Special Committee meeting∎ 1/29: Regularly scheduled Abe board meeting Proposed Ulysses Timing∎ 2/15: Provide indicative response
∎ 2/6: Abe and Ulysses report Q1’19 results
∎ 3/15: Proposal expires∎ 2/6: Received Abe financial forecasts ∎ 2/7: Received Ulysses financial forecasts
Source: Company filings, Bloomberg, FactSet as of 2/8/2019. 4 (1) Impliedall-in XR calculated as equity XR of 0.5x plus $4.03 cash consideration divided by Ulysses share price.
(2) Issuance of shares equivalent to 19.7% of status quo(pre-transaction) Ulysses outstanding shares results in ~16.5% Abe public unitholder ownership in pro forma entity.
TUDORPICKERING HOLT&CO
ENERGY INVESTMENT & MERCHANT BANKING
PRELIMINARY CONFIDENTIAL DRAFT Subject to Further Review & Revision
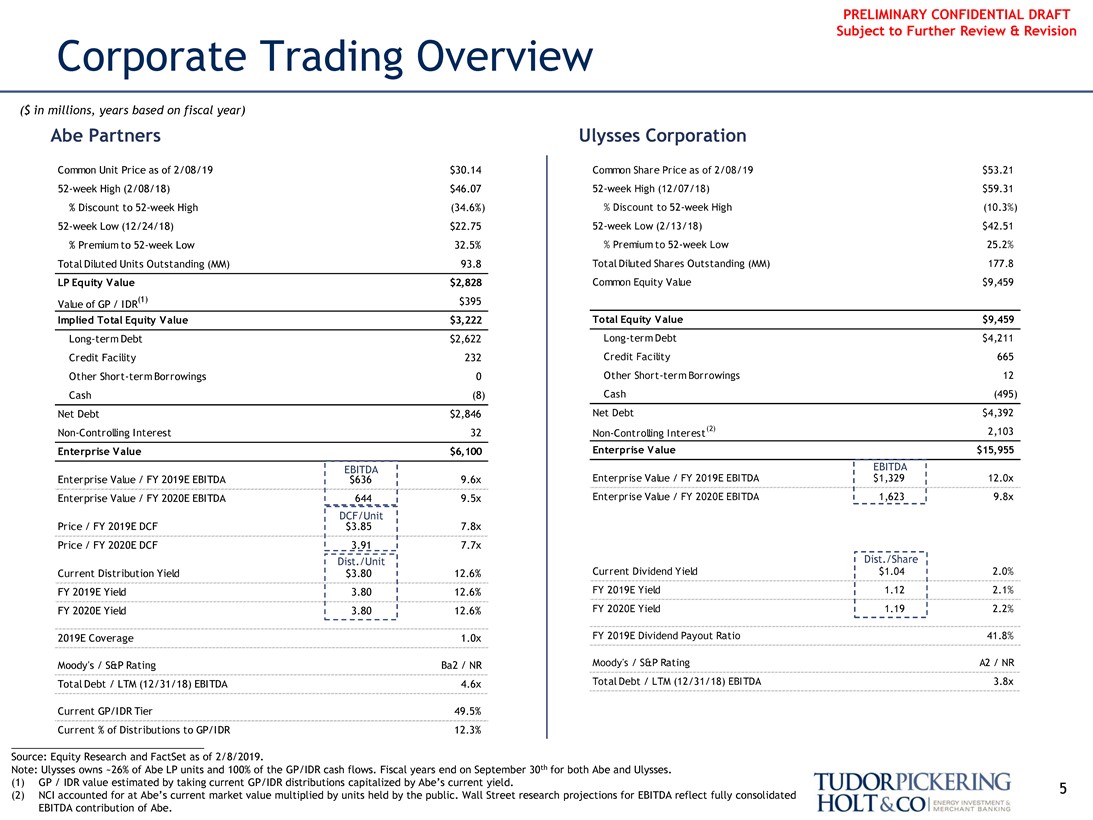
Corporate Trading Overview
($ in millions, years based on fiscal year)
Abe Partners Ulysses Corporation
Common Unit Price as of 2/08/19 $30.14 Common Share Price as of 2/08/19 $53.2152-week High (2/08/18) $46.0752-week High (12/07/18) $59.31
% Discount to52-week High (34.6%) % Discount to52-week High (10.3%)52-week Low (12/24/18) $22.7552-week Low (2/13/18) $42.51
% Premium to52-week Low 32.5% % Premium to52-week Low 25.2% Total Diluted Units Outstanding (MM) 93.8 Total Diluted Shares Outstanding (MM) 177.8 LP Equity Value $2,828 Common Equity Value $9,459 Value of GP / IDR(1) $395
Implied Total Equity Value $3,222 Total Equity Value $9,459
Long-term Debt $2,622 Long-term Debt $4,211 Credit Facility 232 Credit Facility 665 Other Short-term Borrowings 0 Other Short-term Borrowings 12 Cash (8) Cash (495) Net Debt $2,846 Net Debt $4,392Non-Controlling Interest 32Non-Controlling Interest(2) 2,103
Enterprise Value $6,100 Enterprise Value $15,955
EBITDA EBITDA
Enterprise Value / FY 2019E EBITDA $636 9.6x Enterprise Value / FY 2019E EBITDA $1,329 12.0x Enterprise Value / FY 2020E EBITDA 644 9.5x Enterprise Value / FY 2020E EBITDA 1,623 9.8x
DCF/Unit
Price / FY 2019E DCF $3.85 7.8x Price / FY 2020E DCF 3.91 7.7x
Dist./Unit Dist./Share
Current Distribution Yield $3.80 12.6% Current Dividend Yield $1.04 2.0% FY 2019E Yield 3.80 12.6% FY 2019E Yield 1.12 2.1% FY 2020E Yield 3.80 12.6% FY 2020E Yield 1.19 2.2%
2019E Coverage 1.0x FY 2019E Dividend Payout Ratio 41.8% Moody’s / S&P Rating Ba2 / NR Moody’s / S&P Rating A2 / NR Total Debt / LTM (12/31/18) EBITDA 4.6x Total Debt / LTM (12/31/18) EBITDA 3.8x
Current GP/IDR Tier 49.5% Current % of Distributions to GP/IDR 12.3%
Source: Equity Research and FactSet as of 2/8/2019.
Note: Ulysses owns ~26% of Abe LP units and 100% of the GP/IDR cash flows. Fiscal years end on September 30th for both Abe and Ulysses.
(1) GP / IDR value estimated by taking current GP/IDR distributions capitalized by Abe’s current yield. 5 (2) NCI accounted for at Abe’s current market value multiplied by units held by the public. Wall Street research projections for EBITDA reflect fully consolidated EBITDA contribution of Abe.
TUDORPICKERING HOLT&CO
ENERGY INVESTMENT & MERCHANT BANKING
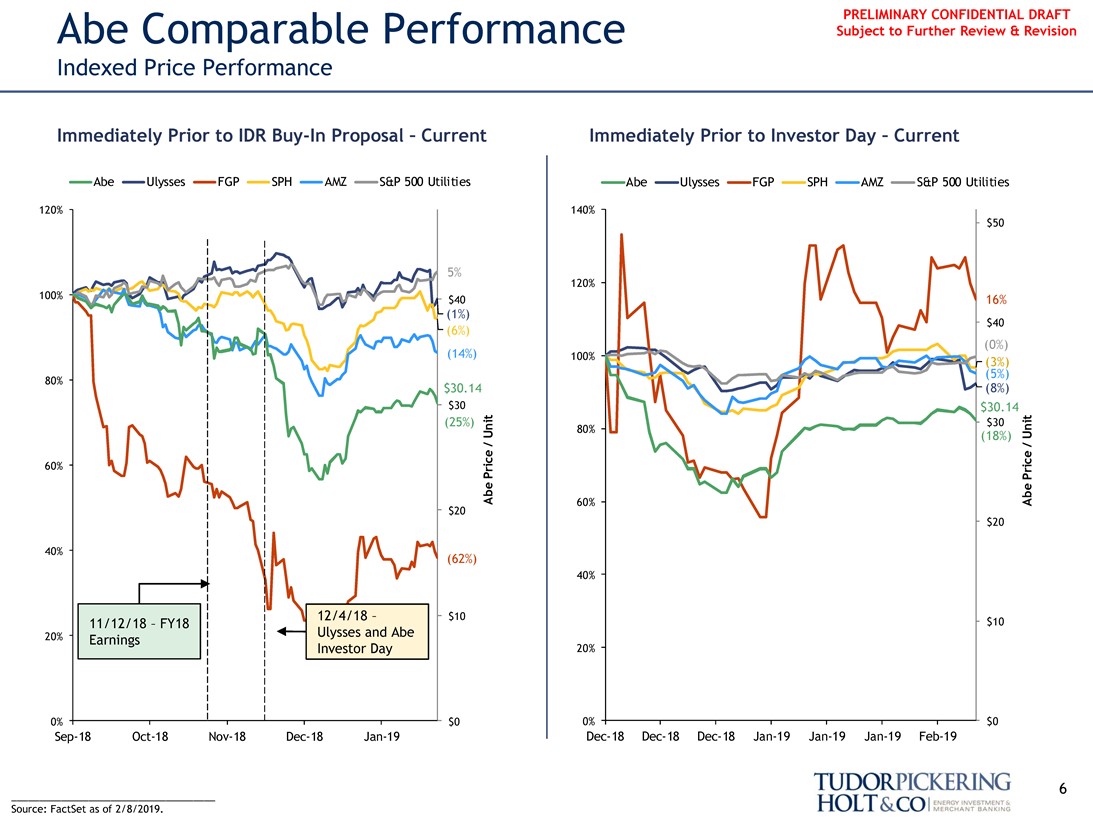
PRELIMINARY CONFIDENTIAL DRAFT Abe Comparable Performance Subject to Further Review & Revision
Indexed Price Performance
Immediately Prior to IDRBuy-In Proposal – Current Immediately Prior to Investor Day – Current
Abe Ulysses FGP SPH AMZ S&P 500 Utilities Abe Ulysses FGP SPH AMZ S&P 500 Utilities
Abe Price / Unit
120% 140% $50
5% 120%
100% $40 16%
(1%) $40
(6%)
(0%)
(14%) 100%
(5%) (3%)
80% $30.14 (8%)
$30 $30.14
(25%) $30
80%
(18%)
60%
Abe Price / Unit
60% $20 $20
40%
(62%)
40%
12/4/18 – $10
11/12/18 – FY18 $10 20% Ulysses and Abe Earnings Investor Day 20%
0% $0 0% $0
Sep-18Oct-18Nov-18Dec-18Jan-19Dec-18Dec-18Dec-18Jan-19Jan-19Jan-19Feb-19
6
_____________________________________ Source: FactSet as of 2/8/2019.
TUDORPICKERING HOLT&CO
ENERGY INVESTMENT & MERCHANT BANKING
PRELIMINARY CONFIDENTIAL DRAFT
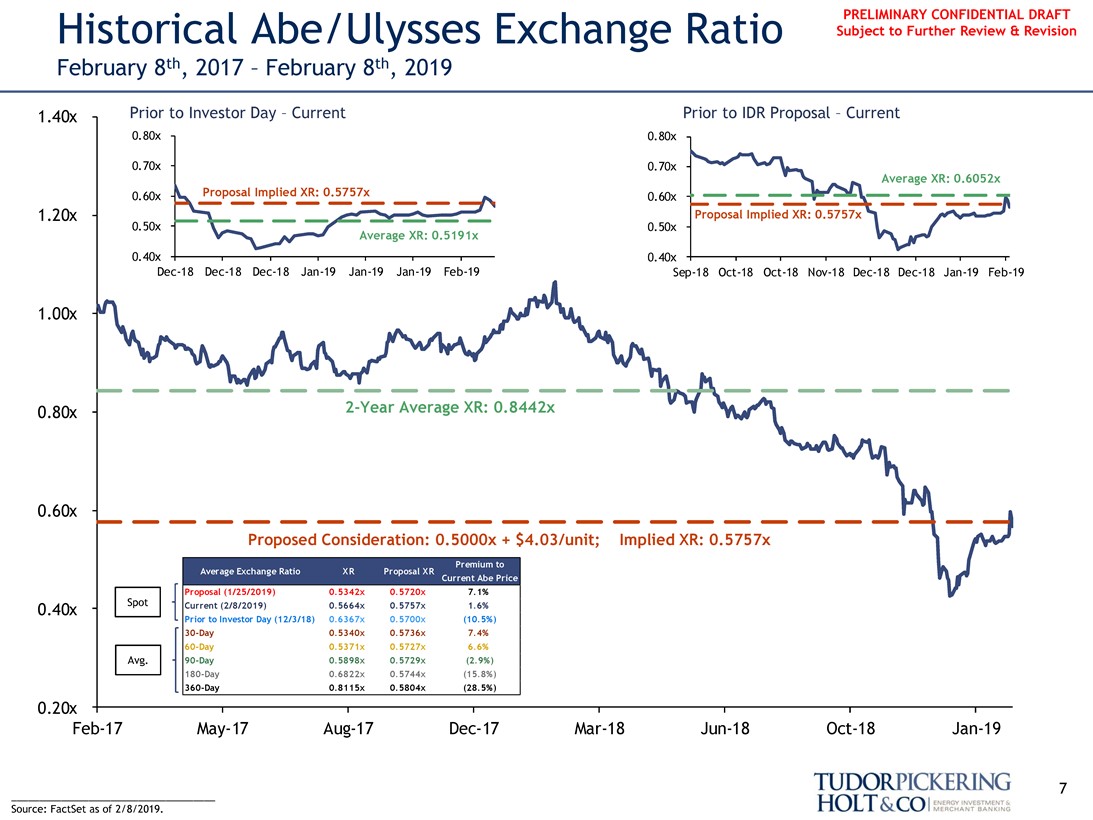
Historical Abe/Ulysses Exchange Ratio Subject to Further Review & Revision
February 8th, 2017 – February 8th, 2019
1.40x Prior to Investor Day – Current Prior to IDR Proposal – Current
0.80x 0.80x
0.70x 0.70x
Average XR: 0.6052x 0.60x Proposal Implied XR: 0.5757x 0.60x 1.20x 0.50x Proposal Implied XR: 0.5757x
0.50x
Average XR: 0.5191x
0.40x 0.40x
Dec-18Dec-18Dec-18Jan-19Jan-19Jan-19Feb-19Sep-18Oct-18Oct-18Nov-18Dec-18Dec-18Jan-19Feb-19
1.00x
0.80x2-Year Average XR: 0.8442x
0.60x
Proposed Consideration: 0.5000x + $4.03/unit; Implied XR: 0.5757x
Average Exchange Ratio XR Proposal XR Premium to Current Abe Price
Proposal (1/25/2019) 0.5342x 0.5720x 7.1% 0.40x Spot Current (2/8/2019) 0.5664x 0.5757x 1.6% Prior to Investor Day (12/3/18) 0.6367x 0.5700x (10.5%)30-Day 0.5340x 0.5736x 7.4%60-Day 0.5371x 0.5727x 6.6% Avg.90-Day 0.5898x 0.5729x (2.9%)180-Day 0.6822x 0.5744x (15.8%)360-Day 0.8115x 0.5804x (28.5%)
0.20x
Feb-17May-17Aug-17Dec-17Mar-18Jun-18Oct-18Jan-19
7
_____________________________________ Source: FactSet as of 2/8/2019.
TUDORPICKERING HOLT&CO
ENERGY INVESTMENT & MERCHANT BANKING
PRELIMINARY CONFIDENTIAL DRAFT Subject to Further Review & Revision
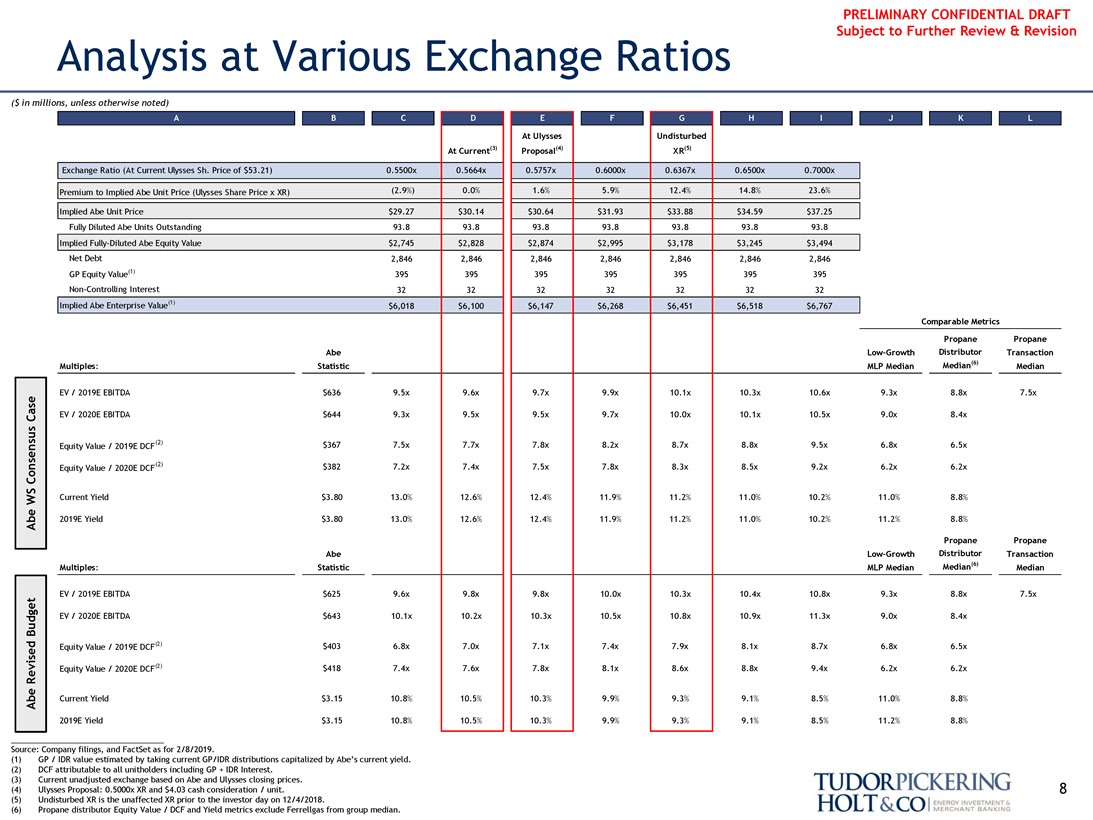
Analysis at Various Exchange Ratios
($ in millions, unless otherwise noted)
A B C D E F G H I J K L
At Ulysses Undisturbed At Current(3) Proposal(4) XR(5)
Exchange Ratio (At Current Ulysses Sh. Price of $53.21) 0.5500x 0.5664x 0.5757x 0.6000x 0.6367x 0.6500x 0.7000x
Premium to Implied Abe Unit Price (Ulysses Share Price x XR) (2.9%) 0.0% 1.6% 5.9% 12.4% 14.8% 23.6% Implied Abe Unit Price $29.27 $30.14 $30.64 $31.93 $33.88 $34.59 $37.25 Fully Diluted Abe Units Outstanding 93.8 93.8 93.8 93.8 93.8 93.8 93.8 Implied Fully-Diluted Abe Equity Value $2,745 $2,828 $2,874 $2,995 $3,178 $3,245 $3,494 Net Debt 2,846 2,846 2,846 2,846 2,846 2,846 2,846 GP Equity Value(1) 395 395 395 395 395 395 395Non-Controlling Interest 32 32 32 32 32 32 32 Implied Abe Enterprise Value(1) $6,018 $6,100 $6,147 $6,268 $6,451 $6,518 $6,767
Comparable Metrics
Abe WS Consensus Case
Propane Propane AbeLow-Growth Distributor Transaction Multiples: Statistic MLP Median Median(6) Median
EV / 2019E EBITDA $636 9.5x 9.6x 9.7x 9.9x 10.1x 10.3x 10.6x 9.3x 8.8x 7.5x EV / 2020E EBITDA $644 9.3x 9.5x 9.5x 9.7x 10.0x 10.1x 10.5x 9.0x 8.4x Equity Value / 2019E DCF(2) $367 7.5x 7.7x 7.8x 8.2x 8.7x 8.8x 9.5x 6.8x 6.5x Equity Value / 2020E DCF(2) $382 7.2x 7.4x 7.5x 7.8x 8.3x 8.5x 9.2x 6.2x 6.2x
Current Yield $3.80 13.0% 12.6% 12.4% 11.9% 11.2% 11.0% 10.2% 11.0% 8.8% 2019E Yield $3.80 13.0% 12.6% 12.4% 11.9% 11.2% 11.0% 10.2% 11.2% 8.8%
Abe Revised Budget
Propane PropaneLow-Growth Distributor Transaction Multiples: Statistic MLP Median Median(6) Median
EV / 2019E EBITDA $625 9.6x 9.8x 9.8x 10.0x 10.3x 10.4x 10.8x 9.3x 8.8x 7.5x EV / 2020E EBITDA $643 10.1x 10.2x 10.3x 10.5x 10.8x 10.9x 11.3x 9.0x 8.4x $403 6.8x 7.0x 7.1x 7.4x 7.9x 8.1x 8.7x 6.8x 6.5x Equity Value / 2019E DCF(2)
Equity Value / 2020E DCF(2) $418 7.4x 7.6x 7.8x 8.1x 8.6x 8.8x 9.4x 6.2x 6.2x Abe Current Yield $3.15 10.8% 10.5% 10.3% 9.9% 9.3% 9.1% 8.5% 11.0% 8.8% 2019E Yield $3.15 10.8% 10.5% 10.3% 9.9% 9.3% 9.1% 8.5% 11.2% 8.8%
Source: Company filings, and FactSet as for 2/8/2019.
(1) GP / IDR value estimated by taking current GP/IDR distributions capitalized by Abe’s current yield. (2) DCF attributable to all unitholders including GP + IDR Interest.
(3) Current unadjusted exchange based on Abe and Ulysses closing prices.
(4) Ulysses Proposal: 0.5000x XR and $4.03 cash consideration / unit. 8 (5) Undisturbed XR is the unaffected XR prior to the investor day on 12/4/2018.
(6) Propane distributor Equity Value / DCF and Yield metrics exclude Ferrellgas from group median.
TUDORPICKERING HOLT&CO
ENERGY INVESTMENT & MERCHANT BANKING
PRELIMINARY CONFIDENTIAL DRAFT Subject to Further Review & Revision
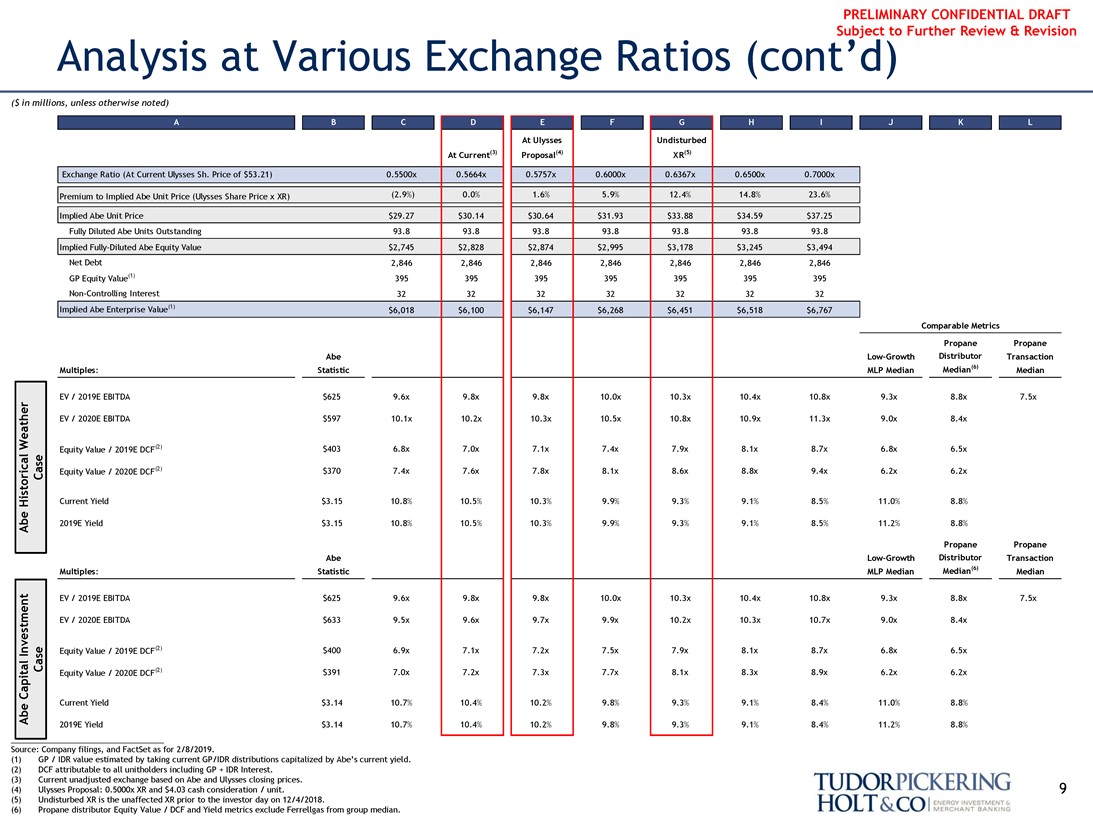
Analysis at Various Exchange Ratios (cont’d)
($ in millions, unless otherwise noted)
A B C D E F G H I J K L
At Ulysses Undisturbed At Current(3) Proposal(4) XR(5)
Exchange Ratio (At Current Ulysses Sh. Price of $53.21) 0.5500x 0.5664x 0.5757x 0.6000x 0.6367x 0.6500x 0.7000x
Premium to Implied Abe Unit Price (Ulysses Share Price x XR) (2.9%) 0.0% 1.6% 5.9% 12.4% 14.8% 23.6% Implied Abe Unit Price $29.27 $30.14 $30.64 $31.93 $33.88 $34.59 $37.25 Fully Diluted Abe Units Outstanding 93.8 93.8 93.8 93.8 93.8 93.8 93.8 Implied Fully-Diluted Abe Equity Value $2,745 $2,828 $2,874 $2,995 $3,178 $3,245 $3,494 Net Debt 2,846 2,846 2,846 2,846 2,846 2,846 2,846 GP Equity Value(1) 395 395 395 395 395 395 395Non-Controlling Interest 32 32 32 32 32 32 32 Implied Abe Enterprise Value(1) $6,018 $6,100 $6,147 $6,268 $6,451 $6,518 $6,767
Comparable Metrics
Propane Propane AbeLow-Growth Distributor Transaction Multiples: Statistic MLP Median Median(6) Median
EV / 2019E EBITDA $625 9.6x 9.8x 9.8x 10.0x 10.3x 10.4x 10.8x 9.3x 8.8x 7.5x
Abe Historical Weather Case
EV / 2020E EBITDA $597 10.1x 10.2x 10.3x 10.5x 10.8x 10.9x 11.3x 9.0x 8.4x Equity Value / 2019E DCF(2) $403 6.8x 7.0x 7.1x 7.4x 7.9x 8.1x 8.7x 6.8x 6.5x Equity Value / 2020E DCF(2) $370 7.4x 7.6x 7.8x 8.1x 8.6x 8.8x 9.4x 6.2x 6.2x Current Yield $3.15 10.8% 10.5% 10.3% 9.9% 9.3% 9.1% 8.5% 11.0% 8.8% 2019E Yield $3.15 10.8% 10.5% 10.3% 9.9% 9.3% 9.1% 8.5% 11.2% 8.8%
Propane Propane AbeLow-Growth Distributor Transaction Multiples: Statistic MLP Median Median(6) Median
EV / 2019E EBITDA $625 9.6x 9.8x 9.8x 10.0x 10.3x 10.4x 10.8x 9.3x 8.8x 7.5x
Abe Capital Investment Case
EV / 2020E EBITDA $633 9.5x 9.6x 9.7x 9.9x 10.2x 10.3x 10.7x 9.0x 8.4x Equity Value / 2019E DCF(2) $400 6.9x 7.1x 7.2x 7.5x 7.9x 8.1x 8.7x 6.8x 6.5x Equity Value / 2020E DCF(2) $391 7.0x 7.2x 7.3x 7.7x 8.1x 8.3x 8.9x 6.2x 6.2x Current Yield $3.14 10.7% 10.4% 10.2% 9.8% 9.3% 9.1% 8.4% 11.0% 8.8% 2019E Yield $3.14 10.7% 10.4% 10.2% 9.8% 9.3% 9.1% 8.4% 11.2% 8.8% ___________________________________ Source: Company filings, and FactSet as for 2/8/2019.
(1) GP / IDR value estimated by taking current GP/IDR distributions capitalized by Abe’s current yield. (2) DCF attributable to all unitholders including GP + IDR Interest.
(3) Current unadjusted exchange based on Abe and Ulysses closing prices.
(4) Ulysses Proposal: 0.5000x XR and $4.03 cash consideration / unit. 9 (5) Undisturbed XR is the unaffected XR prior to the investor day on 12/4/2018.
(6) Propane distributor Equity Value / DCF and Yield metrics exclude Ferrellgas from group median.
TUDORPICKERING HOLT&CO
ENERGY INVESTMENT & MERCHANT BANKING
PRELIMINARY CONFIDENTIAL DRAFT Subject to Further Review & Revision
II. Status Quo Management Projections Overview
10
TUDORPICKERING HOLT&CO
ENERGY INVESTMENT & MERCHANT BANKING
PRELIMINARY CONFIDENTIAL DRAFT Management Projections Overview Subject to Further Review & Revision
For Committee Consideration
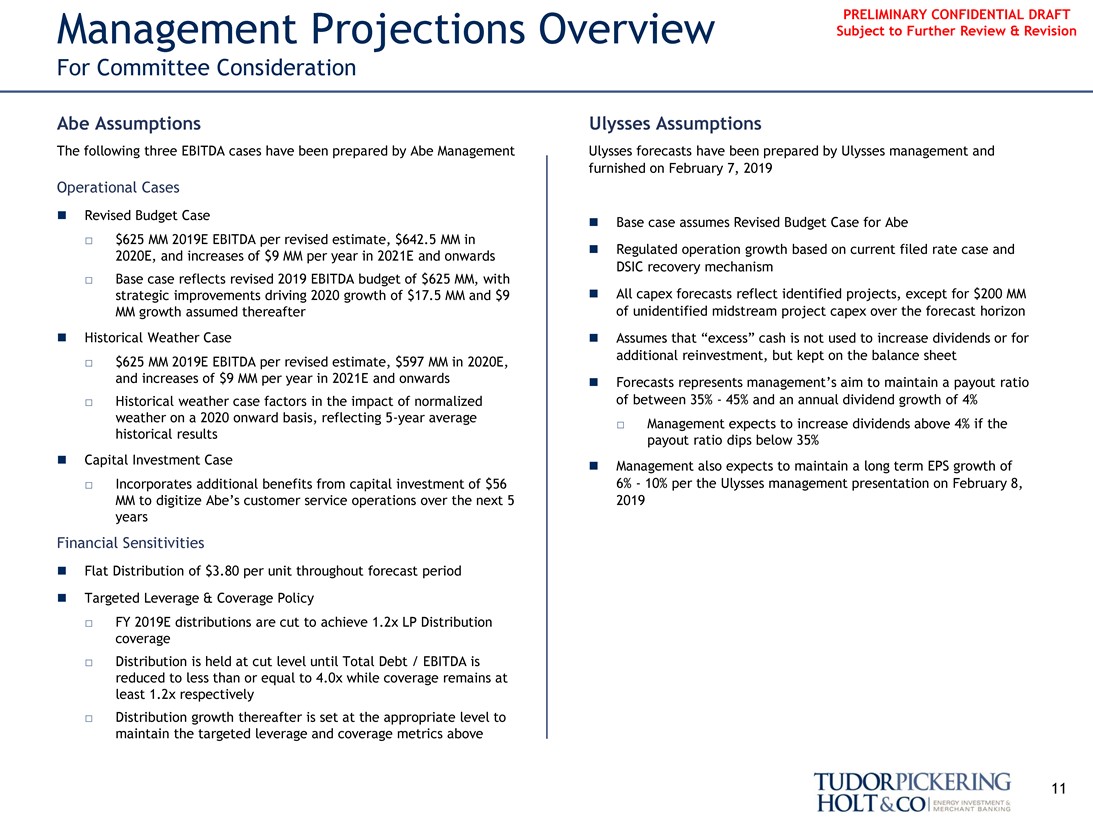
Abe Assumptions Ulysses Assumptions
The following three EBITDA cases have been prepared by Abe Management Ulysses forecasts have been prepared by Ulysses management and furnished on February 7, 2019
Operational Cases
∎ Revised Budget Case
∎ Base case assumes Revised Budget Case for Abe
☐ $625 MM 2019E EBITDA per revised estimate, $642.5 MM in
∎ Regulated operation growth based on current filed rate case and 2020E, and increases of $9 MM per year in 2021E and onwards
☐ Base case reflects revised 2019 EBITDA budget of $625 MM, with DSIC recovery mechanism strategic improvements driving 2020 growth of $17.5 MM and $9 ∎ All capex forecasts reflect identified projects, except for $200 MM MM growth assumed thereafter of unidentified midstream project capex over the forecast horizon
∎ Historical Weather Case∎ Assumes that “excess” cash is not used to increase dividends or for additional reinvestment, but kept on the balance sheet
☐ $625 MM 2019E EBITDA per revised estimate, $597 MM in 2020E, and increases of $9 MM per year in 2021E and onwards ∎ Forecasts represents management’s aim to maintain a payout ratio
☐ Historical weather case factors in the impact of normalized of between 35% - 45% and an annual dividend growth of 4% weather on a 2020 onward basis, reflecting5-year average ☐ Management expects to increase dividends above if the
☐ 4% historical results payout ratio dips below 35%
∎ Capital Investment Case∎ Management also expects to maintain a long term EPS growth of
☐ Incorporates additional benefits from capital investment of $56 6% - 10% per the Ulysses management presentation on February 8, MM to digitize Abe’s customer service operations over the next 5 2019 years
Financial Sensitivities
∎ Flat Distribution of $3.80 per unit throughout forecast period∎ Targeted Leverage & Coverage Policy
☐ FY 2019E distributions are cut to achieve 1.2x LP Distribution coverage
☐ Distribution is held at cut level until Total Debt / EBITDA is reduced to less than or equal to 4.0x while coverage remains at least 1.2x respectively
☐ Distribution growth thereafter is set at the appropriate level to maintain the targeted leverage and coverage metrics above
11
TUDORPICKERING HOLT&CO
ENERGY INVESTMENT & MERCHANT BANKING
PRELIMINARY CONFIDENTIAL DRAFT Subject to Further Review & Revision
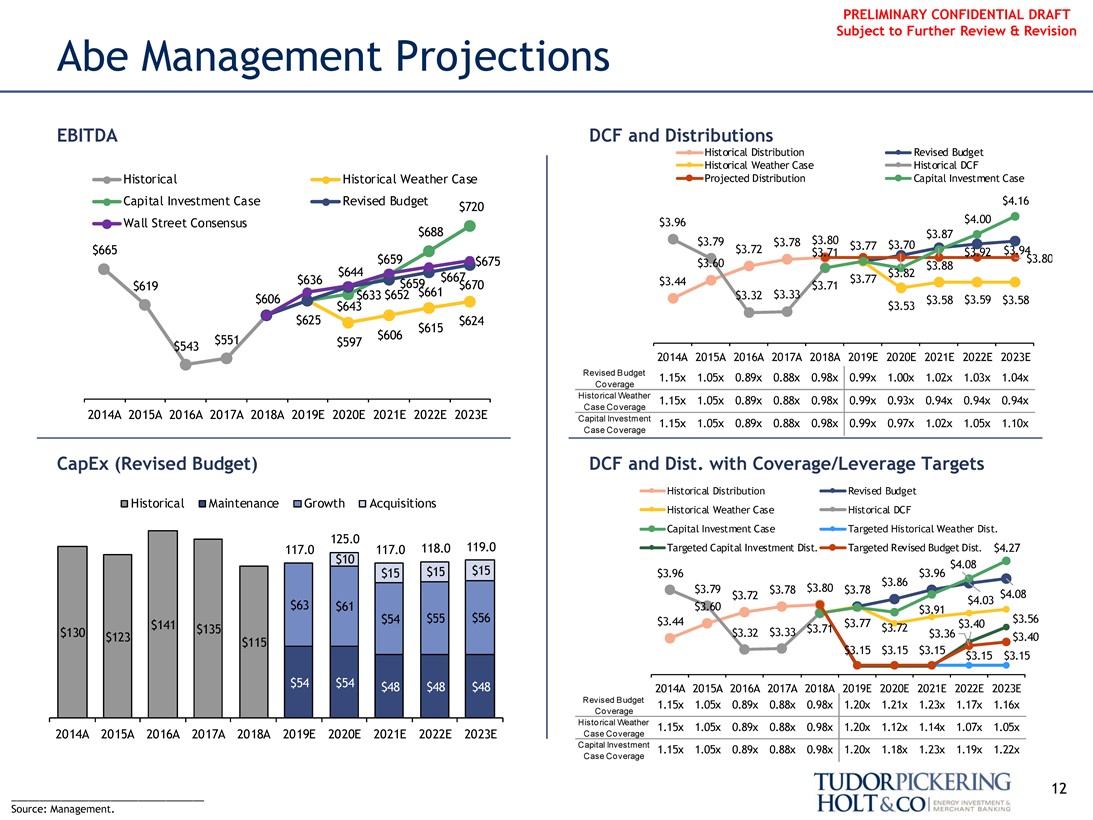
Abe Management Projections
EBITDA DCF and Distributions
Historical Distribution Revised Budget
Historical Weather Case Historical DCF
Historical Historical Weather Case Projected Distribution Capital Investment Case
Capital Investment Case Revised Budget $720 $4.16 Wall Street Consensus $3.96 $4.00 $688 $3.87 $3.79 $3.78 $3.80 $3.70 $665 $3.72 $3.77 $3.94 $3.71 $3.92 $659 $675 $3.60 $3.80 $3.88 $644 $667 $3.82 $636 $659 $670 $3.44 $3.77 $619 $3.71 $633 $652 $661 $3.32 $3.33 $606 $3.58 $3.59 $3.58 $643 $3.53 $625 $624 $615 $551 $606 $543 $597
2014A 2015A 2016A 2017A 2018A 2019E 2020E 2021E 2022E 2023E Revised Budget 1.15x 1.05x 0.89x 0.88x 0.98x 0.99x 1.00x 1.02x 1.03x 1.04x
Coverage
Historical Weather 1.15x 1.05x 0.89x 0.88x 0.98x 0.99x 0.93x 0.94x 0.94x 0.94x
Case Coverage
2014A 2015A 2016A 2017A 2018A 2019E 2020E 2021E 2022E 2023E Capital Investment
1.15x 1.05x 0.89x 0.88x 0.98x 0.99x 0.97x 1.02x 1.05x 1.10x
Case Coverage
CapEx (Revised Budget) DCF and Dist. with Coverage/Leverage Targets
Historical Distribution Revised Budget
Historical Maintenance Growth Acquisitions
Historical Weather Case Historical DCF
125.0 Capital Investment Case Targeted Historical Weather Dist. 117.0 $10 117.0 118.0 119.0 Targeted Capital Investment Dist. Targeted Revised Budget Dist. $4.27 $4.08
$15 $15 $15 $3.96 $3.86 $3.96 $3.79 $3.78 $3.80 $3.78 $3.72 $4.08
$63 $4.03
$61 $55 $56 $3.60 $3.91 $141 $54 $3.44 $3.77 $3.40 $3.56 $130 $135 $3.32 $3.33 $3.71 $3.72 $123 $3.36 $3.40 $115 $3.15 $3.15 $3.15 $3.15 $3.15
2014A 2015A 2016A 2017A 2018A 2019E 2020E 2021E 2022E 2023E
Revised Budget 1.15x 1.05x 0.89x 0.88x 0.98x 1.20x 1.21x 1.23x 1.17x 1.16x
Coverage
Historical Weather 1.15x 1.05x 0.89x 0.88x 0.98x 1.20x 1.12x 1.14x 1.07x 1.05x
2014A 2015A 2016A 2017A 2018A 2019E 2020E 2021E 2022E 2023E Case Coverage
Capital Investment 1.15x 1.05x 0.89x 0.88x 0.98x 1.20x 1.18x 1.23x 1.19x 1.22x
Case Coverage
12
___________________________________ Source: Management.
TUDORPICKERING HOLT&CO
ENERGY INVESTMENT & MERCHANT BANKING
PRELIMINARY CONFIDENTIAL DRAFT Subject to Further Review & Revision
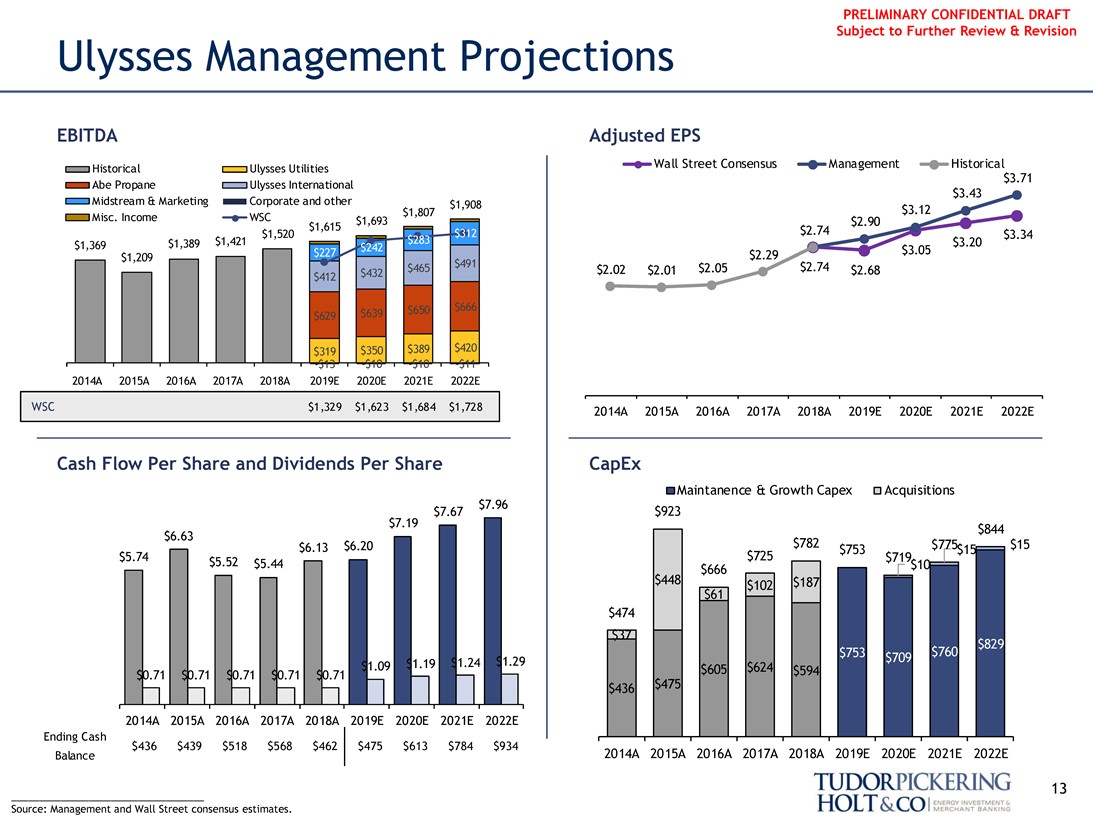
Ulysses Management Projections
EBITDA Adjusted EPS
Historical Ulysses Utilities Wall Street Consensus Management Historical $3.71
Abe Propane Ulysses International $3.43
Midstream & Marketing Corporate and other $1,908 $1,807 $3.12 Misc. Income WSC $1,693 $2.90 $1,615 $2.74 $1,520 $3.34 $1,389 $1,421 $3.20 $1,369 $3.05 $1,209 $491 $2.29 $465 $2.02 $2.01 $2.05 $2.74 $2.68 $412 $432
$650 $666 $629 $639
$319 $350 $389 $420
-$13 -$10 -$10 -$11 2014A 2015A 2016A 2017A 2018A 2019E 2020E 2021E 2022E
WSC $1,329 $1,623 $1,684 $1,728 2014A 2015A 2016A 2017A 2018A 2019E 2020E 2021E 2022E
Cash Flow Per Share and Dividends Per Share CapEx
Maintanence & Growth Capex Acquisitions $7.96 $7.19 $7.67 $923 $844 $6.63 $6.13 $6.20 $782 $775 $15 $753 $15 $5.74 $5.52 $725 $719 $5.44 $666 $10 $448 $102 $187 $61 $474 $37 $1.09 $1.19 $1.24 $1.29 $624 $0.71 $0.71 $0.71 $0.71 $0.71 $605 $594 $436 $475
2014A 2015A 2016A 2017A 2018A 2019E 2020E 2021E 2022E
Ending Cash $436 $439 $518 $568 $462 $475 $613 $784 $934
Balance 2014A 2015A 2016A 2017A 2018A 2019E 2020E 2021E 2022E
13
Source: Management and Wall Street consensus estimates.
TUDORPICKERING HOLT&CO
ENERGY INVESTMENT & MERCHANT BANKING
PRELIMINARY CONFIDENTIAL DRAFT Subject to Further Review & Revision
III. Abe Financial Analysis
14
TUDORPICKERING HOLT&CO
ENERGY INVESTMENT & MERCHANT BANKING
PRELIMINARY CONFIDENTIAL DRAFT Subject to Further Review & Revision
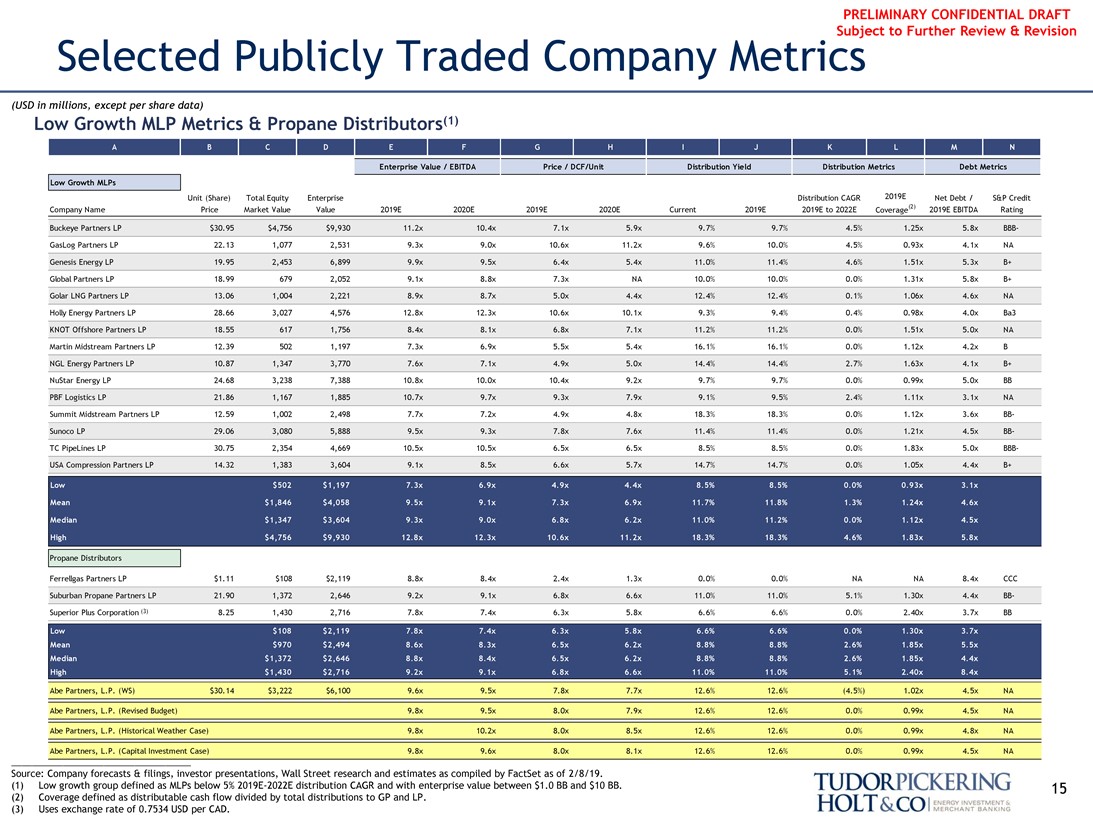
Selected Publicly Traded Company Metrics
(USD in millions, except per share data)A B C D E F GH I J K L M N
Low Growth MLP Metrics & Propane Distributors(1)
Enterprise Value / EBITDA Price / DCF/Unit Distribution Yield Distribution Metrics Debt Metrics Low Growth MLPs
Unit (Share) Total Equity Enterprise Distribution CAGR 2019E Net Debt / S&P Credit Company Name Price Market Value Value 2019E 2020E 2019E 2020E Current 2019E 2019E to 2022E Coverage(2) 2019E EBITDA Rating Buckeye Partners LP $30.95 $4,756 $9,930 11.2x 10.4x 7.1x 5.9x 9.7% 9.7% 4.5% 1.25x 5.8x BBB-
GasLog Partners LP 22.13 1,077 2,531 9.3x 9.0x 10.6x 11.2x 9.6% 10.0% 4.5% 0.93x 4.1x NA Genesis Energy LP 19.95 2,453 6,899 9.9x 9.5x 6.4x 5.4x 11.0% 11.4% 4.6% 1.51x 5.3x B+ Global Partners LP 18.99 679 2,052 9.1x 8.8x 7.3x NA 10.0% 10.0% 0.0% 1.31x 5.8x B+ Golar LNG Partners LP 13.06 1,004 2,221 8.9x 8.7x 5.0x 4.4x 12.4% 12.4% 0.1% 1.06x 4.6x NA Holly Energy Partners LP 28.66 3,027 4,576 12.8x 12.3x 10.6x 10.1x 9.3% 9.4% 0.4% 0.98x 4.0x Ba3 KNOT Offshore Partners LP 18.55 617 1,756 8.4x 8.1x 6.8x 7.1x 11.2% 11.2% 0.0% 1.51x 5.0x NA Martin Midstream Partners LP 12.39 502 1,197 7.3x 6.9x 5.5x 5.4x 16.1% 16.1% 0.0% 1.12x 4.2x B NGL Energy Partners LP 10.87 1,347 3,770 7.6x 7.1x 4.9x 5.0x 14.4% 14.4% 2.7% 1.63x 4.1x B+ NuStar Energy LP 24.68 3,238 7,388 10.8x 10.0x 10.4x 9.2x 9.7% 9.7% 0.0% 0.99x 5.0x BB PBF Logistics LP 21.86 1,167 1,885 10.7x 9.7x 9.3x 7.9x 9.1% 9.5% 2.4% 1.11x 3.1x NA Summit Midstream Partners LP 12.59 1,002 2,498 7.7x 7.2x 4.9x 4.8x 18.3% 18.3% 0.0% 1.12x 3.6xBB-Sunoco LP 29.06 3,080 5,888 9.5x 9.3x 7.8x 7.6x 11.4% 11.4% 0.0% 1.21x 4.5xBB-TC PipeLines LP 30.75 2,354 4,669 10.5x 10.5x 6.5x 6.5x 8.5% 8.5% 0.0% 1.83x 5.0xBBB-USA Compression Partners LP 14.32 1,383 3,604 9.1x 8.5x 6.6x 5.7x 14.7% 14.7% 0.0% 1.05x 4.4x B+ Low $502 $1,197 7.3x 6.9x 4.9x 4.4x 8.5% 8.5% 0.0% 0.93x 3.1x Mean $1,846 $4,058 9.5x 9.1x 7.3x 6.9x 11.7% 11.8% 1.3% 1.24x 4.6x Median $1,347 $3,604 9.3x 9.0x 6.8x 6.2x 11.0% 11.2% 0.0% 1.12x 4.5x High $4,756 $9,930 12.8x 12.3x 10.6x 11.2x 18.3% 18.3% 4.6% 1.83x 5.8x
Propane Distributors
Ferrellgas Partners LP $1.11 $108 $2,119 8.8x 8.4x 2.4x 1.3x 0.0% 0.0% NA NA 8.4x CCC
Suburban Propane Partners LP 21.90 1,372 2,646 9.2x 9.1x 6.8x 6.6x 11.0% 11.0% 5.1% 1.30x 4.4xBB-Superior Plus Corporation (3) 8.25 1,430 2,716 7.8x 7.4x 6.3x 5.8x 6.6% 6.6% 0.0% 2.40x 3.7x BBLow $108 $2,119 7.8x 7.4x 6.3x 5.8x 6.6% 6.6% 0.0% 1.30x 3.7x Mean $970 $2,494 8.6x 8.3x 6.5x 6.2x 8.8% 8.8% 2.6% 1.85x 5.5x Median $1,372 $2,646 8.8x 8.4x 6.5x 6.2x 8.8% 8.8% 2.6% 1.85x 4.4x High $1,430 $2,716 9.2x 9.1x 6.8x 6.6x 11.0% 11.0% 5.1% 2.40x 8.4x
Abe Partners, L.P. (WS) $30.14 $3,222 $6,100 9.6x 9.5x 7.8x 7.7x 12.6% 12.6% (4.5%) 1.02x 4.5x NA Abe Partners, L.P. (Revised Budget) 9.8x 9.5x 8.0x 7.9x 12.6% 12.6% 0.0% 0.99x 4.5x NA Abe Partners, L.P. (Historical Weather Case) 9.8x 10.2x 8.0x 8.5x 12.6% 12.6% 0.0% 0.99x 4.8x NA
Abe Partners, L.P. (Capital Investment Case) 9.8x 9.6x 8.0x 8.1x 12.6% 12.6% 0.0% 0.99x 4.5x NA
Source: Company forecasts & filings, investor presentations, Wall Street research and estimates as compiled by FactSet as of 2/8/19.
(1) Low growth group defined as MLPs below 5% 2019E-2022E distribution CAGR and with enterprise value between $1.0 BB and $10 BB. 15 (2) Coverage defined as distributable cash flow divided by total distributions to GP and LP.
(3) Uses exchange rate of 0.7534 USD per CAD.
TUDORPICKERING HOLT&CO
ENERGY INVESTMENT & MERCHANT BANKING
PRELIMINARY CONFIDENTIAL DRAFT Subject to Further Review & Revision
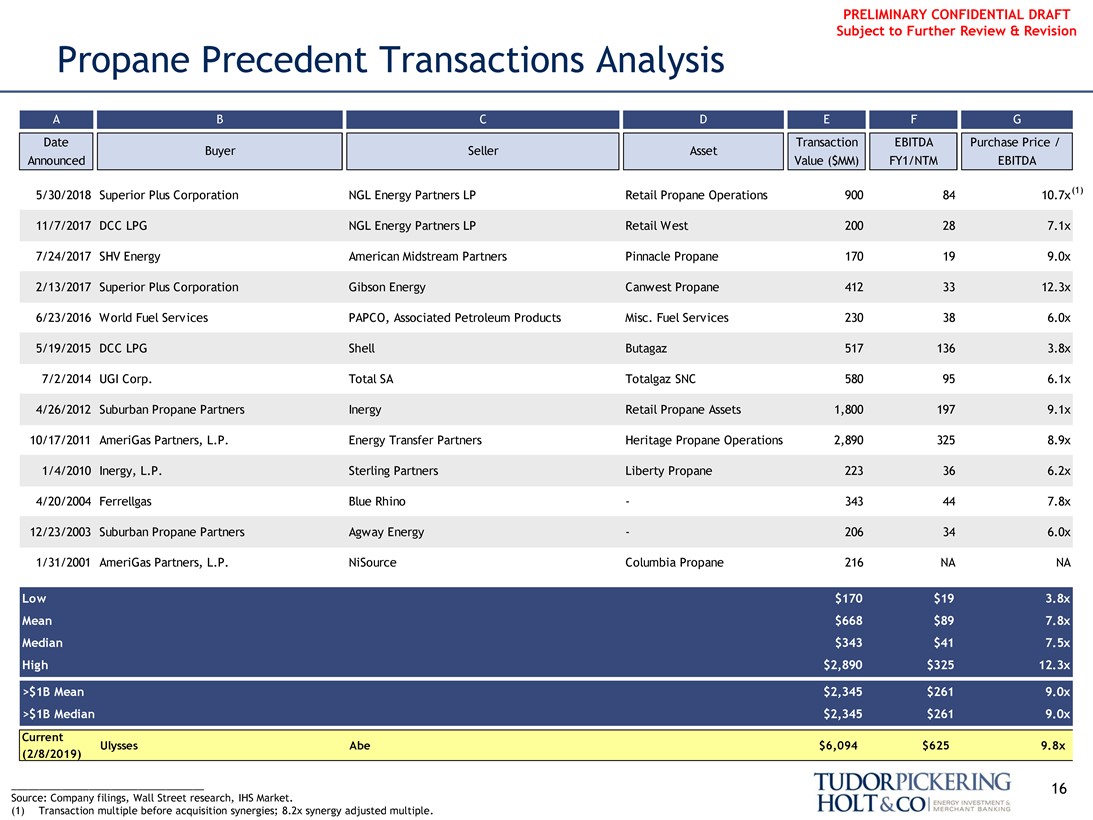
Propane Precedent Transactions AnalysisA B C D E F G
Date Transaction EBITDA Purchase Price / Buyer Seller Asset Announced Value ($MM) FY1/NTM EBITDA
5/30/2018 Superior Plus Corporation NGL Energy Partners LP Retail Propane Operations 900 84 10.7x(1) 11/7/2017 DCC LPG NGL Energy Partners LP Retail West 200 28 7.1x 7/24/2017 SHV Energy American Midstream Partners Pinnacle Propane 170 19 9.0x 2/13/2017 Superior Plus Corporation Gibson Energy Canwest Propane 412 33 12.3x 6/23/2016 World Fuel Services PAPCO, Associated Petroleum Products Misc. Fuel Services 230 38 6.0x 5/19/2015 DCC LPG Shell Butagaz 517 136 3.8x 7/2/2014 UGI Corp. Total SA Totalgaz SNC 580 95 6.1x 4/26/2012 Suburban Propane Partners Inergy Retail Propane Assets 1,800 197 9.1x 10/17/2011 AmeriGas Partners, L.P. Energy Transfer Partners Heritage Propane Operations 2,890 325 8.9x 1/4/2010 Inergy, L.P. Sterling Partners Liberty Propane 223 36 6.2x 4/20/2004 Ferrellgas Blue Rhino-343 44 7.8x 12/23/2003 Suburban Propane Partners Agway Energy-206 34 6.0x 1/31/2001 AmeriGas Partners, L.P. NiSource Columbia Propane 216 NA NA
CurrentLow $170 $19 3.8x Mean $668 $89 7.8x Median $343 $41 7.5x High $2,890 $325 12.3x>$1B Mean $2,345 $261 9.0x
>$1B Median $2,345 $261 9.0x
Ulysses Abe $6,094 $625 9.8x (2/8/2019)
___________________________________ 16 Source: Company filings, Wall Street research, IHS Market.
(1) Transaction multiple before acquisition synergies; 8.2x synergy adjusted multiple.
TUDORPICKERING HOLT&CO
ENERGY INVESTMENT & MERCHANT BANKING
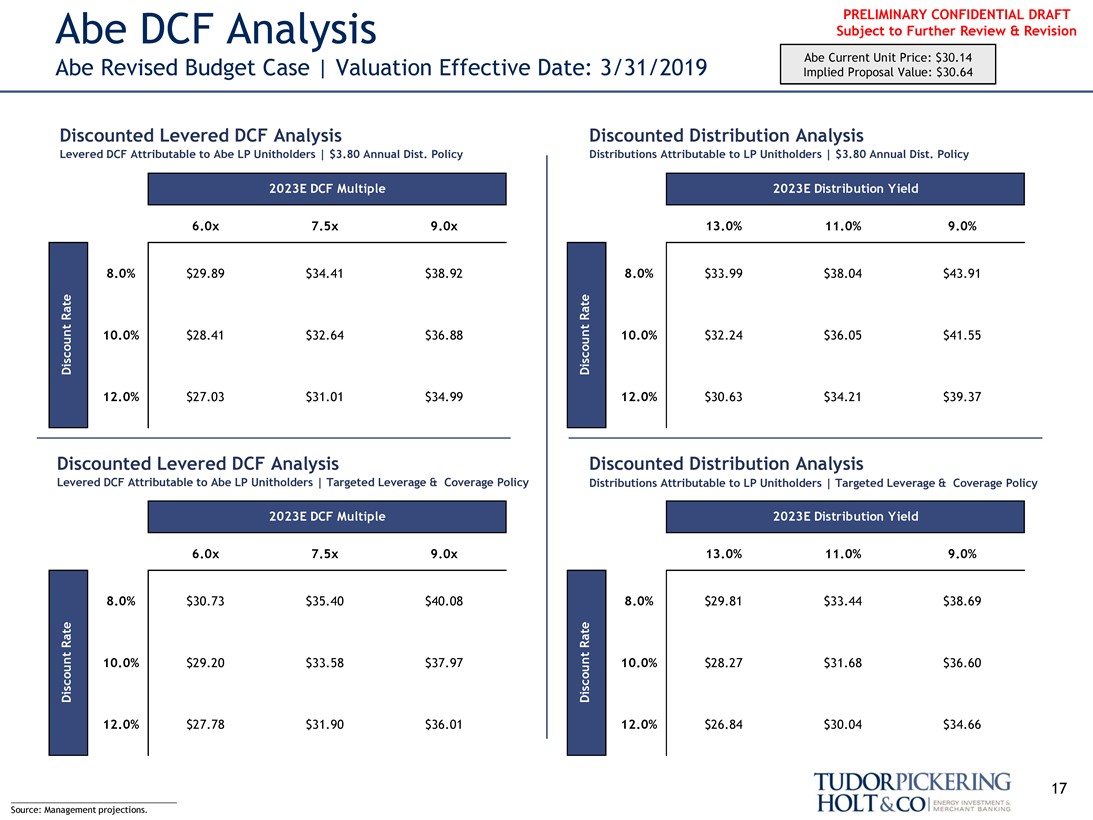
PRELIMINARY CONFIDENTIAL DRAFT Abe DCF Analysis Subject to Further Review & Revision
Abe Revised Budget Case | Valuation Effective Date: 3/31/2019 Abe Current Unit Price: $30.14
Implied Proposal Value: $30.64
Discounted Levered DCF Analysis Discounted Distribution Analysis
Levered DCF Attributable to Abe LP Unitholders | $3.80 Annual Dist. Policy Distributions Attributable to LP Unitholders | $3.80 Annual Dist. Policy
2023E DCF Multiple 2023E Distribution Yield
Discount Rate
Discount Rate
6.0x 7.5x 9.0x 13.0% 11.0% 9.0%
8.0% $29.89 $34.41 $38.92 8.0% $33.99 $38.04 $43.91
10.0% $28.41 $32.64 $36.88 10.0% $32.24 $36.05 $41.55 12.0% $27.03 $31.01 $34.99 12.0% $30.63 $34.21 $39.37
Discounted Levered DCF Analysis Discounted Distribution Analysis
Levered DCF Attributable to Abe LP Unitholders | Targeted Leverage & Coverage Policy Distributions Attributable to LP Unitholders | Targeted Leverage & Coverage Policy
2023E DCF Multiple 2023E Distribution Yield
Discount Rate
Discount Rate
6.0x 7.5x 9.0x 13.0% 11.0% 9.0%
8.0% $30.73 $35.40 $40.08 8.0% $29.81 $33.44 $38.69
10.0% $29.20 $33.58 $37.97 10.0% $28.27 $31.68 $36.60 12.0% $27.78 $31.90 $36.01 12.0% $26.84 $30.04 $34.66
___________________________________ 17 Source: Management projections.
TUDORPICKERING HOLT&CO
ENERGY INVESTMENT & MERCHANT BANKING
PRELIMINARY CONFIDENTIAL DRAFT
Abe Illustrative Discounted Future Value Subject to Further Review & Revision
Abe Revised Budget Case
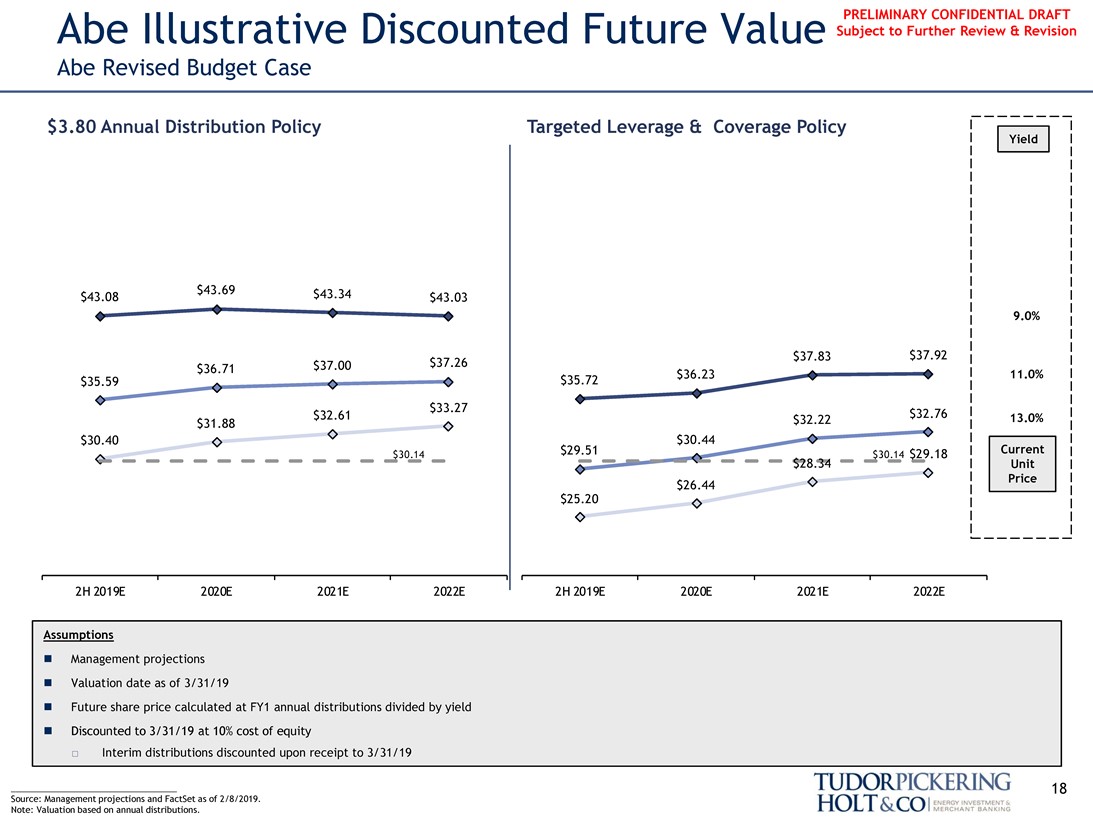
$3.80 Annual Distribution Policy Targeted Leverage & Coverage Policy
Yield
$43.69 $43.34 $43.08 $43.03
9.0%
$37.83 $37.92 $37.00 $37.26 $36.71 $35.72 $36.23 11.0% $35.59 $33.27 $32.76 $32.61 $32.22 13.0% $31.88 $30.40 $30.44 $30.14 $29.51 $30.14 $29.18 Current $28.34 Unit Price $26.44 $25.20
2H 2019E 2020E 2021E 2022E 2H 2019E 2020E 2021E 2022E
Assumptions
∎ Management projections ∎ Valuation date as of 3/31/19
∎ Future share price calculated at FY1 annual distributions divided by yield
∎ Discounted to 3/31/19 at 10% cost of equity
☐ Interim distributions discounted upon receipt to 3/31/19
___________________________________ 18 Source: Management projections and FactSet as of 2/8/2019.
Note: Valuation based on annual distributions.
TUDORPICKERING HOLT&CO
ENERGY INVESTMENT & MERCHANT BANKING
PRELIMINARY CONFIDENTIAL DRAFT Abe DCF Analysis Subject to Further Review & Revision
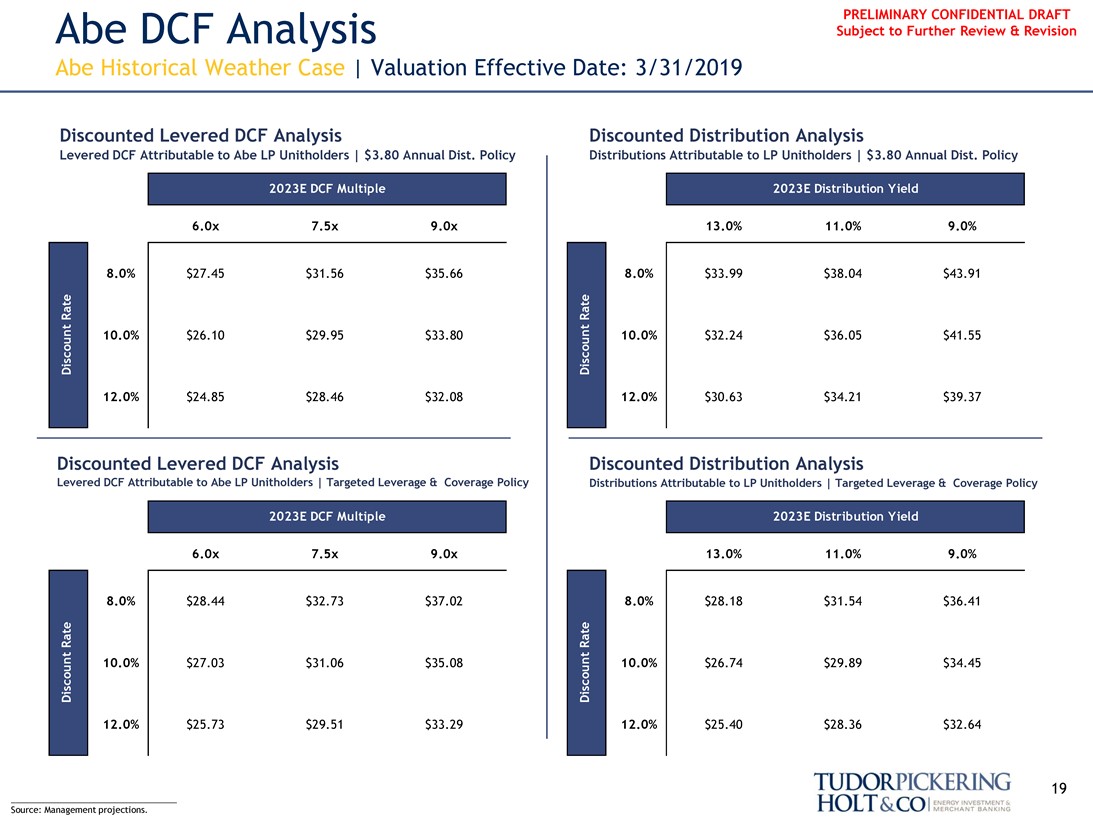
Abe Historical Weather Case | Valuation Effective Date: 3/31/2019
Discounted Levered DCF Analysis Discounted Distribution Analysis
Levered DCF Attributable to Abe LP Unitholders | $3.80 Annual Dist. Policy Distributions Attributable to LP Unitholders | $3.80 Annual Dist. Policy
2023E DCF Multiple 2023E Distribution Yield
Discount Rate
Discount Rate
6.0x 7.5x 9.0x 13.0% 11.0% 9.0%
8.0% $27.45 $31.56 $35.66 8.0% $33.99 $38.04 $43.91
10.0% $26.10 $29.95 $33.80 10.0% $32.24 $36.05 $41.55 12.0% $24.85 $28.46 $32.08 12.0% $30.63 $34.21 $39.37
Discounted Levered DCF Analysis Discounted Distribution Analysis
Levered DCF Attributable to Abe LP Unitholders | Targeted Leverage & Coverage Policy Distributions Attributable to LP Unitholders | Targeted Leverage & Coverage Policy
2023E DCF Multiple 2023E Distribution Yield
Discount Rate
Discount Rate
6.0x 7.5x 9.0x 13.0% 11.0% 9.0%
8.0% $28.44 $32.73 $37.02 8.0% $28.18 $31.54 $36.41
10.0% $27.03 $31.06 $35.08 10.0% $26.74 $29.89 $34.45 12.0% $25.73 $29.51 $33.29 12.0% $25.40 $28.36 $32.64
___________________________________ 19 Source: Management projections.
TUDORPICKERING HOLT&CO
ENERGY INVESTMENT & MERCHANT BANKING
PRELIMINARY CONFIDENTIAL DRAFT
Abe Illustrative Discounted Future Value Subject to Further Review & Revision
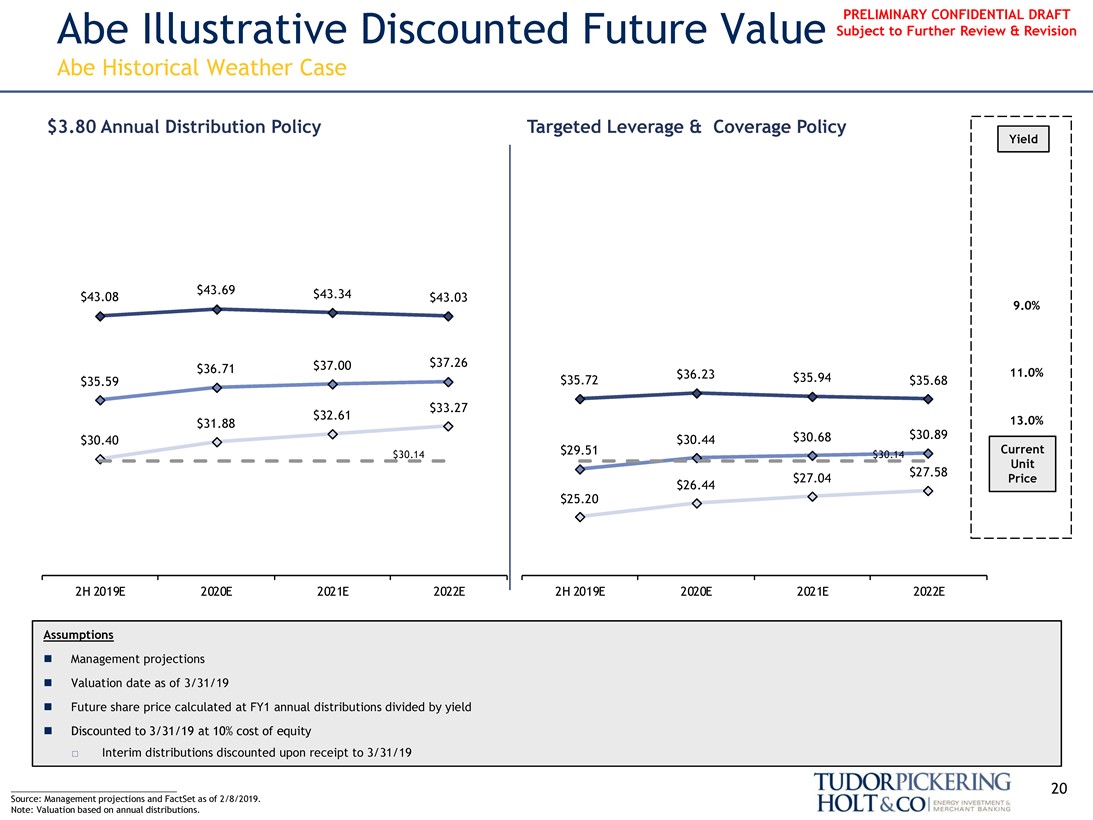
Abe Historical Weather Case
$3.80 Annual Distribution Policy Targeted Leverage & Coverage Policy
Yield
$43.69 $43.34 $43.08 $43.03
9.0%
$37.00 $37.26 $36.71 $36.23 11.0% $35.59 $35.72 $35.94 $35.68 $33.27 $32.61 13.0% $31.88 $30.89 $30.40 $30.44 $30.68 $30.14 $29.51 $30.14 Current Unit $27.58 $27.04 Price $26.44 $25.20
2H 2019E 2020E 2021E 2022E 2H 2019E 2020E 2021E 2022E
Assumptions
∎ Management projections ∎ Valuation date as of 3/31/19
∎ Future share price calculated at FY1 annual distributions divided by yield
∎ Discounted to 3/31/19 at 10% cost of equity
☐ Interim distributions discounted upon receipt to 3/31/19
___________________________________ 20 Source: Management projections and FactSet as of 2/8/2019.
Note: Valuation based on annual distributions.
TUDORPICKERING HOLT&CO
ENERGY INVESTMENT & MERCHANT BANKING
PRELIMINARY CONFIDENTIAL DRAFT Abe DCF Analysis Subject to Further Review & Revision
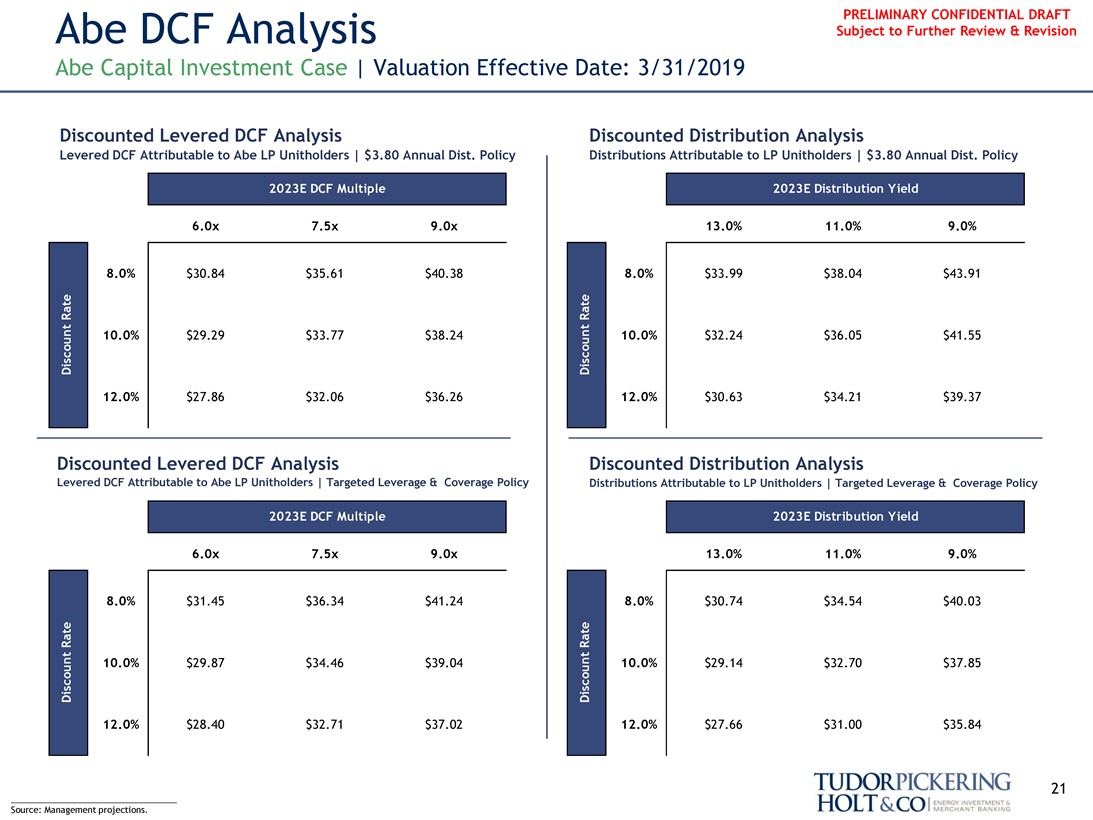
Abe Capital Investment Case | Valuation Effective Date: 3/31/2019
Discounted Levered DCF Analysis Discounted Distribution Analysis
2023E DCF Multiple 2023E Distribution Yield
Discount Rate
Levered DCF Attributable to Abe LP Unitholders | $3.80 Annual Dist. Policy Distributions Attributable to LP Unitholders | $3.80 Annual Dist. Policy
Discount Rate
6.0x 7.5x 9.0x 13.0% 11.0% 9.0%
8.0% $30.84 $35.61 $40.38 8.0% $33.99 $38.04 $43.91
10.0% $29.29 $33.77 $38.24 10.0% $32.24 $36.05 $41.55 12.0% $27.86 $32.06 $36.26 12.0% $30.63 $34.21 $39.37
Discounted Levered DCF Analysis Discounted Distribution Analysis
Levered DCF Attributable to Abe LP Unitholders | Targeted Leverage & Coverage Policy Distributions Attributable to LP Unitholders | Targeted Leverage & Coverage Policy
2023E DCF Multiple 2023E Distribution Yield
Discount Rate
6.0x 7.5x 9.0x 13.0% 11.0% 9.0%
8.0% $31.45 $36.34 $41.24 8.0% $30.74 $34.54 $40.03
Discount Rate
10.0% $29.87 $34.46 $39.04 10.0% $29.14 $32.70 $37.85 12.0% $28.40 $32.71 $37.02 12.0% $27.66 $31.00 $35.84
___________________________________ 21 Source: Management projections.
TUDORPICKERING HOLT&CO
ENERGY INVESTMENT & MERCHANT BANKING
PRELIMINARY CONFIDENTIAL DRAFT
Abe Illustrative Discounted Future Value Subject to Further Review & Revision
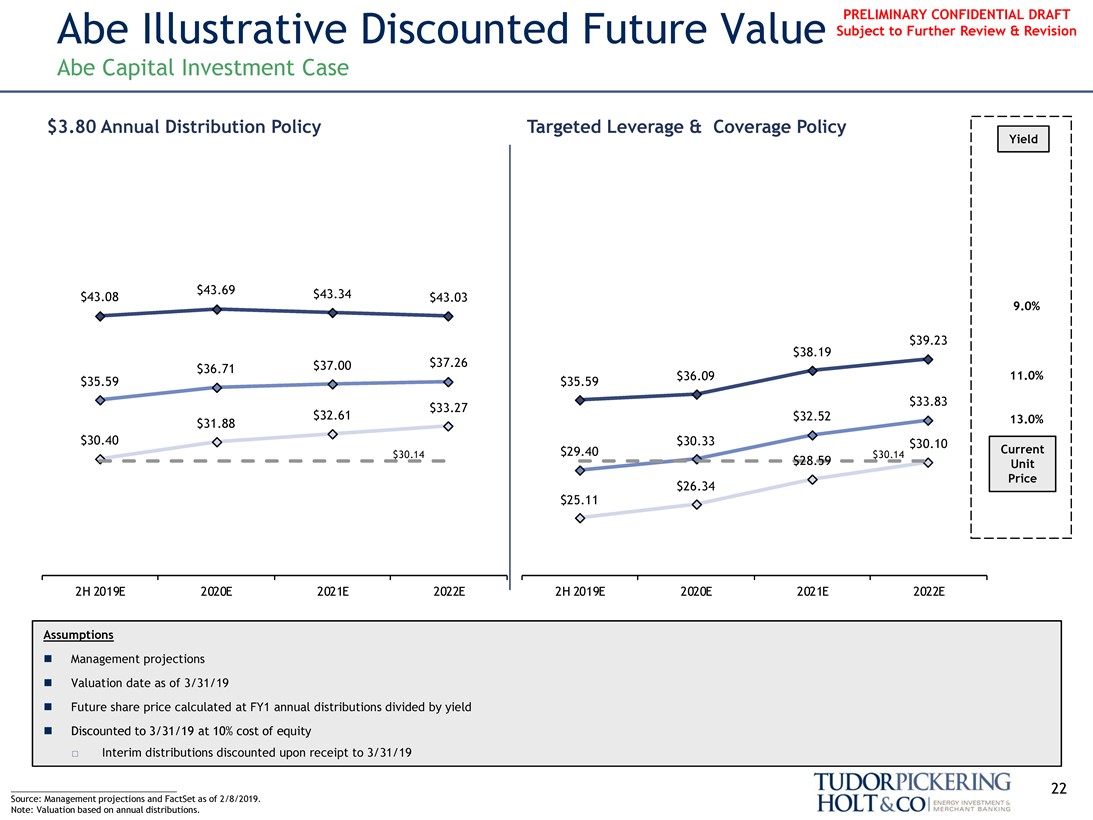
Abe Capital Investment Case
$3.80 Annual Distribution Policy Targeted Leverage & Coverage Policy
Yield
$43.69 $43.34 $43.08 $43.03
9.0%
$38.19 $39.23 $37.00 $37.26 $36.71 $36.09 11.0% $35.59 $35.59 $33.83 $33.27 $32.61 $32.52 13.0% $31.88 $30.40 $30.33 $30.10 $30.14 $29.40 $28.59 $30.14 Current Unit Price $26.34 $25.11
2H 2019E 2020E 2021E 2022E 2H 2019E 2020E 2021E 2022E
Assumptions
∎ Management projections ∎ Valuation date as of 3/31/19
∎ Future share price calculated at FY1 annual distributions divided by yield
∎ Discounted to 3/31/19 at 10% cost of equity
☐ Interim distributions discounted upon receipt to 3/31/19
___________________________________ 22 Source: Management projections and FactSet as of 2/8/2019.
Note: Valuation based on annual distributions.
TUDORPICKERING HOLT&CO
ENERGY INVESTMENT & MERCHANT BANKING
PRELIMINARY CONFIDENTIAL DRAFT Subject to Further Review & Revision
IV. Ulysses Financial Analysis
23
TUDORPICKERING HOLT&CO
ENERGY INVESTMENT & MERCHANT BANKING
PRELIMINARY CONFIDENTIAL DRAFT Subject to Further Review & Revision
Selected Publicly Traded Company Metrics
(USD in millions, except per share data)
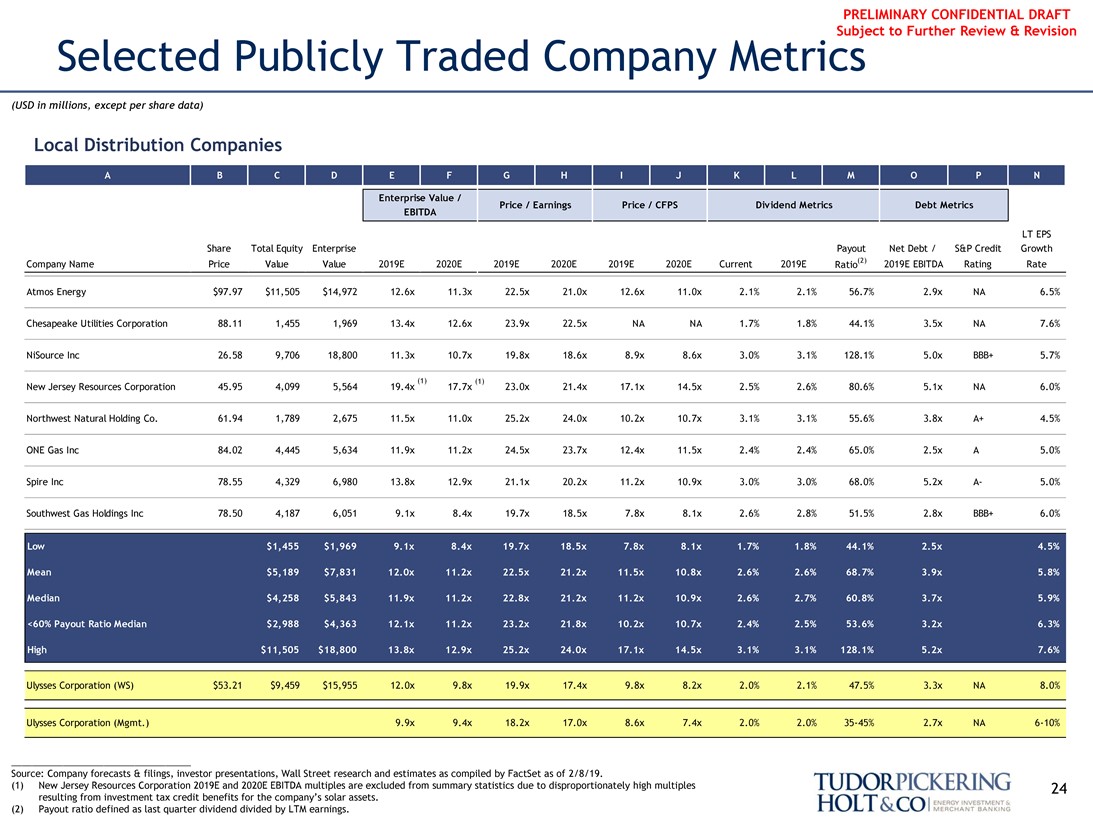
Local Distribution Companies
A B C D E F G H I J K L M O P N
Enterprise Value /
Price / Earnings Price / CFPS Dividend Metrics Debt Metrics EBITDA
LT EPS Share Total Equity Enterprise Payout Net Debt / S&P Credit Growth Company Name Price Value Value 2019E 2020E 2019E 2020E 2019E 2020E Current 2019E Ratio(2) 2019E EBITDA Rating Rate
Atmos Energy $97.97 $11,505 $14,972 12.6x 11.3x 22.5x 21.0x 12.6x 11.0x 2.1% 2.1% 56.7% 2.9x NA 6.5%
Chesapeake Utilities Corporation 88.11 1,455 1,969 13.4x 12.6x 23.9x 22.5x NA NA 1.7% 1.8% 44.1% 3.5x NA 7.6%
NiSource Inc 26.58 9,706 18,800 11.3x 10.7x 19.8x 18.6x 8.9x 8.6x 3.0% 3.1% 128.1% 5.0x BBB+ 5.7%
(1) (1)
New Jersey Resources Corporation 45.95 4,099 5,564 19.4x 17.7x 23.0x 21.4x 17.1x 14.5x 2.5% 2.6% 80.6% 5.1x NA 6.0% Northwest Natural Holding Co. 61.94 1,789 2,675 11.5x 11.0x 25.2x 24.0x 10.2x 10.7x 3.1% 3.1% 55.6% 3.8x A+ 4.5% ONE Gas Inc 84.02 4,445 5,634 11.9x 11.2x 24.5x 23.7x 12.4x 11.5x 2.4% 2.4% 65.0% 2.5x A 5.0% Spire Inc 78.55 4,329 6,980 13.8x 12.9x 21.1x 20.2x 11.2x 10.9x 3.0% 3.0% 68.0% 5.2xA- 5.0% Southwest Gas Holdings Inc 78.50 4,187 6,051 9.1x 8.4x 19.7x 18.5x 7.8x 8.1x 2.6% 2.8% 51.5% 2.8x BBB+ 6.0%
Low $1,455 $1,969 9.1x 8.4x 19.7x 18.5x 7.8x 8.1x 1.7% 1.8% 44.1% 2.5x 4.5% Mean $5,189 $7,831 12.0x 11.2x 22.5x 21.2x 11.5x 10.8x 2.6% 2.6% 68.7% 3.9x 5.8% Median $4,258 $5,843 11.9x 11.2x 22.8x 21.2x 11.2x 10.9x 2.6% 2.7% 60.8% 3.7x 5.9% <60% Payout Ratio Median $2,988 $4,363 12.1x 11.2x 23.2x 21.8x 10.2x 10.7x 2.4% 2.5% 53.6% 3.2x 6.3% High $11,505 $18,800 13.8x 12.9x 25.2x 24.0x 17.1x 14.5x 3.1% 3.1% 128.1% 5.2x 7.6%
Ulysses Corporation (WS) $53.21 $9,459 $15,955 12.0x 9.8x 19.9x 17.4x 9.8x 8.2x 2.0% 2.1% 47.5% 3.3x NA 8.0%
Ulysses Corporation (Mgmt.) 9.9x 9.4x 18.2x 17.0x 8.6x 7.4x 2.0% 2.0%35-45% 2.7x NA6-10%
Source: Company forecasts & filings, investor presentations, Wall Street research and estimates as compiled by FactSet as of 2/8/19.
(1) New Jersey Resources Corporation 2019E and 2020E EBITDA multiples are excluded from summary statistics due to disproportionately high multiples 24 resulting from investment tax credit benefits for the company’s solar assets.
(2) Payout ratio defined as last quarter dividend divided by LTM earnings.
TUDORPICKERING HOLT&CO
ENERGY INVESTMENT & MERCHANT BANKING
PRELIMINARY CONFIDENTIAL DRAFT Subject to Further Review & Revision
Selected Publicly Traded Company Metrics
(USD in millions, except per share data)
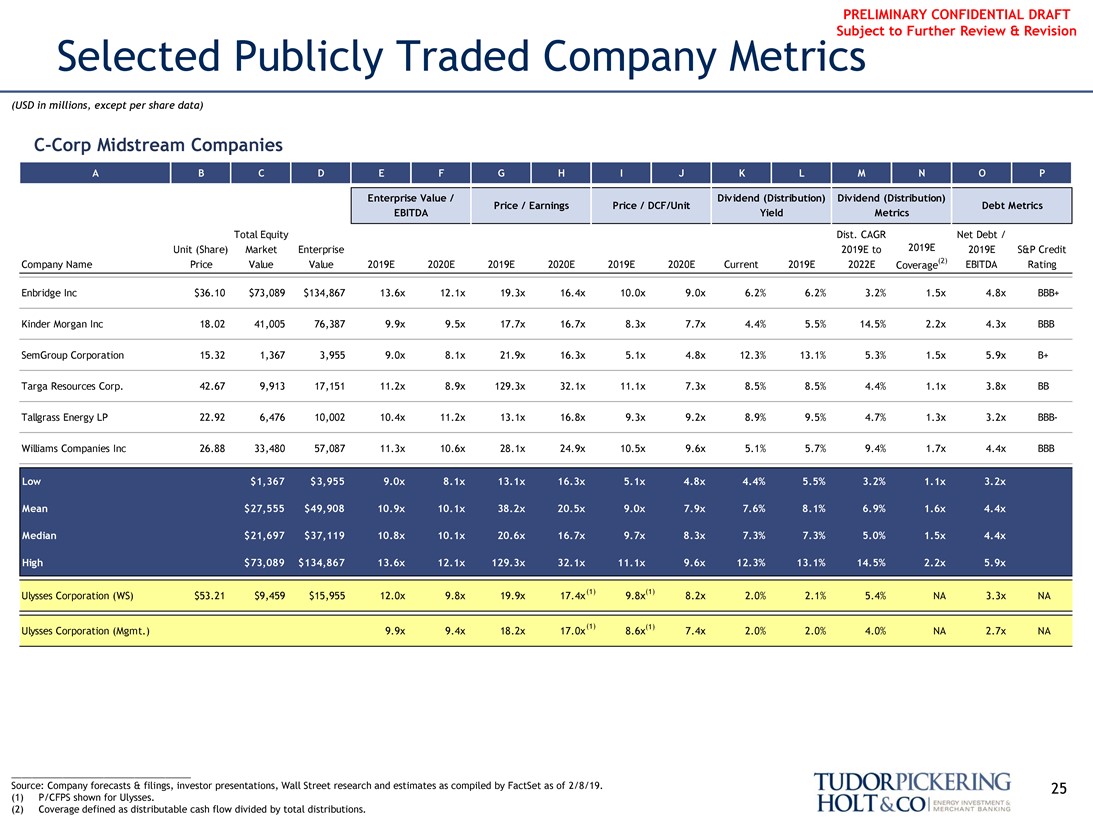
C-Corp Midstream Companies
A B C D E F G H I J K L M N O P
Enterprise Value / Dividend (Distribution) Dividend (Distribution)
Price / Earnings Price / DCF/Unit Debt Metrics EBITDA Yield Metrics
Total Equity Dist. CAGR Net Debt /
Unit (Share) Market Enterprise 2019E to 2019E 2019E S&P Credit Company Name Price Value Value 2019E 2020E 2019E 2020E 2019E 2020E Current 2019E 2022E Coverage(2) EBITDA Rating
Enbridge Inc $36.10 $73,089 $134,867 13.6x 12.1x 19.3x 16.4x 10.0x 9.0x 6.2% 6.2% 3.2% 1.5x 4.8x BBB+ Kinder Morgan Inc 18.02 41,005 76,387 9.9x 9.5x 17.7x 16.7x 8.3x 7.7x 4.4% 5.5% 14.5% 2.2x 4.3x BBB SemGroup Corporation 15.32 1,367 3,955 9.0x 8.1x 21.9x 16.3x 5.1x 4.8x 12.3% 13.1% 5.3% 1.5x 5.9x B+ Targa Resources Corp. 42.67 9,913 17,151 11.2x 8.9x 129.3x 32.1x 11.1x 7.3x 8.5% 8.5% 4.4% 1.1x 3.8x BB Tallgrass Energy LP 22.92 6,476 10,002 10.4x 11.2x 13.1x 16.8x 9.3x 9.2x 8.9% 9.5% 4.7% 1.3x 3.2xBBB-Williams Companies Inc 26.88 33,480 57,087 11.3x 10.6x 28.1x 24.9x 10.5x 9.6x 5.1% 5.7% 9.4% 1.7x 4.4x BBB
Low $1,367 $3,955 9.0x 8.1x 13.1x 16.3x 5.1x 4.8x 4.4% 5.5% 3.2% 1.1x 3.2x Mean $27,555 $49,908 10.9x 10.1x 38.2x 20.5x 9.0x 7.9x 7.6% 8.1% 6.9% 1.6x 4.4x Median $21,697 $37,119 10.8x 10.1x 20.6x 16.7x 9.7x 8.3x 7.3% 7.3% 5.0% 1.5x 4.4x High $73,089 $134,867 13.6x 12.1x 129.3x 32.1x 11.1x 9.6x 12.3% 13.1% 14.5% 2.2x 5.9x
Ulysses Corporation (WS) $53.21 $9,459 $15,955 12.0x 9.8x 19.9x 17.4x(1) 9.8x(1) 8.2x 2.0% 2.1% 5.4% NA 3.3x NA
Ulysses Corporation (Mgmt.) 9.9x 9.4x 18.2x 17.0x(1) 8.6x(1) 7.4x 2.0% 2.0% 4.0% NA 2.7x NA
Source: Company forecasts & filings, investor presentations, Wall Street research and estimates as compiled by FactSet as of 2/8/19. 25 (1) P/CFPS shown for Ulysses.
(2) Coverage defined as distributable cash flow divided by total distributions.
TUDORPICKERING HOLT&CO
ENERGY INVESTMENT & MERCHANT BANKING
PRELIMINARY CONFIDENTIAL DRAFT
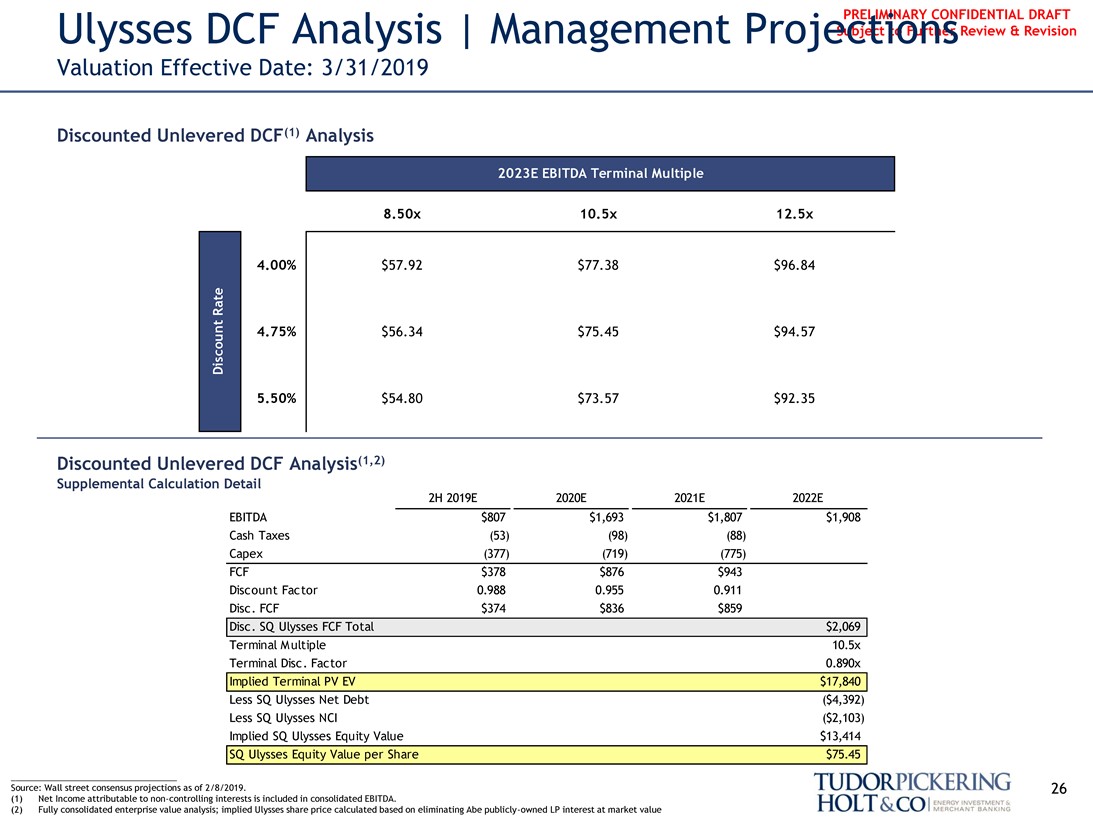
Ulysses DCF Analysis | Management Projections Subject to Further Review & Revision
Valuation Effective Date: 3/31/2019
Discounted Unlevered DCF(1) Analysis
2023E EBITDA Terminal Multiple
Discount Rate
8.50x 10.5x 12.5x
4.00% $57.92 $77.38 $96.84
4.75% $56.34 $75.45 $94.57 5.50% $54.80 $73.57 $92.35
Discounted Unlevered DCF Analysis(1,2)
Supplemental Calculation Detail
2H 2019E 2020E 2021E 2022E
EBITDA $807 $1,693 $1,807 $1,908 Cash Taxes (53) (98) (88) Capex (377) (719) (775) FCF $378 $876 $943 Discount Factor 0.988 0.955 0.911 Disc. FCF $374 $836 $859 Disc. SQ Ulysses FCF Total $2,069 Terminal Multiple 10.5x Terminal Disc. Factor 0.890x Implied Terminal PV EV $17,840 Less SQ Ulysses Net Debt ($4,392) Less SQ Ulysses NCI ($2,103) Implied SQ Ulysses Equity Value $13,414 SQ Ulysses Equity Value per Share $75.45
Source: Wall street consensus projections as of 2/8/2019. 26 (1) Net Income attributable tonon-controlling interests is included in consolidated EBITDA.
(2) Fully consolidated enterprise value analysis; implied Ulysses share price calculated based on eliminating Abe publicly-owned LP interest at market value
TUDORPICKERING HOLT&CO
ENERGY INVESTMENT & MERCHANT BANKING
PRELIMINARY CONFIDENTIAL DRAFT Subject to Further Review & Revision
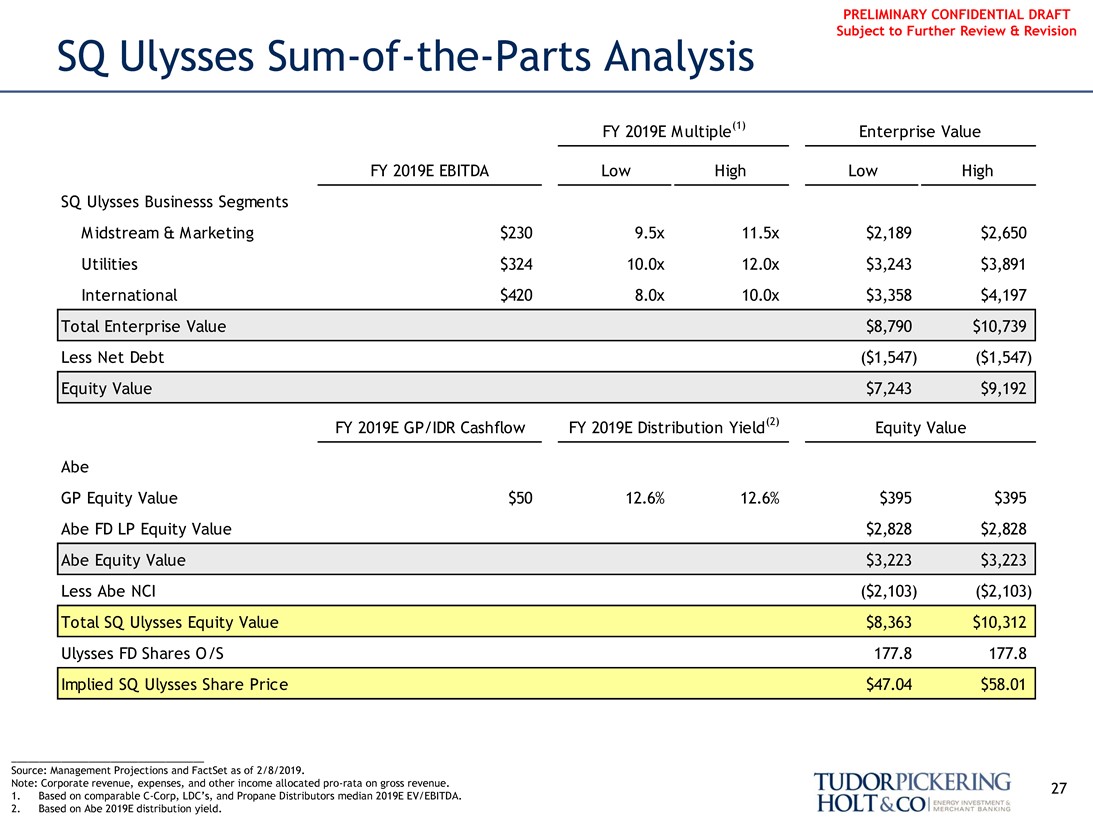
SQ UlyssesSum-of-the-Parts Analysis
FY 2019E Multiple(1) Enterprise Value
FY 2019E EBITDA Low High Low High SQ Ulysses Businesss Segments Midstream & Marketing $230 9.5x 11.5x $2,189 $2,650 Utilities $324 10.0x 12.0x $3,243 $3,891 International $420 8.0x 10.0x $3,358 $4,197 Total Enterprise Value $8,790 $10,739 Less Net Debt ($1,547) ($1,547) Equity Value $7,243 $9,192
FY 2019E GP/IDR Cashflow FY 2019E Distribution Yield(2) Equity Value
Abe
GP Equity Value $50 12.6% 12.6% $395 $395 Abe FD LP Equity Value $2,828 $2,828 Abe Equity Value $3,223 $3,223 Less Abe NCI ($2,103) ($2,103) Total SQ Ulysses Equity Value $8,363 $10,312 Ulysses FD Shares O/S 177.8 177.8 Implied SQ Ulysses Share Price $47.04 $58.01
Source: Management Projections and FactSet as of 2/8/2019.
Note: Corporate revenue, expenses, and other income allocatedpro-rata on gross revenue. 27
1. Based on comparableC-Corp, LDC’s, and Propane Distributors median 2019E EV/EBITDA.
2. Based on Abe 2019E distribution yield.
TUDORPICKERING HOLT&CO
ENERGY INVESTMENT & MERCHANT BANKING

PRELIMINARY CONFIDENTIAL DRAFT Subject to Further Review & Revision
V. Transaction Analysis
28
TUDORPICKERING HOLT&CO
ENERGY INVESTMENT & MERCHANT BANKING
PRELIMINARY CONFIDENTIAL DRAFT Subject to Further Review & Revision
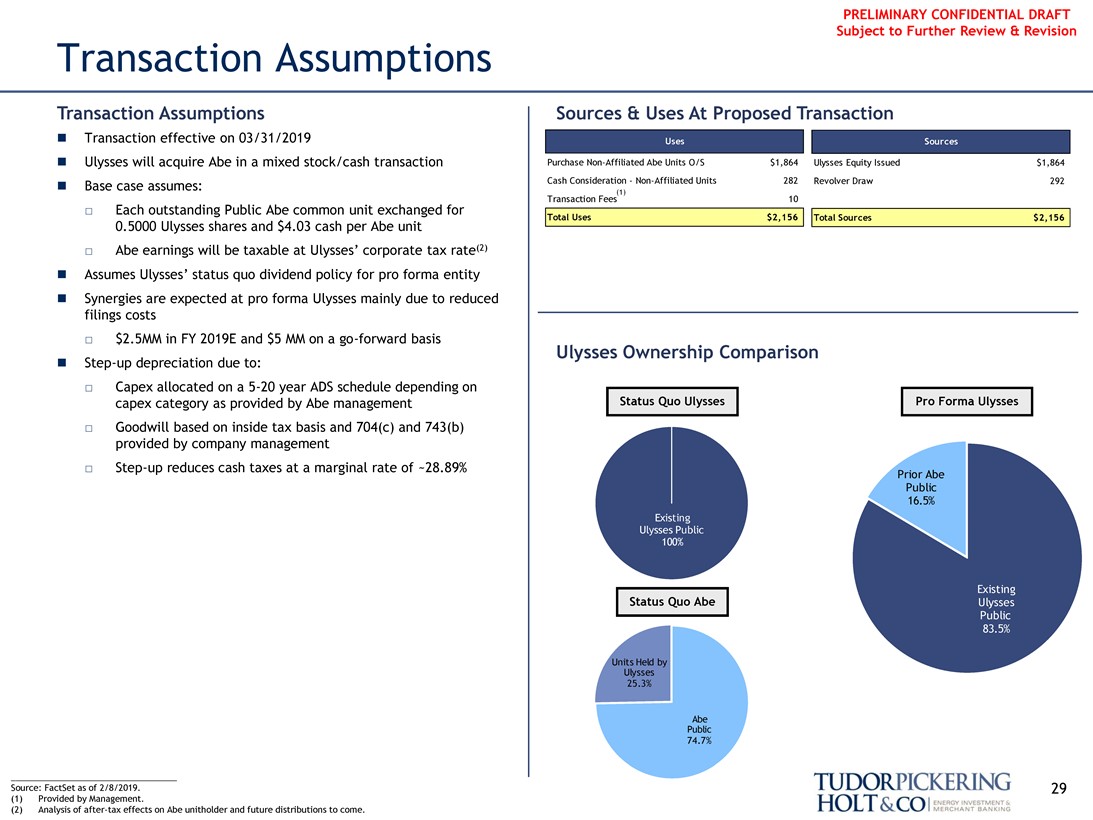
Transaction Assumptions
Transaction Assumptions Sources & Uses At Proposed Transaction
∎ Transaction effective on 03/31/2019
∎ Ulysses will acquire Abe in a mixed stock/cash transaction PurchaseNon-Affiliated Abe Units O/S $1,864 Ulysses Equity Issued $1,864
∎ Base case assumes: Cash Consideration -Non-Affiliated Units 282 Revolver Draw 292
Uses Sources
(1)
Transaction Fees 10
☐ Each outstanding Public Abe common unit exchanged for
Total Uses $2,156 Total Sources $2,156
0.5000 Ulysses shares and $4.03 cash per Abe unit
☐ Abe earnings will be taxable at Ulysses’ corporate tax rate(2)∎ Assumes Ulysses’ status quo dividend policy for pro forma entity
∎ Synergies are expected at pro forma Ulysses mainly due to reduced filings costs
☐ $2.5MM in FY 2019E and $5 MM on ago-forward basis
Ulysses Ownership Comparison
∎Step-up depreciation due to:
☐ Capex allocated on a5-20 year ADS schedule depending on capex category as provided by Abe management Status Quo Ulysses
Existing Ulysses Public 100%
Pro Forma Ulysses
Existing Ulysses Public 83.5%
☐ Goodwill based on inside tax basis and 704(c) and 743(b) provided by company management
☐Step-up reduces cash taxes at a marginal rate of ~28.89%
Prior Abe Public 16.5%
Status Quo Abe
Units Held by Ulysses 25.3%
Abe Public 74.7%
Source: FactSet as of 2/8/2019. 29 (1) Provided by Management.
(2) Analysis ofafter-tax effects on Abe unitholder and future distributions to come.
TUDORPICKERING HOLT&CO
ENERGY INVESTMENT & MERCHANT BANKING
PRELIMINARY CONFIDENTIAL DRAFT Subject to Further Review & Revision
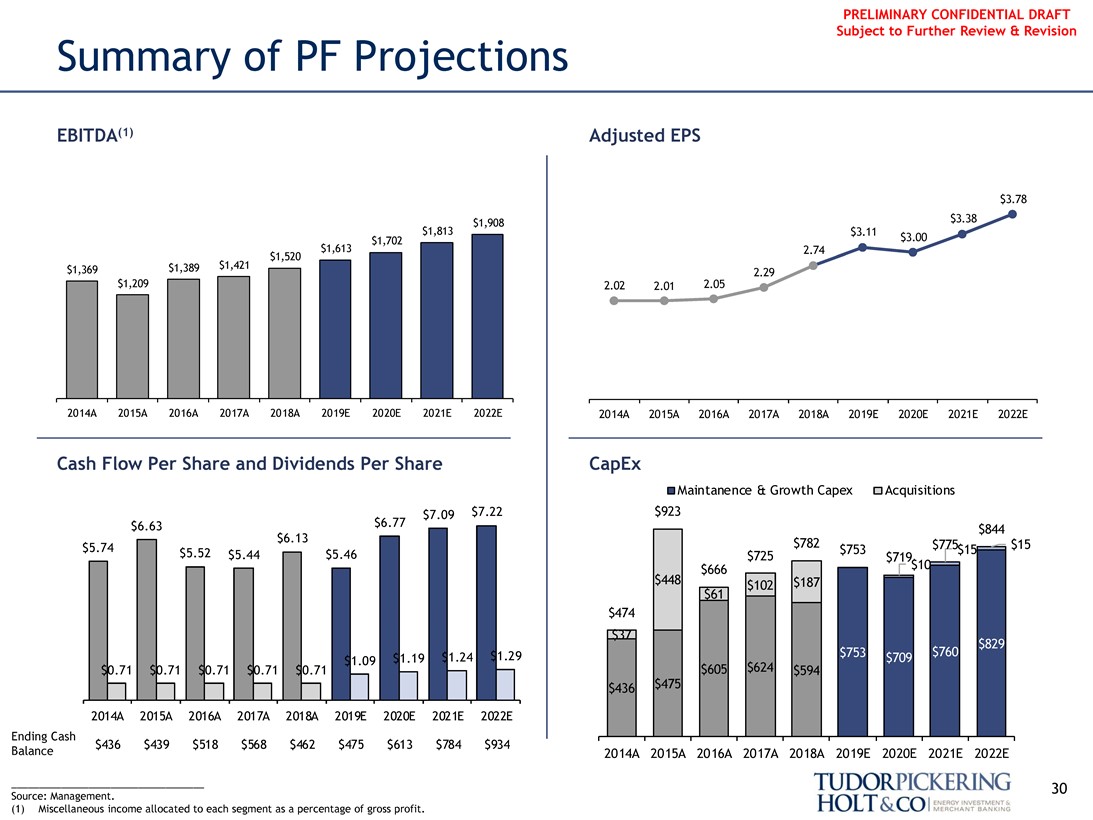
Summary of PF Projections
EBITDA(1) Adjusted EPS
$3.78 $1,908 $3.38 $1,813 $3.11 $1,613 $1,702 $3.00
2.74 $1,520 $1,369 $1,389 $1,421 $1,209 2.29
2.02 2.01 2.05
2014A 2015A 2016A 2017A 2018A 2019E 2020E 2021E 2022E 2014A 2015A 2016A 2017A 2018A 2019E 2020E 2021E 2022E
Cash Flow Per Share and Dividends Per Share CapEx
Maintanence & Growth Capex Acquisitions
$7.09 $7.22 $923
$6.63 $6.77 $844
$6.13 $782 $15
$5.74 $753 $775 $15
$5.52 $5.44 $5.46 $725 $719 $10 $666 $448 $102 $187 $61 $474 $37
$1.24 $1.29
$1.09 $1.19
$0.71 $0.71 $0.71 $0.71 $0.71 $605 $624 $594 $436 $475 $753 $709 $760 $829
2014A 2015A 2016A 2017A 2018A 2019E 2020E 2021E 2022E
Ending Cash Balance $436 $439 $518 $568 $462 $475 $613 $784 $934
2014A 2015A 2016A 2017A 2018A 2019E 2020E 2021E 2022E
30 Source: Management.
(1) Miscellaneous income allocated to each segment as a percentage of gross profit.
TUDORPICKERING HOLT&CO
ENERGY INVESTMENT & MERCHANT BANKING
PRELIMINARY CONFIDENTIAL DRAFT Subject to Further Review & Revision
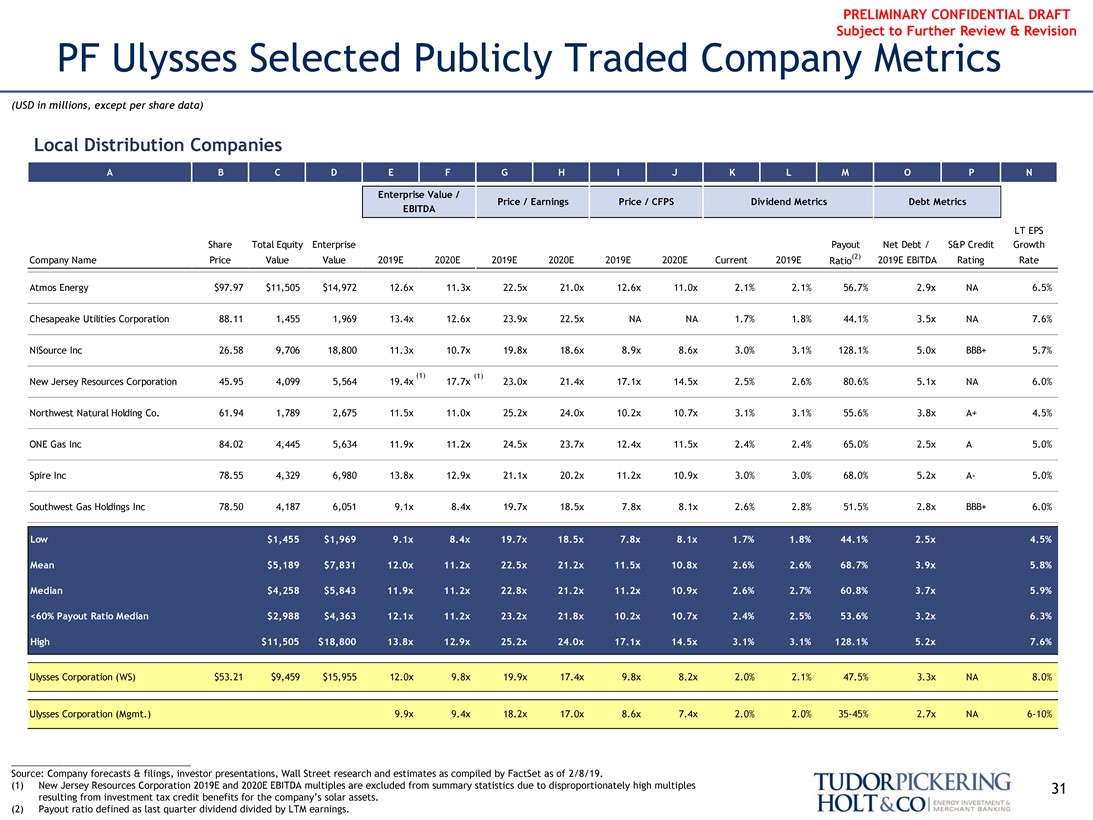
PF Ulysses Selected Publicly Traded Company Metrics
(USD in millions, except per share data)
Local Distribution Companies
A B C D E F G H I J K L M O P N
Enterprise Value /
Price / Earnings Price / CFPS Dividend Metrics Debt Metrics EBITDA
LT EPS Share Total Equity Enterprise Payout Net Debt / S&P Credit Growth Company Name Price Value Value 2019E 2020E 2019E 2020E 2019E 2020E Current 2019E Ratio(2) 2019E EBITDA Rating Rate
Atmos Energy $97.97 $11,505 $14,972 12.6x 11.3x 22.5x 21.0x 12.6x 11.0x 2.1% 2.1% 56.7% 2.9x NA 6.5%
Chesapeake Utilities Corporation 88.11 1,455 1,969 13.4x 12.6x 23.9x 22.5x NA NA 1.7% 1.8% 44.1% 3.5x NA 7.6%
NiSource Inc 26.58 9,706 18,800 11.3x 10.7x 19.8x 18.6x 8.9x 8.6x 3.0% 3.1% 128.1% 5.0x BBB+ 5.7%
(1) (1)
New Jersey Resources Corporation 45.95 4,099 5,564 19.4x 17.7x 23.0x 21.4x 17.1x 14.5x 2.5% 2.6% 80.6% 5.1x NA 6.0% Northwest Natural Holding Co. 61.94 1,789 2,675 11.5x 11.0x 25.2x 24.0x 10.2x 10.7x 3.1% 3.1% 55.6% 3.8x A+ 4.5% ONE Gas Inc 84.02 4,445 5,634 11.9x 11.2x 24.5x 23.7x 12.4x 11.5x 2.4% 2.4% 65.0% 2.5x A 5.0% Spire Inc 78.55 4,329 6,980 13.8x 12.9x 21.1x 20.2x 11.2x 10.9x 3.0% 3.0% 68.0% 5.2xA- 5.0% Southwest Gas Holdings Inc 78.50 4,187 6,051 9.1x 8.4x 19.7x 18.5x 7.8x 8.1x 2.6% 2.8% 51.5% 2.8x BBB+ 6.0%
Low $1,455 $1,969 9.1x 8.4x 19.7x 18.5x 7.8x 8.1x 1.7% 1.8% 44.1% 2.5x 4.5% Mean $5,189 $7,831 12.0x 11.2x 22.5x 21.2x 11.5x 10.8x 2.6% 2.6% 68.7% 3.9x 5.8% Median $4,258 $5,843 11.9x 11.2x 22.8x 21.2x 11.2x 10.9x 2.6% 2.7% 60.8% 3.7x 5.9% <60% Payout Ratio Median $2,988 $4,363 12.1x 11.2x 23.2x 21.8x 10.2x 10.7x 2.4% 2.5% 53.6% 3.2x 6.3% High $11,505 $18,800 13.8x 12.9x 25.2x 24.0x 17.1x 14.5x 3.1% 3.1% 128.1% 5.2x 7.6%
Ulysses Corporation (WS) $53.21 $9,459 $15,955 12.0x 9.8x 19.9x 17.4x 9.8x 8.2x 2.0% 2.1% 47.5% 3.3x NA 8.0%
Ulysses Corporation (Mgmt.) 9.9x 9.4x 18.2x 17.0x 8.6x 7.4x 2.0% 2.0%35-45% 2.7x NA6-10%
Source: Company forecasts & filings, investor presentations, Wall Street research and estimates as compiled by FactSet as of 2/8/19.
(1) New Jersey Resources Corporation 2019E and 2020E EBITDA multiples are excluded from summary statistics due to disproportionately high multiples resulting from investment tax credit benefits for the company’s solar assets.
(2) Payout ratio defined as last quarter dividend divided by LTM earnings.
31
TUDORPICKERING HOLT&CO
ENERGY INVESTMENT & MERCHANT BANKING
PRELIMINARY CONFIDENTIAL DRAFT Subject to Further Review & Revision
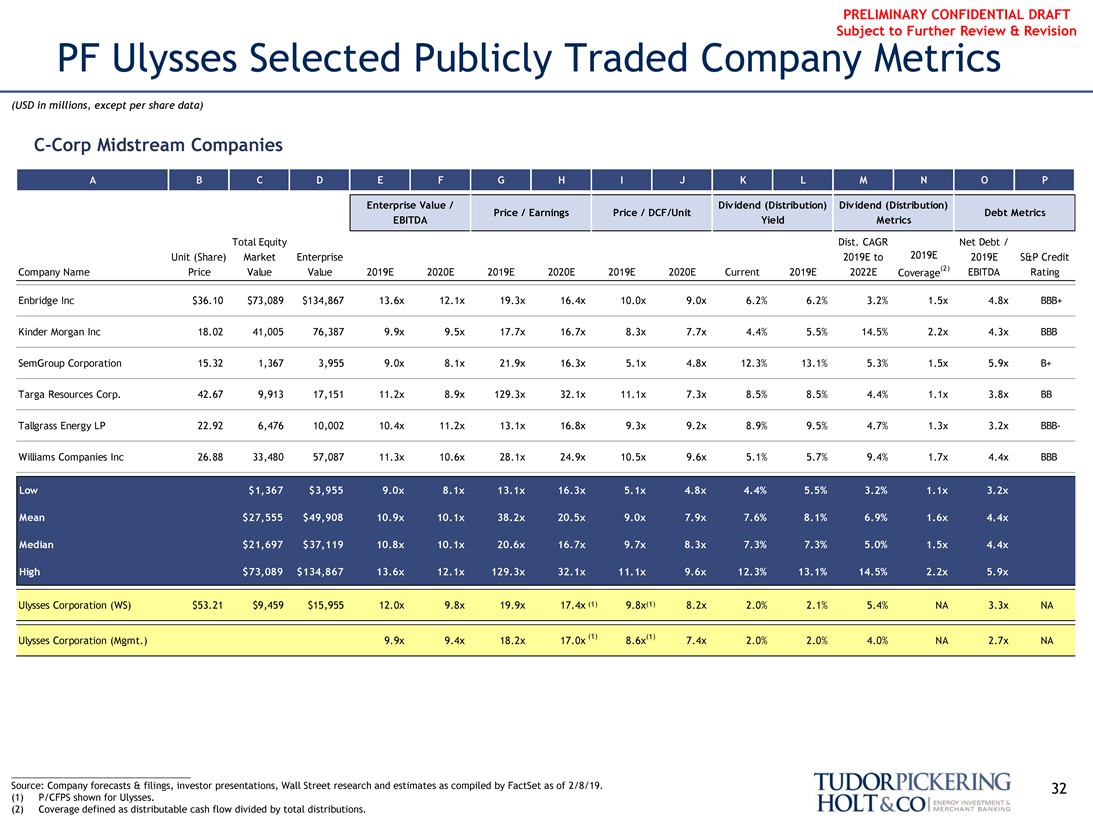
PF Ulysses Selected Publicly Traded Company Metrics
(USD in millions, except per share data)
C-Corp Midstream Companies
A B C D E F G H I J K L M N O P
Enterprise Value / Dividend (Distribution) Dividend (Distribution)
Price / Earnings Price / DCF/Unit Debt Metrics EBITDA Yield Metrics
Total Equity Dist. CAGR Net Debt /
Unit (Share) Market Enterprise 2019E to 2019E 2019E S&P Credit Company Name Price Value Value 2019E 2020E 2019E 2020E 2019E 2020E Current 2019E 2022E Coverage(2) EBITDA Rating
Enbridge Inc $36.10 $73,089 $134,867 13.6x 12.1x 19.3x 16.4x 10.0x 9.0x 6.2% 6.2% 3.2% 1.5x 4.8x BBB+ Kinder Morgan Inc 18.02 41,005 76,387 9.9x 9.5x 17.7x 16.7x 8.3x 7.7x 4.4% 5.5% 14.5% 2.2x 4.3x BBB SemGroup Corporation 15.32 1,367 3,955 9.0x 8.1x 21.9x 16.3x 5.1x 4.8x 12.3% 13.1% 5.3% 1.5x 5.9x B+ Targa Resources Corp. 42.67 9,913 17,151 11.2x 8.9x 129.3x 32.1x 11.1x 7.3x 8.5% 8.5% 4.4% 1.1x 3.8x BB Tallgrass Energy LP 22.92 6,476 10,002 10.4x 11.2x 13.1x 16.8x 9.3x 9.2x 8.9% 9.5% 4.7% 1.3x 3.2xBBB-Williams Companies Inc 26.88 33,480 57,087 11.3x 10.6x 28.1x 24.9x 10.5x 9.6x 5.1% 5.7% 9.4% 1.7x 4.4x BBB
Low $1,367 $3,955 9.0x 8.1x 13.1x 16.3x 5.1x 4.8x 4.4% 5.5% 3.2% 1.1x 3.2x Mean $27,555 $49,908 10.9x 10.1x 38.2x 20.5x 9.0x 7.9x 7.6% 8.1% 6.9% 1.6x 4.4x Median $21,697 $37,119 10.8x 10.1x 20.6x 16.7x 9.7x 8.3x 7.3% 7.3% 5.0% 1.5x 4.4x High $73,089 $134,867 13.6x 12.1x 129.3x 32.1x 11.1x 9.6x 12.3% 13.1% 14.5% 2.2x 5.9x
Ulysses Corporation (WS) $53.21 $9,459 $15,955 12.0x 9.8x 19.9x 17.4x (1) 9.8x(1) 8.2x 2.0% 2.1% 5.4% NA 3.3x NA
Ulysses Corporation (Mgmt.) 9.9x 9.4x 18.2x 17.0x (1) 8.6x(1) 7.4x 2.0% 2.0% 4.0% NA 2.7x NA
Source: Company forecasts & filings, investor presentations, Wall Street research and estimates as compiled by FactSet as of 2/8/19. (1) P/CFPS shown for Ulysses.
(2) Coverage defined as distributable cash flow divided by total distributions.
32
TUDORPICKERING HOLT&CO
ENERGY INVESTMENT & MERCHANT BANKING
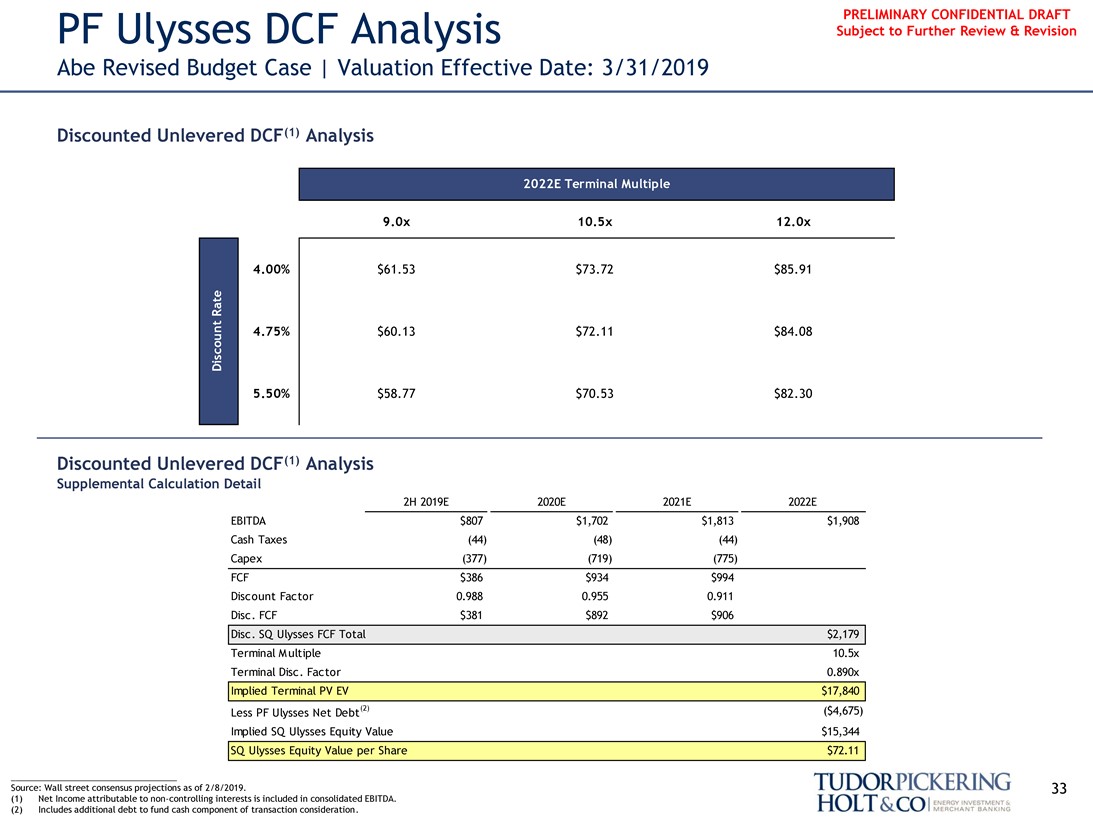
PRELIMINARY CONFIDENTIAL DRAFT PF Ulysses DCF Analysis Subject to Further Review & Revision
Abe Revised Budget Case | Valuation Effective Date: 3/31/2019
Discounted Unlevered DCF(1) Analysis
2022E Terminal Multiple
Discount Rate
9.0x 10.5x 12.0x
4.00% $61.53 $73.72 $85.91
4.75% $60.13 $72.11 $84.08
5.50% $58.77 $70.53 $82.30
Discounted Unlevered DCF(1) Analysis
Supplemental Calculation Detail
2H 2019E 2020E 2021E 2022E
EBITDA $807 $1,702 $1,813 $1,908 Cash Taxes (44) (48) (44) Capex (377) (719) (775) FCF $386 $934 $994 Discount Factor 0.988 0.955 0.911 Disc. FCF $381 $892 $906 Disc. SQ Ulysses FCF Total $2,179 Terminal Multiple 10.5x Terminal Disc. Factor 0.890x Implied Terminal PV EV $17,840 Less PF Ulysses Net Debt(2) ($4,675) Implied SQ Ulysses Equity Value $15,344 SQ Ulysses Equity Value per Share $72.11
Source: Wall street consensus projections as of 2/8/2019. 33 (1) Net Income attributable tonon-controlling interests is included in consolidated EBITDA.
(2) Includes additional debt to fund cash component of transaction consideration.
TUDORPICKERING HOLT&CO
ENERGY INVESTMENT & MERCHANT BANKING
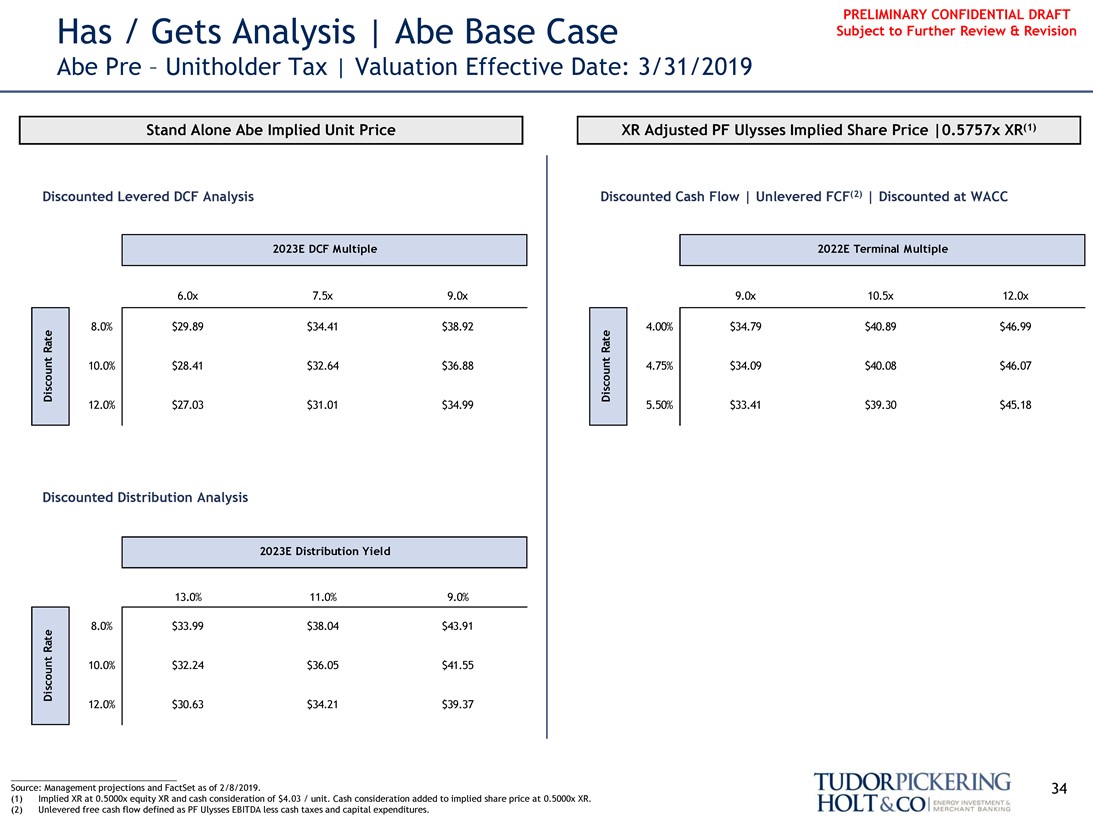
PRELIMINARY CONFIDENTIAL DRAFT Has / Gets Analysis | Abe Base Case Subject to Further Review & Revision
Abe Pre – Unitholder Tax | Valuation Effective Date: 3/31/2019
Stand Alone Abe Implied Unit Price XR Adjusted PF Ulysses Implied Share Price |0.5757x XR(1)
Discounted Levered DCF Analysis Discounted Cash Flow | Unlevered FCF(2) | Discounted at WACC
2023E DCF Multiple 2022E Terminal Multiple
6.0x 7.5x 9.0x 9.0x 10.5x 12.0x
Discount Rate
Discount Rate
8.0% $29.89 $34.41 $38.92 4.00% $34.79 $40.89 $46.99 10.0% $28.41 $32.64 $36.88 4.75% $34.09 $40.08 $46.07
12.0% $27.03 $31.01 $34.99 5.50% $33.41 $39.30 $45.18
Discounted Distribution Analysis
2023E Distribution Yield
13.0% 11.0% 9.0%
Discount Rate
8.0% $33.99 $38.04 $43.91 10.0% $32.24 $36.05 $41.55
12.0% $30.63 $34.21 $39.37
Source: Management projections and FactSet as of 2/8/2019. 34 (1) Implied XR at 0.5000x equity XR and cash consideration of $4.03 / unit. Cash consideration added to implied share price at 0.5000x XR.
(2) Unlevered free cash flow defined as PF Ulysses EBITDA less cash taxes and capital expenditures.
TUDORPICKERING HOLT&CO
ENERGY INVESTMENT & MERCHANT BANKING
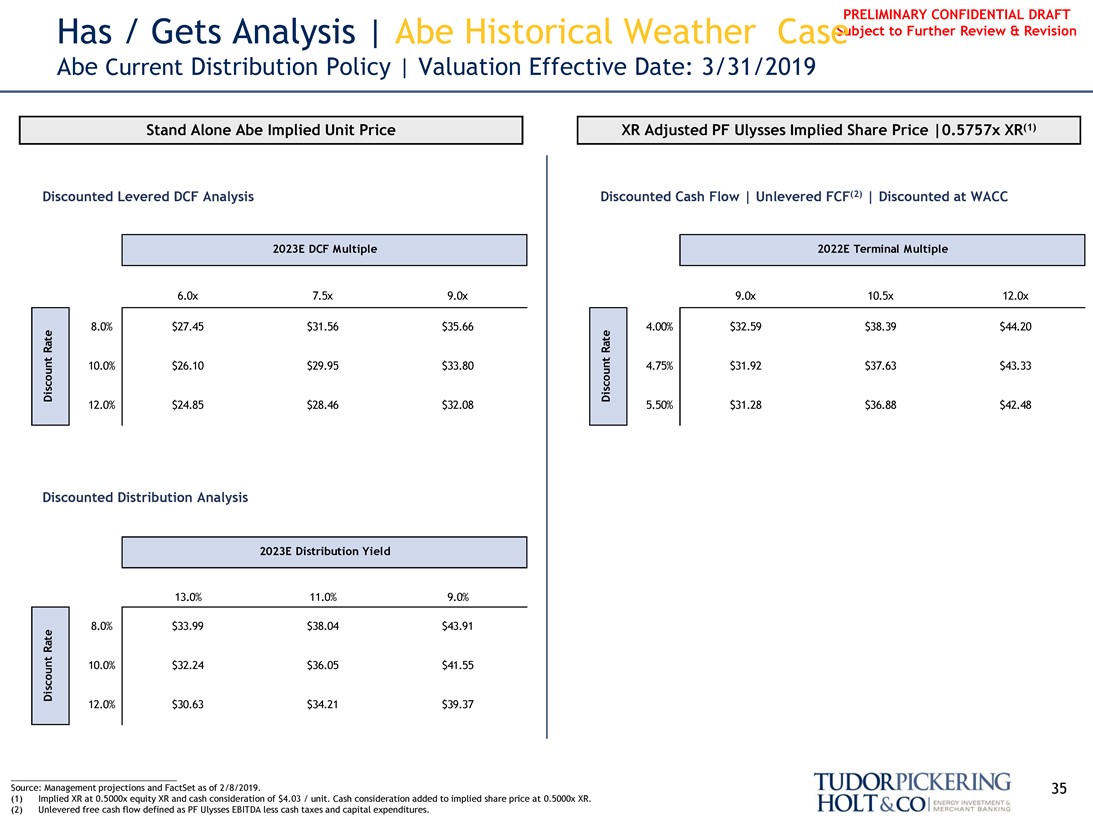
PRELIMINARY CONFIDENTIAL DRAFT
Has / Gets Analysis | Abe Historical Weather Case Subject to Further Review & Revision
Abe Current Distribution Policy | Valuation Effective Date: 3/31/2019
Stand Alone Abe Implied Unit Price XR Adjusted PF Ulysses Implied Share Price | 0.5757x XR(1)
Discounted Levered DCF Analysis Discounted Cash Flow | Unlevered FCF(2) | Discounted at WACC
2023E DCF Multiple 2022E Terminal Multiple
6.0x 7.5x 9.0x 9.0x 10.5x 12.0x
Discount Rate 8.0% $27.45 $31.56 $35.66 Discount Rate 4.00% $32.59 $38.39 $44.20 10.0% $26.10 $29.95 $33.80 4.75% $31.92 $37.63 $43.33
12.0% $24.85 $28.46 $32.08 5.50% $31.28 $36.88 $42.48
Discounted Distribution Analysis
2023E Distribution Yield
13.0% 11.0% 9.0%
Discount Rate 8.0% $33.99 $38.04 $43.91 10.0% $32.24 $36.05 $41.55
12.0% $30.63 $34.21 $39.37
Source: Management projections and FactSet as of 2/8/2019. 35 (1) Implied XR at 0.5000x equity XR and cash consideration of $4.03 / unit. Cash consideration added to implied share price at 0.5000x XR.
(2) Unlevered free cash flow defined as PF Ulysses EBITDA less cash taxes and capital expenditures.
TUDORPICKERING HOLT&CO
ENERGY INVESTMENT & MERCHANT BANKING
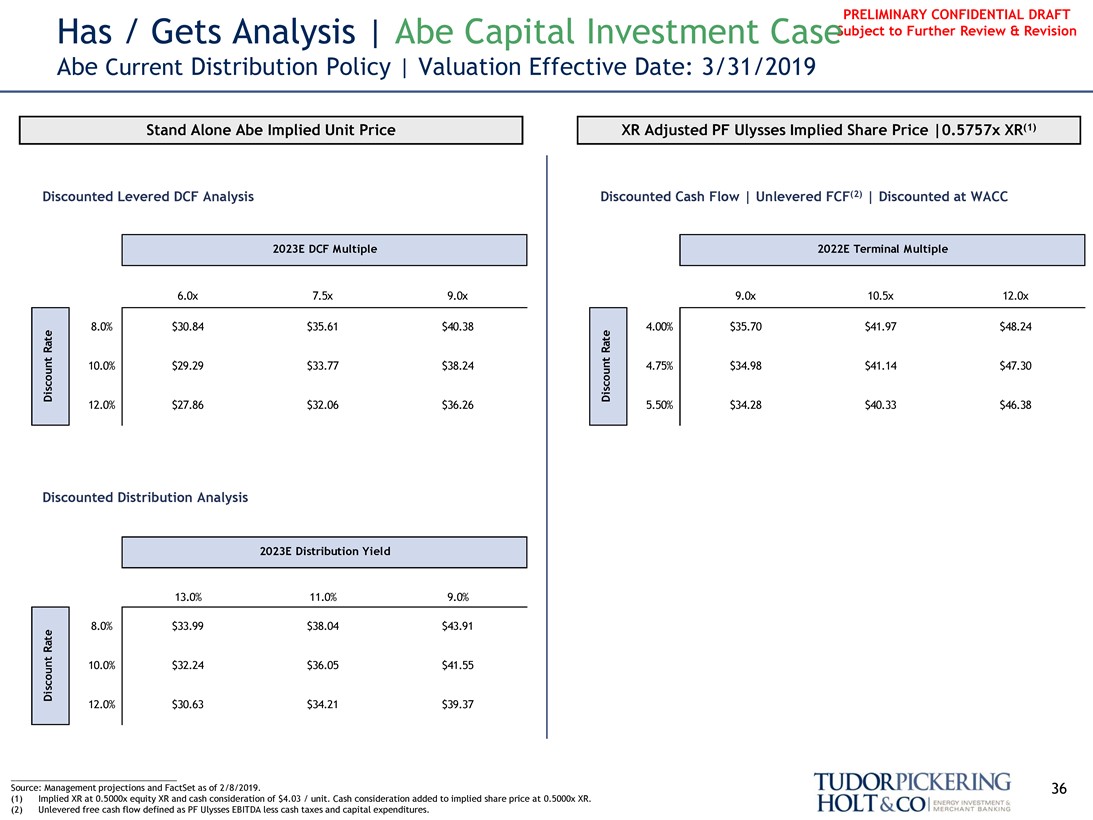
PRELIMINARY CONFIDENTIAL DRAFT
Has / Gets Analysis | Abe Capital Investment CaseSubject to Further Review & Revision
Abe Current Distribution Policy | Valuation Effective Date: 3/31/2019
Stand Alone Abe Implied Unit Price XR Adjusted PF Ulysses Implied Share Price | 0.5757x XR(1)
Discounted Levered DCF Analysis Discounted Cash Flow | Unlevered FCF(2) | Discounted at WACC
2023E DCF Multiple 2022E Terminal Multiple
6.0x 7.5x 9.0x 9.0x 10.5x 12.0x
Discount Rate 8.0% $30.84 $35.61 $40.38 Discount Rate 4.00% $35.70 $41.97 $48.24 10.0% $29.29 $33.77 $38.24 4.75% $34.98 $41.14 $47.30
12.0% $27.86 $32.06 $36.26 5.50% $34.28 $40.33 $46.38
Discounted Distribution Analysis
2023E Distribution Yield
13.0% 11.0% 9.0%
Discount Rate 8.0% $33.99 $38.04 $43.91 10.0% $32.24 $36.05 $41.55
12.0% $30.63 $34.21 $39.37
Source: Management projections and FactSet as of 2/8/2019. 36 (1) Implied XR at 0.5000x equity XR and cash consideration of $4.03 / unit. Cash consideration added to implied share price at 0.5000x XR.
(2) Unlevered free cash flow defined as PF Ulysses EBITDA less cash taxes and capital expenditures.
TUDORPICKERING HOLT&CO
ENERGY INVESTMENT & MERCHANT BANKING
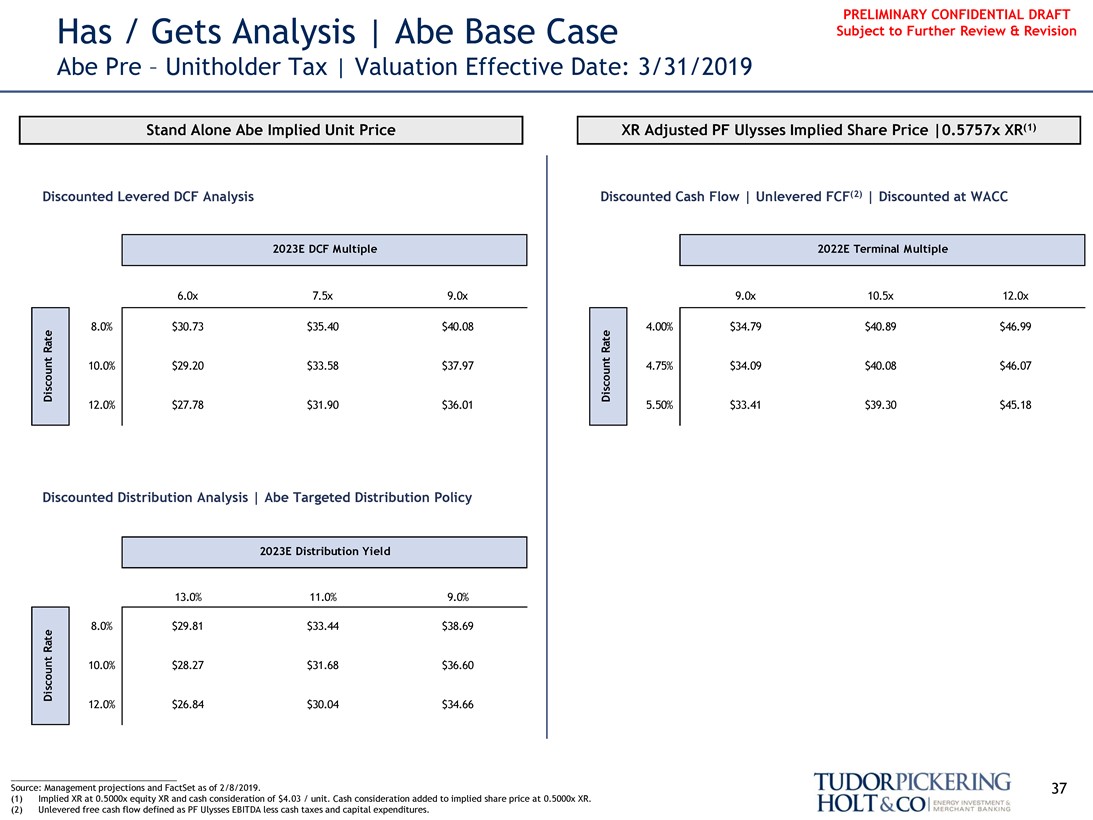
PRELIMINARY CONFIDENTIAL DRAFT Has / Gets Analysis | Abe Base Case Subject to Further Review & Revision
Abe Pre – Unitholder Tax | Valuation Effective Date: 3/31/2019
Stand Alone Abe Implied Unit Price XR Adjusted PF Ulysses Implied Share Price | 0.5757x XR(1)
Discounted Levered DCF Analysis Discounted Cash Flow | Unlevered FCF(2) | Discounted at WACC
2023E DCF Multiple 2022E Terminal Multiple
6.0x 7.5x 9.0x 9.0x 10.5x 12.0x
Discount Rate 8.0% $30.73 $35.40 $40.08 Discount Rate 4.00% $34.79 $40.89 $46.99 10.0% $29.20 $33.58 $37.97 4.75% $34.09 $40.08 $46.07
12.0% $27.78 $31.90 $36.01 5.50% $33.41 $39.30 $45.18
Discounted Distribution Analysis | Abe Targeted Distribution Policy
2023E Distribution Yield
13.0% 11.0% 9.0%
Discount Rate 8.0% $29.81 $33.44 $38.69 10.0% $28.27 $31.68 $36.60
12.0% $26.84 $30.04 $34.66
Source: Management projections and FactSet as of 2/8/2019. 37 (1) Implied XR at 0.5000x equity XR and cash consideration of $4.03 / unit. Cash consideration added to implied share price at 0.5000x XR.
(2) Unlevered free cash flow defined as PF Ulysses EBITDA less cash taxes and capital expenditures.
TUDORPICKERING HOLT&CO
ENERGY INVESTMENT & MERCHANT BANKING
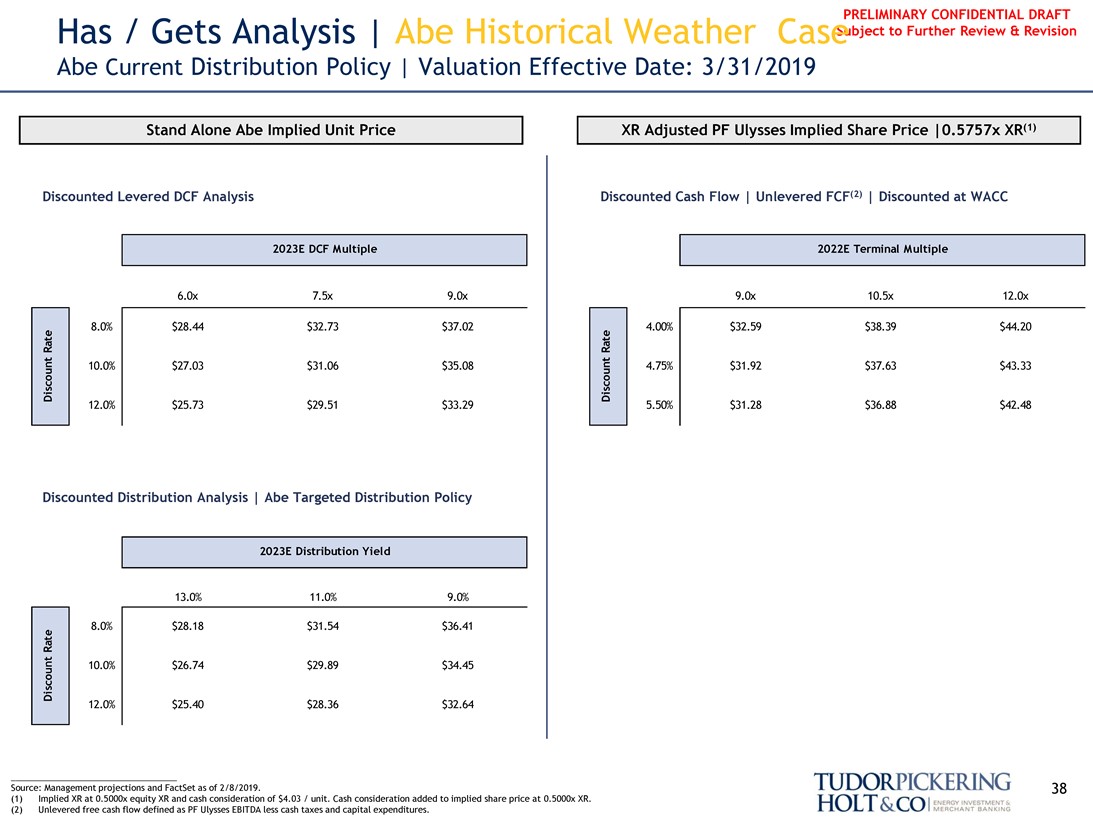
PRELIMINARY CONFIDENTIAL DRAFT
Has / Gets Analysis | Abe Historical Weather Case Subject to Further Review & Revision
Abe Current Distribution Policy | Valuation Effective Date: 3/31/2019
Stand Alone Abe Implied Unit Price XR Adjusted PF Ulysses Implied Share Price |0.5757x XR(1)
Discounted Levered DCF Analysis Discounted Cash Flow | Unlevered FCF(2) | Discounted at WACC
2023E DCF Multiple 2022E Terminal Multiple
6.0x 7.5x 9.0x 9.0x 10.5x 12.0x
Discount Rate 8.0% $28.44 $32.73 $37.02 Discount Rate 4.00% $32.59 $38.39 $44.20 10.0% $27.03 $31.06 $35.08 4.75% $31.92 $37.63 $43.33
12.0% $25.73 $29.51 $33.29 5.50% $31.28 $36.88 $42.48
Discounted Distribution Analysis | Abe Targeted Distribution Policy
2023E Distribution Yield
13.0% 11.0% 9.0%
Discount Rate 8.0% $28.18 $31.54 $36.41 10.0% $26.74 $29.89 $34.45
12.0% $25.40 $28.36 $32.64
Source: Management projections and FactSet as of 2/8/2019. 38 (1) Implied XR at 0.5000x equity XR and cash consideration of $4.03 / unit. Cash consideration added to implied share price at 0.5000x XR.
(2) Unlevered free cash flow defined as PF Ulysses EBITDA less cash taxes and capital expenditures.
TUDORPICKERING HOLT&CO
ENERGY INVESTMENT & MERCHANT BANKING
PRELIMINARY CONFIDENTIAL DRAFT
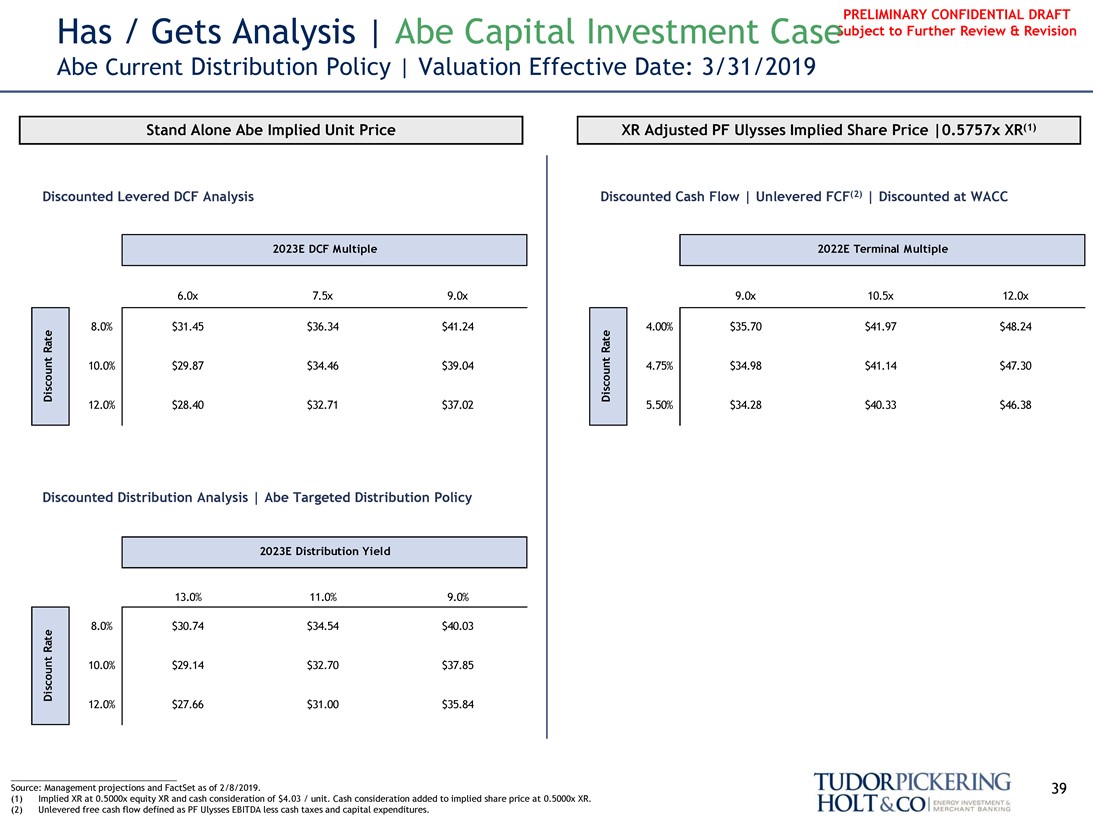
Has / Gets Analysis | Abe Capital Investment Case Subject to Further Review & Revision
Abe Current Distribution Policy | Valuation Effective Date: 3/31/2019
Stand Alone Abe Implied Unit Price XR Adjusted PF Ulysses Implied Share Price |0.5757x XR(1)
Discounted Levered DCF Analysis Discounted Cash Flow | Unlevered FCF(2) | Discounted at WACC
2023E DCF Multiple 2022E Terminal Multiple
6.0x 7.5x 9.0x 9.0x 10.5x 12.0x
Discount Rate 8.0% $31.45 $36.34 $41.24 Discount Rate 4.00% $35.70 $41.97 $48.24 10.0% $29.87 $34.46 $39.04 4.75% $34.98 $41.14 $47.30
12.0% $28.40 $32.71 $37.02 5.50% $34.28 $40.33 $46.38
Discounted Distribution Analysis | Abe Targeted Distribution Policy
2023E Distribution Yield
13.0% 11.0% 9.0%
Discount Rate 8.0% $30.74 $34.54 $40.03 10.0% $29.14 $32.70 $37.85
12.0% $27.66 $31.00 $35.84
Source: Management projections and FactSet as of 2/8/2019. 39 (1) Implied XR at 0.5000x equity XR and cash consideration of $4.03 / unit. Cash consideration added to implied share price at 0.5000x XR.
(2) Unlevered free cash flow defined as PF Ulysses EBITDA less cash taxes and capital expenditures.
TUDORPICKERING HOLT&CO
ENERGY INVESTMENT & MERCHANT BANKING
PRELIMINARY CONFIDENTIAL DRAFT Subject to Further Review & Revision
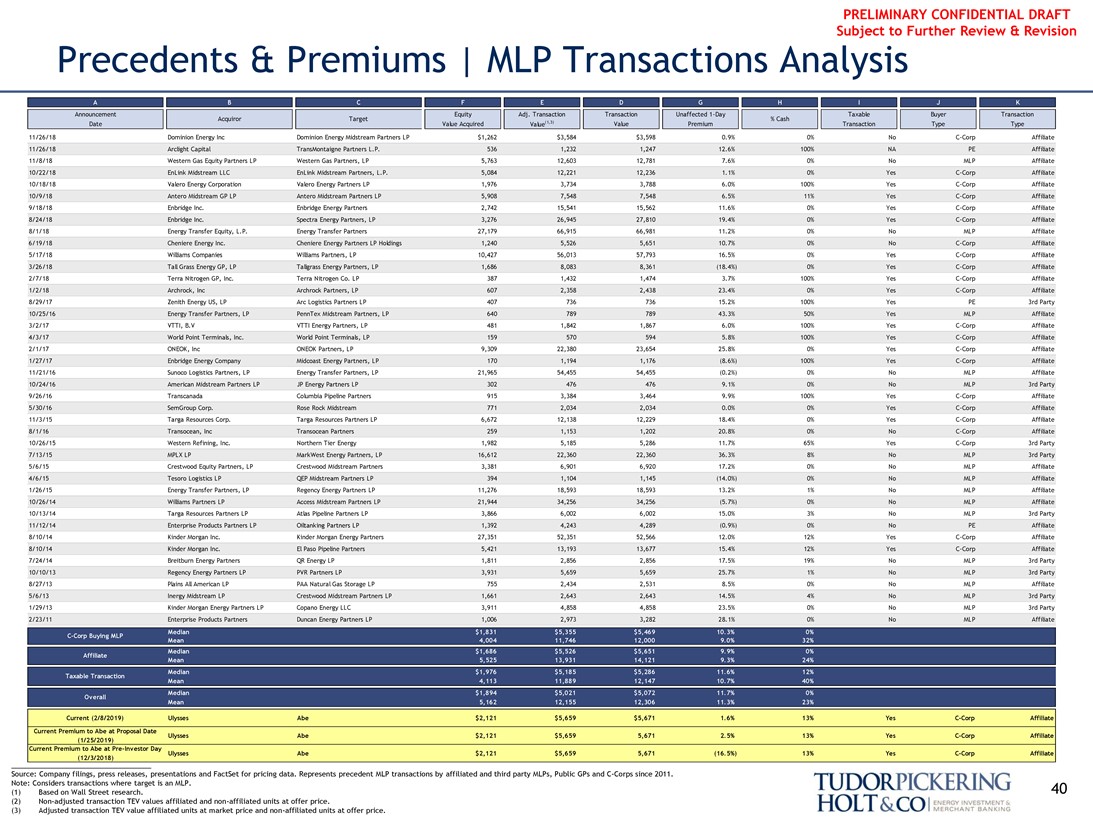
Precedents & Premiums | MLP Transactions Analysis
A B C F E D G H I J K
Announcement Equity Adj. Transaction Transaction Unaffected1-Day Taxable Buyer Transaction Acquiror Target % Cash Date Value Acquired Value(1,3) Value Premium Transaction Type Type
11/26/18 Dominion Energy Inc Dominion Energy Midstream Partners LP $1,262 $3,584 $3,598 0.9% 0% NoC-Corp Affiliate 11/26/18 Arclight Capital TransMontaigne Partners L.P. 536 1,232 1,247 12.6% 100% NA PE Affiliate 11/8/18 Western Gas Equity Partners LP Western Gas Partners, LP 5,763 12,603 12,781 7.6% 0% No MLP Affiliate 10/22/18 EnLink Midstream LLC EnLink Midstream Partners, L.P. 5,084 12,221 12,236 1.1% 0% YesC-Corp Affiliate 10/18/18 Valero Energy Corporation Valero Energy Partners LP 1,976 3,734 3,788 6.0% 100% YesC-Corp Affiliate 10/9/18 Antero Midstream GP LP Antero Midstream Partners LP 5,908 7,548 7,548 6.5% 11% YesC-Corp Affiliate 9/18/18 Enbridge Inc. Enbridge Energy Partners 2,742 15,541 15,562 11.6% 0% YesC-Corp Affiliate 8/24/18 Enbridge Inc. Spectra Energy Partners, LP 3,276 26,945 27,810 19.4% 0% YesC-Corp Affiliate 8/1/18 Energy Transfer Equity, L.P. Energy Transfer Partners 27,179 66,915 66,981 11.2% 0% No MLP Affiliate 6/19/18 Cheniere Energy Inc. Cheniere Energy Partners LP Holdings 1,240 5,526 5,651 10.7% 0% NoC-Corp Affiliate 5/17/18 Williams Companies Williams Partners, LP 10,427 56,013 57,793 16.5% 0% YesC-Corp Affiliate 3/26/18 Tall Grass Energy GP, LP Tallgrass Energy Partners, LP 1,686 8,083 8,361 (18.4%) 0% YesC-Corp Affiliate 2/7/18 Terra Nitrogen GP, Inc. Terra Nitrogen Co. LP 387 1,432 1,474 3.7% 100% YesC-Corp Affiliate 1/2/18 Archrock, Inc Archrock Partners, LP 607 2,358 2,438 23.4% 0% YesC-Corp Affiliate 8/29/17 Zenith Energy US, LP Arc Logistics Partners LP 407 736 736 15.2% 100% Yes PE 3rd Party 10/25/16 Energy Transfer Partners, LP PennTex Midstream Partners, LP 640 789 789 43.3% 50% Yes MLP Affiliate 3/2/17 VTTI, B.V VTTI Energy Partners, LP 481 1,842 1,867 6.0% 100% YesC-Corp Affiliate 4/3/17 World Point Terminals, Inc. World Point Terminals, LP 159 570 594 5.8% 100% YesC-Corp Affiliate 2/1/17 ONEOK, Inc ONEOK Partners, LP 9,309 22,380 23,654 25.8% 0% YesC-Corp Affiliate 1/27/17 Enbridge Energy Company Midcoast Energy Partners, LP 170 1,194 1,176 (8.6%) 100% YesC-Corp Affiliate 11/21/16 Sunoco Logistics Partners, LP Energy Transfer Partners, LP 21,965 54,455 54,455 (0.2%) 0% No MLP Affiliate 10/24/16 American Midstream Partners LP JP Energy Partners LP 302 476 476 9.1% 0% No MLP 3rd Party 9/26/16 Transcanada Columbia Pipeline Partners 915 3,384 3,464 9.9% 100% YesC-Corp Affiliate 5/30/16 SemGroup Corp. Rose Rock Midstream 771 2,034 2,034 0.0% 0% YesC-Corp Affiliate 11/3/15 Targa Resources Corp. Targa Resources Partners LP 6,672 12,138 12,229 18.4% 0% YesC-Corp Affiliate 8/1/16 Transocean, Inc Transocean Partners 259 1,153 1,202 20.8% 0% NoC-Corp Affiliate 10/26/15 Western Refining, Inc. Northern Tier Energy 1,982 5,185 5,286 11.7% 65% YesC-Corp 3rd Party 7/13/15 MPLX LP MarkWest Energy Partners, LP 16,612 22,360 22,360 36.3% 8% No MLP 3rd Party 5/6/15 Crestwood Equity Partners, LP Crestwood Midstream Partners 3,381 6,901 6,920 17.2% 0% No MLP Affiliate 4/6/15 Tesoro Logistics LP QEP Midstream Partners LP 394 1,104 1,145 (14.0%) 0% No MLP Affiliate 1/26/15 Energy Transfer Partners, LP Regency Energy Partners LP 11,276 18,593 18,593 13.2% 1% No MLP Affiliate 10/26/14 Williams Partners LP Access Midstream Partners LP 21,944 34,256 34,256 (5.7%) 0% No MLP Affiliate 10/13/14 Targa Resources Partners LP Atlas Pipeline Partners LP 3,866 6,002 6,002 15.0% 3% No MLP 3rd Party 11/12/14 Enterprise Products Partners LP Oiltanking Partners LP 1,392 4,243 4,289 (0.9%) 0% No PE Affiliate 8/10/14 Kinder Morgan Inc. Kinder Morgan Energy Partners 27,351 52,351 52,566 12.0% 12% YesC-Corp Affiliate 8/10/14 Kinder Morgan Inc. El Paso Pipeline Partners 5,421 13,193 13,677 15.4% 12% YesC-Corp Affiliate 7/24/14 Breitburn Energy Partners QR Energy LP 1,811 2,856 2,856 17.5% 19% No MLP 3rd Party 10/10/13 Regency Energy Partners LP PVR Partners LP 3,931 5,659 5,659 25.7% 1% No MLP 3rd Party 8/27/13 Plains All American LP PAA Natural Gas Storage LP 755 2,434 2,531 8.5% 0% No MLP Affiliate 5/6/13 Inergy Midstream LP Crestwood Midstream Partners LP 1,661 2,643 2,643 14.5% 4% No MLP 3rd Party 1/29/13 Kinder Morgan Energy Partners LP Copano Energy LLC 3,911 4,858 4,858 23.5% 0% No MLP 3rd Party 2/23/11 Enterprise Products Partners Duncan Energy Partners LP 1,006 2,973 3,282 28.1% 0% No MLP Affiliate
C-Corp Buying MLP
Affiliate
Taxable Transaction
Overall
Median $1,831 $5,355 $5,469 10.3% 0% C-Corp Buying MLP
Mean 4,004 11,746 12,000 9.0% 32% Median $1,686 $5,526 $5,651 9.9% 0% Affiliate Mean 5,525 13,931 14,121 9.3% 24% Median $1,976 $5,185 $5,286 11.6% 12% Taxable Transaction Mean 4,113 11,889 12,147 10.7% 40% Median $1,894 $5,021 $5,072 11.7% 0% Overall Mean 5,162 12,155 12,306 11.3% 23%
Current (2/8/2019) Ulysses Abe $2,121 $5,659 $5,671 1.6% 13% YesC-Corp Affiliate Current Premium to Abe at Proposal Date Ulysses Abe $2,121 $5,659 5,671 2.5% 13% YesC-Corp Affiliate (1/25/2019) Current Premium to Abe atPre-Investor Day Ulysses Abe $2,121 $5,659 5,671 (16.5%) 13% YesC-Corp Affiliate
___________________________________ (12/3/2018)
Source: Company filings, press releases, presentations and FactSet for pricing data. Represents precedent MLP transactions by affiliated and third party MLPs, Public GPs andC-Corps since 2011.
Note: Considers transactions where target is an MLP. 40 (1) Based on Wall Street research.
(2)Non-adjusted transaction TEV values affiliated andnon-affiliated units at offer price.
(3) Adjusted transaction TEV value affiliated units at market price andnon-affiliated units at offer price.
TUDORPICKERING HOLT&CO
ENERGY INVESTMENT & MERCHANT BANKING
PRELIMINARY CONFIDENTIAL DRAFT Subject to Further Review & Revision
Supplemental Analysis
41
TUDORPICKERING HOLT&CO
ENERGY INVESTMENT & MERCHANT BANKING
PRELIMINARY CONFIDENTIAL DRAFT Abe DCF Analysis Subject to Further Review & Revision
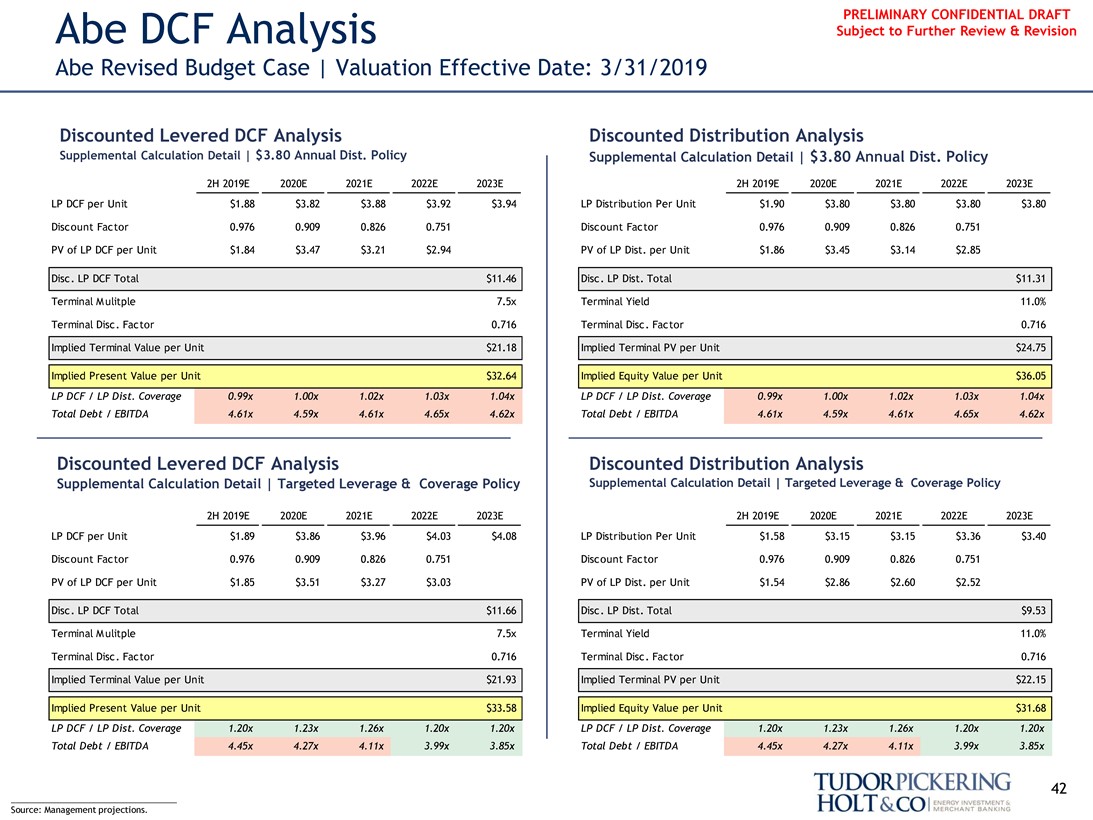
Abe Revised Budget Case | Valuation Effective Date: 3/31/2019
Discounted Levered DCF Analysis Discounted Distribution Analysis
Supplemental Calculation Detail | $3.80 Annual Dist. Policy Supplemental Calculation Detail | $3.80 Annual Dist. Policy
2H 2019E 2020E 2021E 2022E 2023E 2H 2019E 2020E 2021E 2022E 2023E
LP DCF per Unit $1.88 $3.82 $3.88 $3.92 $3.94 LP Distribution Per Unit $1.90 $3.80 $3.80 $3.80 $3.80 Discount Factor 0.976 0.909 0.826 0.751 Discount Factor 0.976 0.909 0.826 0.751 PV of LP DCF per Unit $1.84 $3.47 $3.21 $2.94 PV of LP Dist. per Unit $1.86 $3.45 $3.14 $2.85 Disc. LP DCF Total $11.46 Disc. LP Dist. Total $11.31 Terminal Mulitple 7.5x Terminal Yield 11.0% Terminal Disc. Factor 0.716 Terminal Disc. Factor 0.716 Implied Terminal Value per Unit $21.18 Implied Terminal PV per Unit $24.75
Implied Present Value per Unit $32.64 Implied Equity Value per Unit $36.05
LP DCF / LP Dist. Coverage 0.99x 1.00x 1.02x 1.03x 1.04x LP DCF / LP Dist. Coverage 0.99x 1.00x 1.02x 1.03x 1.04x Total Debt / EBITDA 4.61x 4.59x 4.61x 4.65x 4.62x Total Debt / EBITDA 4.61x 4.59x 4.61x 4.65x 4.62x
Discounted Levered DCF Analysis Discounted Distribution Analysis
Supplemental Calculation Detail | Targeted Leverage & Coverage Policy Supplemental Calculation Detail | Targeted Leverage & Coverage Policy
2H 2019E 2020E 2021E 2022E 2023E 2H 2019E 2020E 2021E 2022E 2023E
LP DCF per Unit $1.89 $3.86 $3.96 $4.03 $4.08 LP Distribution Per Unit $1.58 $3.15 $3.15 $3.36 $3.40 Discount Factor 0.976 0.909 0.826 0.751 Discount Factor 0.976 0.909 0.826 0.751 PV of LP DCF per Unit $1.85 $3.51 $3.27 $3.03 PV of LP Dist. per Unit $1.54 $2.86 $2.60 $2.52 Disc. LP DCF Total $11.66 Disc. LP Dist. Total $9.53 Terminal Mulitple 7.5x Terminal Yield 11.0% Terminal Disc. Factor 0.716 Terminal Disc. Factor 0.716 Implied Terminal Value per Unit $21.93 Implied Terminal PV per Unit $22.15
Implied Present Value per Unit $33.58 Implied Equity Value per Unit $31.68
LP DCF / LP Dist. Coverage 1.20x 1.23x 1.26x 1.20x 1.20x LP DCF / LP Dist. Coverage 1.20x 1.23x 1.26x 1.20x 1.20x Total Debt / EBITDA 4.45x 4.27x 4.11x 3.99x 3.85x Total Debt / EBITDA 4.45x 4.27x 4.11x 3.99x 3.85x
___________________________________ 42 Source: Management projections.
TUDORPICKERING HOLT&CO
ENERGY INVESTMENT & MERCHANT BANKING
PRELIMINARY CONFIDENTIAL DRAFT Abe DCF Analysis Subject to Further Review & Revision
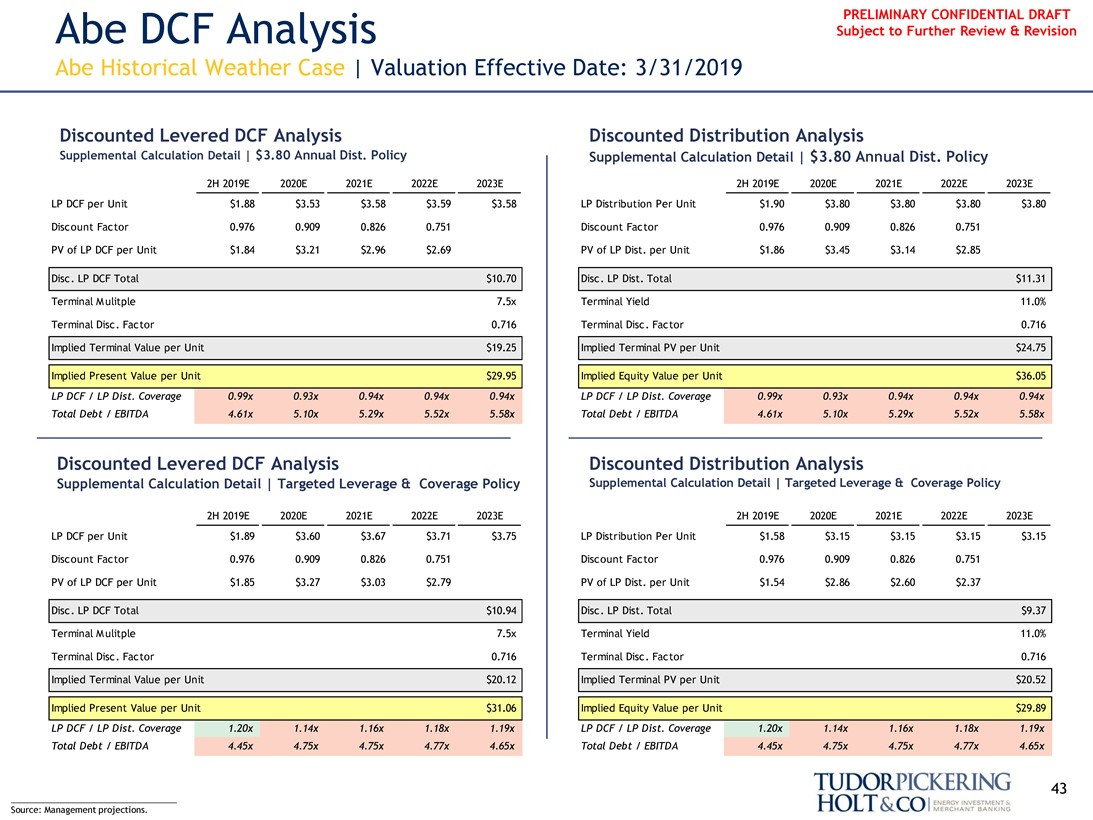
Abe Historical Weather Case | Valuation Effective Date: 3/31/2019
Discounted Levered DCF Analysis Discounted Distribution Analysis
Supplemental Calculation Detail | $3.80 Annual Dist. Policy Supplemental Calculation Detail | $3.80 Annual Dist. Policy
2H 2019E 2020E 2021E 2022E 2023E 2H 2019E 2020E 2021E 2022E 2023E
LP DCF per Unit $1.88 $3.53 $3.58 $3.59 $3.58 LP Distribution Per Unit $1.90 $3.80 $3.80 $3.80 $3.80 Discount Factor 0.976 0.909 0.826 0.751 Discount Factor 0.976 0.909 0.826 0.751 PV of LP DCF per Unit $1.84 $3.21 $2.96 $2.69 PV of LP Dist. per Unit $1.86 $3.45 $3.14 $2.85 Disc. LP DCF Total $10.70 Disc. LP Dist. Total
$11.31 Terminal Mulitple 7.5x Terminal Yield 11.0% Terminal Disc. Factor 0.716 Terminal Disc. Factor 0.716 Implied Terminal Value per Unit $19.25 Implied Terminal PV per Unit $24.75
Implied Present Value per Unit $29.95 Implied Equity Value per Unit $36.05
LP DCF / LP Dist. Coverage 0.99x 0.93x 0.94x 0.94x 0.94x LP DCF / LP Dist. Coverage 0.99x 0.93x 0.94x 0.94x 0.94x Total Debt / EBITDA 4.61x 5.10x 5.29x 5.52x 5.58x Total Debt / EBITDA 4.61x 5.10x 5.29x 5.52x 5.58x
Discounted Levered DCF Analysis Discounted Distribution Analysis
Supplemental Calculation Detail | Targeted Leverage & Coverage Policy Supplemental Calculation Detail | Targeted Leverage & Coverage Policy
2H 2019E 2020E 2021E 2022E 2023E 2H 2019E 2020E 2021E 2022E 2023E
LP DCF per Unit $1.89 $3.60 $3.67 $3.71 $3.75 LP Distribution Per Unit $1.58 $3.15 $3.15 $3.15 $3.15 Discount Factor 0.976 0.909 0.826 0.751 Discount Factor 0.976 0.909 0.826 0.751 PV of LP DCF per Unit $1.85 $3.27 $3.03 $2.79 PV of LP Dist. per Unit $1.54 $2.86 $2.60 $2.37 Disc. LP DCF Total $10.94 Disc. LP Dist. Total $9.37 Terminal Mulitple 7.5x Terminal Yield 11.0% Terminal Disc. Factor 0.716 Terminal Disc. Factor 0.716 Implied Terminal Value per Unit $20.12 Implied Terminal PV per Unit $20.52
Implied Present Value per Unit $31.06 Implied Equity Value per Unit $29.89
LP DCF / LP Dist. Coverage 1.20x 1.14x 1.16x 1.18x 1.19x LP DCF / LP Dist. Coverage 1.20x 1.14x 1.16x 1.18x 1.19x Total Debt / EBITDA 4.45x 4.75x 4.75x 4.77x 4.65x Total Debt / EBITDA 4.45x 4.75x 4.75x 4.77x 4.65x
___________________________________ 43 Source: Management projections.
TUDORPICKERING HOLT&CO
ENERGY INVESTMENT & MERCHANT BANKING
PRELIMINARY CONFIDENTIAL DRAFT Abe DCF Analysis Subject to Further Review & Revision
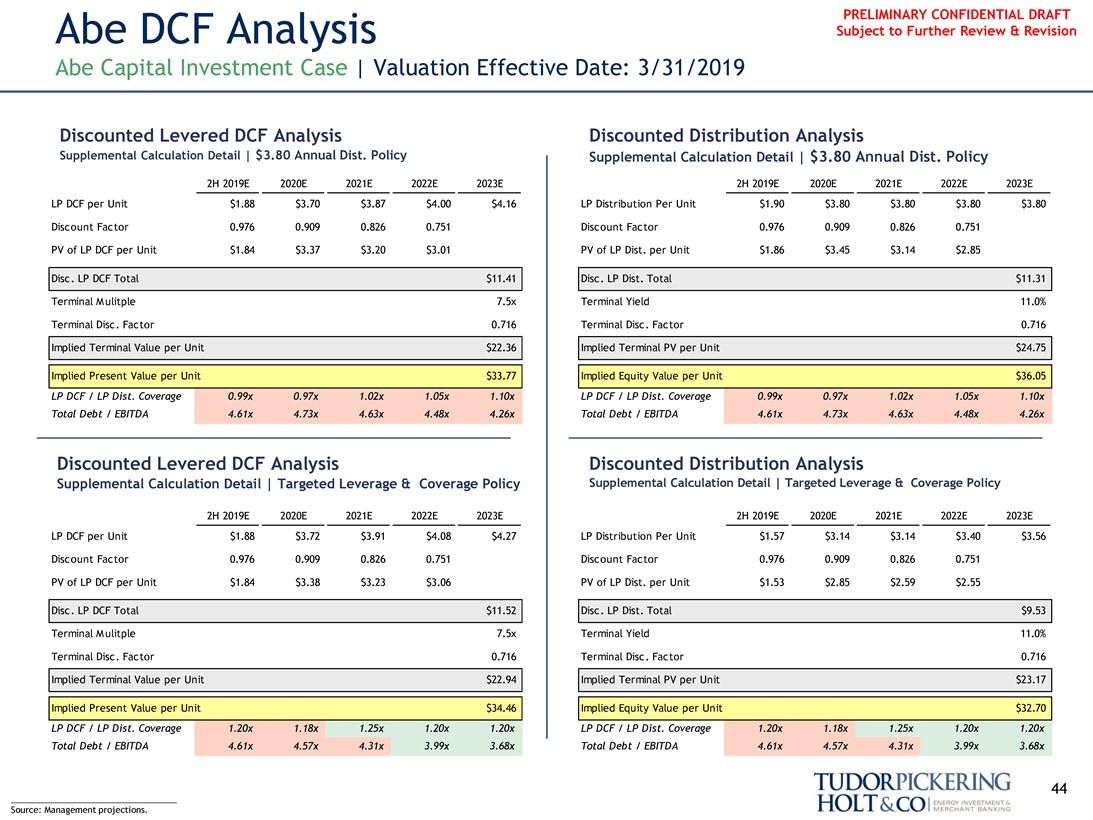
Abe Capital Investment Case | Valuation Effective Date: 3/31/2019
Discounted Levered DCF Analysis Discounted Distribution Analysis
Supplemental Calculation Detail | $3.80 Annual Dist. Policy Supplemental Calculation Detail | $3.80 Annual Dist. Policy
2H 2019E 2020E 2021E 2022E 2023E 2H 2019E 2020E 2021E 2022E 2023E
LP DCF per Unit $1.88 $3.70 $3.87 $4.00 $4.16 LP Distribution Per Unit $1.90 $3.80 $3.80 $3.80 $3.80 Discount Factor 0.976 0.909 0.826 0.751 Discount Factor 0.976 0.909 0.826 0.751 PV of LP DCF per Unit $1.84 $3.37 $3.20 $3.01 PV of LP Dist. per Unit $1.86 $3.45 $3.14 $2.85 Disc. LP DCF Total $11.41 Disc. LP Dist. Total $11.31 Terminal Mulitple 7.5x Terminal Yield 11.0% Terminal Disc. Factor 0.716 Terminal Disc. Factor 0.716 Implied Terminal Value per Unit $22.36 Implied Terminal PV per Unit $24.75
Implied Present Value per Unit $33.77 Implied Equity Value per Unit $36.05
LP DCF / LP Dist. Coverage 0.99x 0.97x 1.02x 1.05x 1.10x LP DCF / LP Dist. Coverage 0.99x 0.97x 1.02x 1.05x 1.10x Total Debt / EBITDA 4.61x 4.73x 4.63x 4.48x 4.26x Total Debt / EBITDA 4.61x 4.73x 4.63x 4.48x 4.26x
Discounted Levered DCF Analysis Discounted Distribution Analysis
Supplemental Calculation Detail | Targeted Leverage & Coverage Policy Supplemental Calculation Detail | Targeted Leverage & Coverage Policy
2H 2019E 2020E 2021E 2022E 2023E 2H 2019E 2020E 2021E 2022E 2023E
LP DCF per Unit $1.88 $3.72 $3.91 $4.08 $4.27 LP Distribution Per Unit $1.57 $3.14 $3.14 $3.40 $3.56 Discount Factor 0.976 0.909 0.826 0.751 Discount Factor 0.976 0.909 0.826 0.751 PV of LP DCF per Unit $1.84 $3.38 $3.23 $3.06 PV of LP Dist. per Unit $1.53 $2.85 $2.59 $2.55 Disc. LP DCF Total $11.52 Disc. LP Dist. Total $9.53 Terminal Mulitple 7.5x Terminal Yield 11.0% Terminal Disc. Factor 0.716 Terminal Disc. Factor 0.716 Implied Terminal Value per Unit $22.94 Implied Terminal PV per Unit $23.17
Implied Present Value per Unit $34.46 Implied Equity Value per Unit $32.70
LP DCF / LP Dist. Coverage 1.20x 1.18x 1.25x 1.20x 1.20x LP DCF / LP Dist. Coverage 1.20x 1.18x 1.25x 1.20x 1.20x Total Debt / EBITDA 4.61x 4.57x 4.31x 3.99x 3.68x Total Debt / EBITDA 4.61x 4.57x 4.31x 3.99x 3.68x
___________________________________ 44 Source: Management projections.
TUDORPICKERING HOLT&CO
ENERGY INVESTMENT & MERCHANT BANKING
PRELIMINARY CONFIDENTIAL DRAFT
Ulysses Dist. Analysis | Management Projections Subject to Further Review & Revision
Valuation Effective Date: 3/31/2019
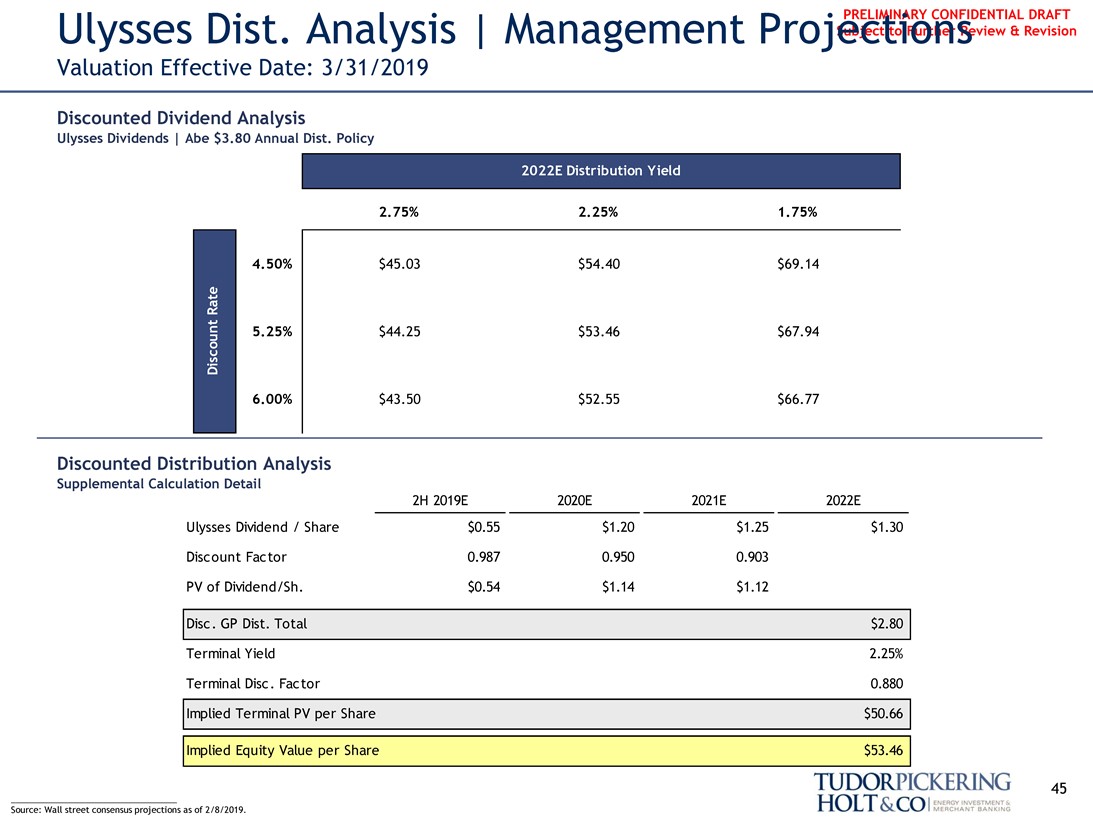
Discounted Dividend Analysis
Ulysses Dividends | Abe $3.80 Annual Dist. Policy
2022E Distribution Yield
discount rate
2.75% 2.25% 1.75%
4.50% $45.03 $54.40 $69.14
5.25% $44.25 $53.46 $67.94
6.00% $43.50 $52.55 $66.77
Discounted Distribution Analysis
Supplemental Calculation Detail
2H 2019E 2020E 2021E 2022E
Ulysses Dividend / Share $0.55 $1.20 $1.25 $1.30 Discount Factor 0.987 0.950 0.903 PV of Dividend/Sh. $0.54 $1.14 $1.12 Disc. GP Dist. Total $2.80 Terminal Yield 2.25% Terminal Disc. Factor 0.880 Implied Terminal PV per Share $50.66 Implied Equity Value per Share $53.46
___________________________________ 45 Source: Wall street consensus projections as of 2/8/2019.
TUDORPICKERING HOLT&CO
ENERGY INVESTMENT & MERCHANT BANKING
PRELIMINARY CONFIDENTIAL DRAFT
Ulysses Illustrative Discounted Future Value Subject to Further Review & Revision
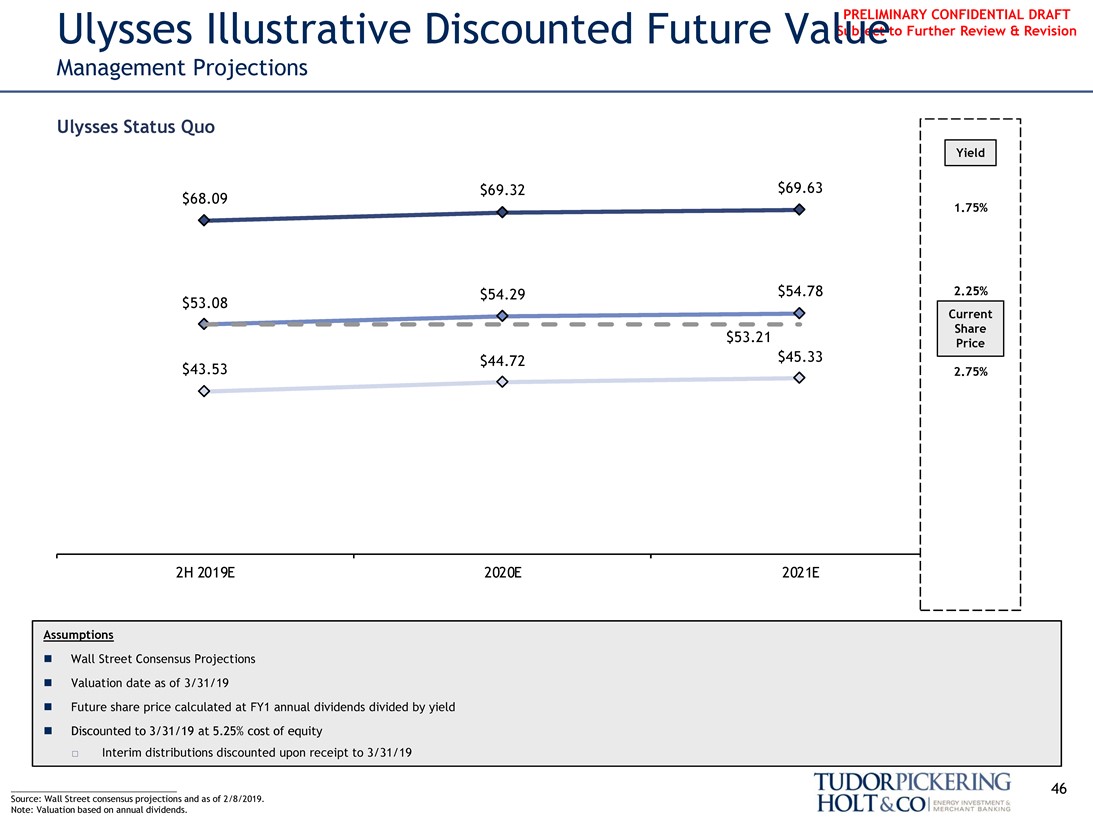
Management Projections
Ulysses Status Quo
Yield
$69.32 $69.63 $68.09
1.75%
$54.29 $54.78 2.25% $53.08
Current Share Price $53.21 $44.72 $45.33 $43.53 2.75%
2H 2019E 2020E 2021E
Assumptions
∎ Wall Street Consensus Projections∎ Valuation date as of 3/31/19
∎ Future share price calculated at FY1 annual dividends divided by yield
∎ Discounted to 3/31/19 at 5.25% cost of equity
☐ Interim distributions discounted upon receipt to 3/31/19
___________________________________ 46 Source: Wall Street consensus projections and as of 2/8/2019.
Note: Valuation based on annual dividends.
TUDORPICKERING HOLT&CO
ENERGY INVESTMENT & MERCHANT BANKING
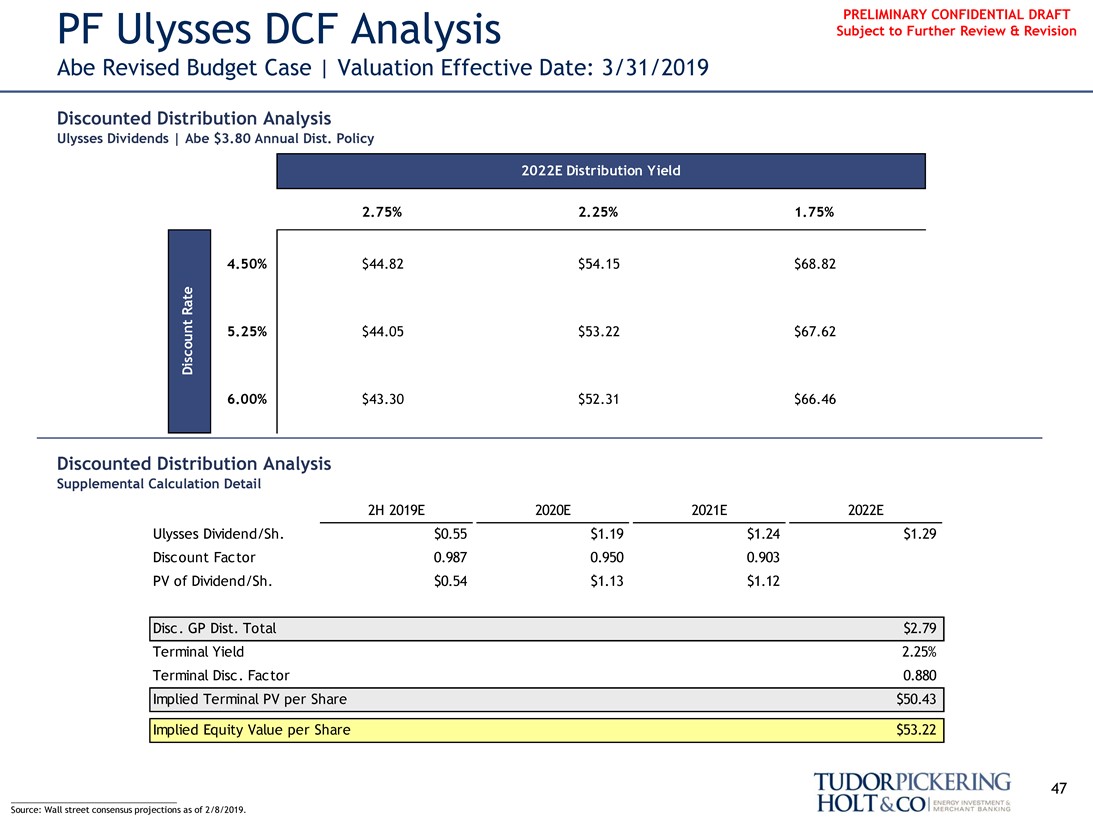
PRELIMINARY CONFIDENTIAL DRAFT PF Ulysses DCF Analysis Subject to Further Review & Revision
Abe Revised Budget Case | Valuation Effective Date: 3/31/2019
Discounted Distribution Analysis
Ulysses Dividends | Abe $3.80 Annual Dist. Policy
2022E Distribution Yield
Discount Rate
2.75% 2.25% 1.75%
4.50% $44.82 $54.15 $68.82
5.25% $44.05 $53.22 $67.62
6.00% $43.30 $52.31 $66.46
Discounted Distribution Analysis
Supplemental Calculation Detail
2H 2019E 2020E 2021E 2022E
Ulysses Dividend/Sh. $0.55 $1.19 $1.24 $1.29 Discount Factor 0.987 0.950 0.903 PV of Dividend/Sh. $0.54 $1.13 $1.12
Disc. GP Dist. Total $2.79 Terminal Yield 2.25% Terminal Disc. Factor 0.880 Implied Terminal PV per Share $50.43
Implied Equity Value per Share $53.22
___________________________________ 47 Source: Wall street consensus projections as of 2/8/2019.
TUDORPICKERING HOLT&CO
ENERGY INVESTMENT & MERCHANT BANKING
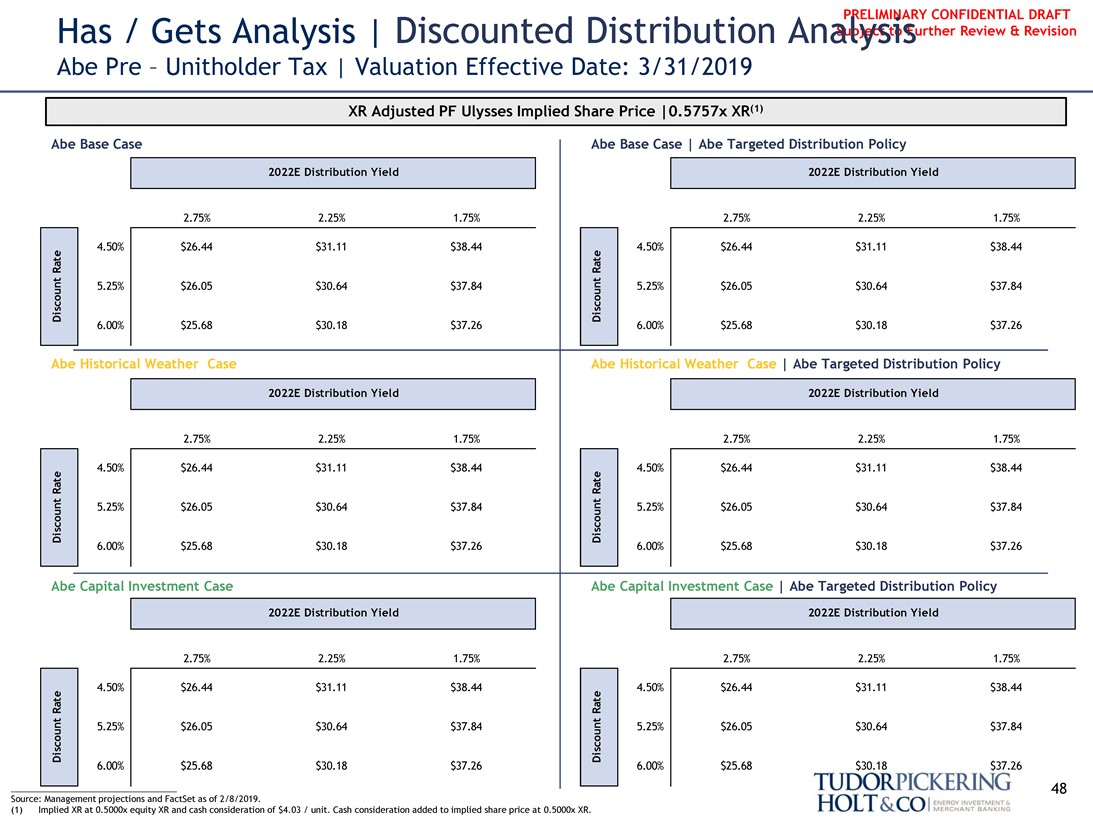
PRELIMINARY CONFIDENTIAL DRAFT Has / Gets Analysis | Discounted Distribution Analysis Subject to Further Review & Revision
Abe Pre – Unitholder Tax | Valuation Effective Date: 3/31/2019
XR Adjusted PF Ulysses Implied Share Price |0.5757x XR(1)
Abe Base Case Abe Base Case | Abe Targeted Distribution Policy
2022E Distribution Yield 2022E Distribution Yield
2.75% 2.25% 1.75% 2.75% 2.25% 1.75%
Discount Rate
Discount Rate
4.50% $26.44 $31.11 $38.44 4.50% $26.44 $31.11 $38.44
5.25% $26.05 $30.64 $37.84 5.25% $26.05 $30.64 $37.84
6.00% $25.68 $30.18 $37.26 6.00% $25.68 $30.18 $37.26
Discount Rate
Discount Rate
Abe Historical Weather Case Abe Historical Weather Case | Abe Targeted Distribution Policy
2022E Distribution Yield 2022E Distribution Yield
2.75% 2.25% 1.75% 2.75% 2.25% 1.75%
4.50% $26.44 $31.11 $38.44 4.50% $26.44 $31.11 $38.44 5.25% $26.05 $30.64 $37.84 5.25% $26.05 $30.64 $37.84
6.00% $25.68 $30.18 $37.26 6.00% $25.68 $30.18 $37.26
Discount Rate
Discount Rate
Abe Capital Investment Case Abe Capital Investment Case | Abe Targeted Distribution Policy
2022E Distribution Yield 2022E Distribution Yield
2.75% 2.25% 1.75% 2.75% 2.25% 1.75%
4.50% $26.44 $31.11 $38.44 4.50% $26.44 $31.11 $38.44 5.25% $26.05 $30.64 $37.84 5.25% $26.05 $30.64 $37.84
6.00% $25.68 $30.18 $37.26 6.00% $25.68 $30.18 $37.26
___________________________________ 48 Source: Management projections and FactSet as of 2/8/2019.
(1) Implied XR at 0.5000x equity XR and cash consideration of $4.03 / unit. Cash consideration added to implied share price at 0.5000x XR.
TUDORPICKERING HOLT&CO
ENERGY INVESTMENT & MERCHANT BANKING
PRELIMINARY CONFIDENTIAL DRAFT Subject to Further Review & Revision
Appendix
49
TUDORPICKERING HOLT&CO
ENERGY INVESTMENT & MERCHANT BANKING
PRELIMINARY CONFIDENTIAL DRAFT Subject to Further Review & Revision
Cost of Capital
50
TUDORPICKERING HOLT&CO
ENERGY INVESTMENT & MERCHANT BANKING
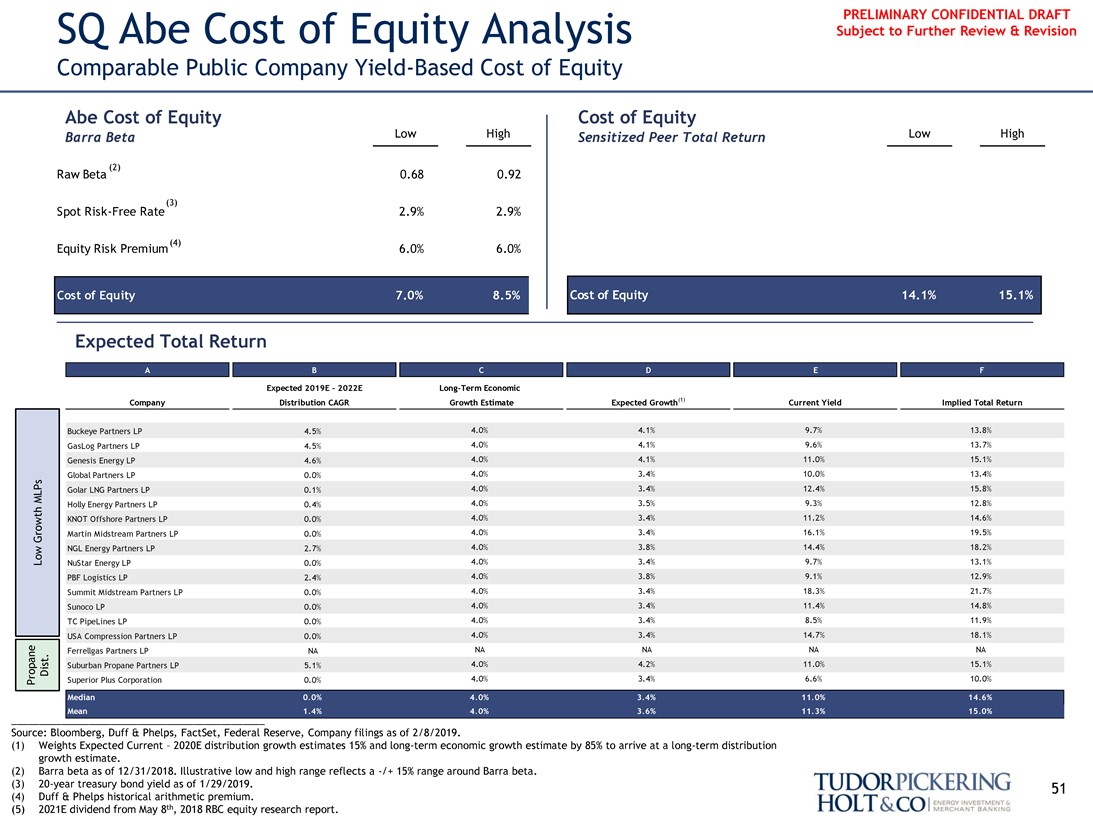
PRELIMINARY CONFIDENTIAL DRAFT SQ Abe Cost of Equity Analysis Subject to Further Review & Revision
Comparable Public Company Yield-Based Cost of Equity
Abe Cost of Equity Cost of Equity
Barra Beta Low High Sensitized Peer Total Return Low High
(2)
Raw Beta 0.68 0.92
(3)
Spot Risk-Free Rate 2.9% 2.9%
(4)
Equity Risk Premium 6.0% 6.0%
Cost of Equity 7.0% 8.5%
cost of equity 14.1% 15.1%
Expected Total Return
ABCDEF
Expected 2019E-2022E Long-Term Economic
Company Distribution CAGR Growth Estimate Expected Growth(1) Current Yield Implied Total Return
Buckeye Partners LP 4.5% 4.0% 4.1% 9.7% 13.8% GasLog Partners LP 4.5% 4.0% 4.1% 9.6% 13.7% Genesis Energy LP 4.6% 4.0% 4.1% 11.0% 15.1% Global Partners LP 0.0% 4.0% 3.4% 10.0% 13.4% MLPs Golar LNG Partners LP 0.1% 4.0% 3.4% 12.4% 15.8% Holly Energy Partners LP 0.4% 4.0% 3.5% 9.3% 12.8% KNOT Offshore Partners LP 0.0% 4.0% 3.4% 11.2% 14.6% Growth Martin Midstream Partners LP 0.0% 4.0% 3.4% 16.1% 19.5% NGL Energy Partners LP 2.7% 4.0% 3.8% 14.4% 18.2% Low NuStar Energy LP 0.0% 4.0% 3.4% 9.7% 13.1% PBF Logistics LP 2.4% 4.0% 3.8% 9.1% 12.9% Summit Midstream Partners LP 0.0% 4.0% 3.4% 18.3% 21.7% Sunoco LP 0.0% 4.0% 3.4% 11.4% 14.8% TC PipeLines LP 0.0% 4.0% 3.4% 8.5% 11.9% USA Compression Partners LP 0.0% 4.0% 3.4% 14.7% 18.1% NA NA NA NA
Ferrellgas Partners LP NA
Dist. Suburban Propane Partners LP 5.1% 4.0% 4.2% 11.0% 15.1% Propane Superior Plus Corporation 0.0% 4.0% 3.4% 6.6% 10.0%
Median0.0%4.0%3.4%11.0%14.6%
Mean1.4%4.0%3.6%11.3%15.0%
______________________________________________ Source: Bloomberg, Duff & Phelps, FactSet, Federal Reserve, Company filings as of 2/8/2019.
(1) Weights Expected Current – 2020E distribution growth estimates 15% and long-term economic growth estimate by 85% to arrive at a long-term distribution growth estimate.
(2) Barra beta as of 12/31/2018. Illustrative low and high range reflects a -/+ 15% range around Barra beta.
(3)20-year treasury bond yield as of 1/29/2019. 51 (4) Duff & Phelps historical arithmetic premium.
(5) 2021E dividend from May 8th, 2018 RBC equity research report.
TUDORPICKERING HOLT&CO
ENERGY INVESTMENT & MERCHANT BANKING
PRELIMINARY CONFIDENTIAL DRAFT Subject to Further Review & Revision
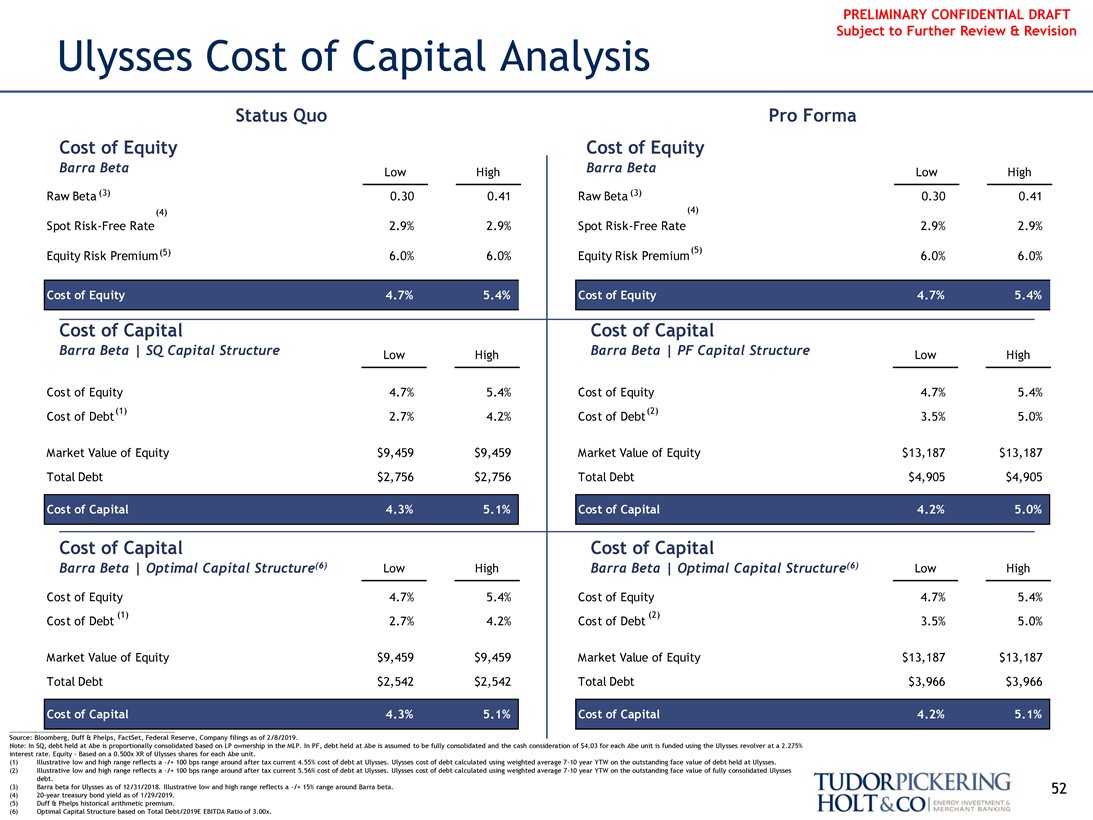
Ulysses Cost of Capital Analysis
Status Quo Pro Forma Cost of Equity Cost of Equity
Barra Beta Low High Barra Beta Low High Raw Beta (3) 0.30 0.41 Raw Beta (3) 0.30 0.41
(4) (4)
Spot Risk-Free Rate 2.9% 2.9% Spot Risk-Free Rate 2.9% 2.9%
Cost of Equity 4.7% 5.4%
Equity Risk Premium(5) 6.0% 6.0% Equity Risk Premium(5) 6.0% 6.0%
Cost of Equity 4.7% 5.4%
Cost of Capital Cost of Capital
Barra Beta | SQ Capital Structure Low High Barra Beta | PF Capital Structure Low High
Cost of Equity 4.7% 5.4% Cost of Equity 4.7% 5.4% Cost of Debt(1) 2.7% 4.2% Cost of Debt(2) 3.5% 5.0%
Cost of Capital 4.3% 5.1% Cost of Capital 4.2% 5.0%
Market Value of Equity $9,459 $9,459 Market Value of Equity $13,187 $13,187 Total Debt $2,756 $2,756 Total Debt $4,905 $4,905
Cost of Capital Cost of Capital
Barra Beta | Optimal Capital Structure(6) Low High Barra Beta | Optimal Capital Structure(6) Low High
Cost of Equity 4.7% 5.4% Cost of Equity 4.7% 5.4%
Cost of Capital 4.3% 5.1% Cost of Capital 4.2% 5.1%
(1) (2)
Cost of Debt 2.7% 4.2% Cost of Debt 3.5% 5.0%
Market Value of Equity $9,459 $9,459 Market Value of Equity $13,187 $13,187 Total Debt $2,542 $2,542 Total Debt $3,966 $3,966
Source: Bloomberg, Duff & Phelps, FactSet, Federal Reserve, Company filings as of 2/8/2019.
Note: In SQ, debt held at Abe is proportionally consolidated based on LP ownership in the MLP. In PF, debt held at Abe is assumed to be fully consolidated and the cash consideration of $4.03 for each Abe unit is funded using the Ulysses revolver at a 2.275% interest rate. Equity – Based on a 0.500x XR of Ulysses shares for each Abe unit.
(1) Illustrative low and high range reflects a -/+ 100 bps range around after tax current 4.55% cost of debt at Ulysses. Ulysses cost of debt calculated using weighted average7-10 year YTW on the outstanding face value of debt held at Ulysses. (2) Illustrative low and high range reflects a -/+ 100 bps range around after tax current 5.56% cost of debt at Ulysses. Ulysses cost of debt calculated using weighted average7-10 year YTW on the outstanding face value of fully consolidated Ulysses debt.
(3) Barra beta for Ulysses as of 12/31/2018. Illustrative low and high range reflects a -/+ 15% range around Barra beta. 52 (4)20-year treasury bond yield as of 1/29/2019.
(5) Duff & Phelps historical arithmetic premium.
(6) Optimal Capital Structure based on Total Debt/2019E EBITDA Ratio of 3.00x.
TUDORPICKERING HOLT&CO
ENERGY INVESTMENT & MERCHANT BANKING
PRELIMINARY CONFIDENTIAL DRAFT Subject to Further Review & Revision
Additional Future Analysis
53
TUDORPICKERING HOLT&CO
ENERGY INVESTMENT & MERCHANT BANKING
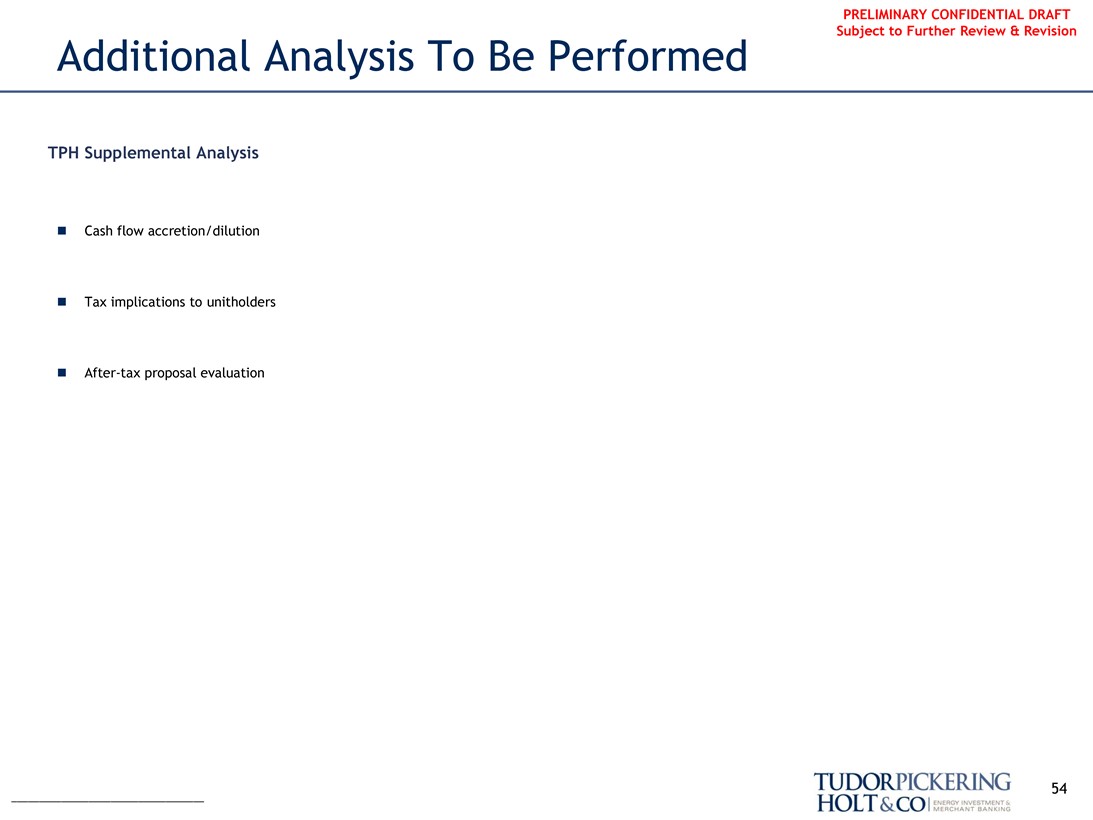
PRELIMINARY CONFIDENTIAL DRAFT Subject to Further Review & Revision
Additional Analysis To Be Performed
TPH Supplemental Analysis
∎ Cash flow accretion/dilution∎ Tax implications to unitholders∎After-tax proposal evaluation
54
TUDORPICKERING HOLT&CO
ENERGY INVESTMENT & MERCHANT BANKING
PRELIMINARY CONFIDENTIAL DRAFT Subject to Further Review & Revision
Disclosure Statement
Tudor, Pickering, Holt & Co. does not provide accounting, tax or legal advice. This presentation does not constitute a tax opinion and cannot be used by any taxpayer for the purpose of avoiding tax penalties. We (i) make no conclusion on the valuation or About The Firm pricing for tax purposes or the effects of federal income tax laws on any party and (ii) have assumed that the party’s intended tax treatment will be respected. Each person should seek legal, regulatory, accounting and tax advice based on his, her or its Tudor, Pickering, Holt & Co. is an integrated energy investment and merchant particular circumstances from independent advisors regarding the evaluation and bank, providing high quality advice and services to institutional and corporate impact of any transactions or matters described herein. clients. Through the company’s two broker-dealer units, Tudor, Pickering, Holt & Co. Securities, Inc. (TPHCSI) and Tudor Pickering Holt & Co Advisors LP (TPHCA), The information contained herein is confidential (except for information relating to members FINRA, together with affiliates in the United Kingdom and Canada, the United States tax issues) and may not be reproduced in whole or in part except as set company offers securities and investment banking services to the energy forth in a written agreement between the Audit Committee of the Board of Directors community. Perella Weinberg Partners Capital Management LP is an SEC of AmeriGas Propane, Inc. and Tudor, Pickering, Holt & Co. registered investment adviser that delivers a suite of energy investment strategies. Tudor, Pickering, Holt & Co. assumes no responsibility for independent verification of third-party information and has relied on such information being complete and The firm, headquartered in Houston, Texas, has approximately 170 employees accurate in all material respects. To the extent such information includes estimates and offices in Calgary, Canada; Denver, Colorado; New York, New York; and and forecasts of future financial performance (including estimates of potential cost London, England. savings and synergies) prepared by, reviewed or discussed with the managements of your company and/ or other potential transaction participants or obtained from public
Contact Us sources, we have assumed that such estimates and forecasts have been reasonably
Houston (Research, Sales and Trading):713-333-2960 prepared on bases reflecting the best currently available estimates and judgments of Houston (Investment Banking):713-333-7100 such managements (or, with respect to estimates and forecasts obtained from public Houston (Asset Management):713-337-3999 sources, represent reasonable estimates). These materials were designed for use by Denver (Sales):303-300-1900 specific persons familiar with the business and the affairs of your company and Tudor, Denver (Investment Banking):303-300-1900 Pickering, Holt & Co. materials.
New York (Investment Banking):212-610-1660
New York (Research, Sales):212-610-1600 Under no circumstances is this presentation to be used or considered as an offer to London: +011 44(0) 20 7268 2800 sell or a solicitation of any offer to buy, any security. Prior to making any trade, you Calgary:403-705-7830 should discuss with your professional tax, accounting, or regulatory advisers how such particular trade(s) affect you. This brief statement does not
disclose all of the risks www.TPHco.com and other significant aspects of entering into any particular transaction.
Copyright 2019 — Tudor, Pickering, Holt & Co. Tudor, Pickering, Holt & Co. operates in the United Kingdom under the trading name Perella Weinberg Partners UK LLP (authorized and regulated by the Financial Conduct Authority), and in Canada through its affiliate, Tudor, Pickering, Holt & Co. Securities
– Canada, ULC, located in Calgary, Alberta.
55
TUDORPICKERING HOLT&CO
ENERGY INVESTMENT & MERCHANT BANKING


