Exhibit (c)(8)

PRELIMINARY CONFIDENTIAL DRAFT Subject to Further Review & Revision
Project Rushmore Discussion Materials
January 31st, 2019
TUDORPICKERING HOLT&CO
ENERGY INVESTMENT & MERCHANT BANKING
PRELIMINARY CONFIDENTIAL DRAFT Subject to Further Review & Revision
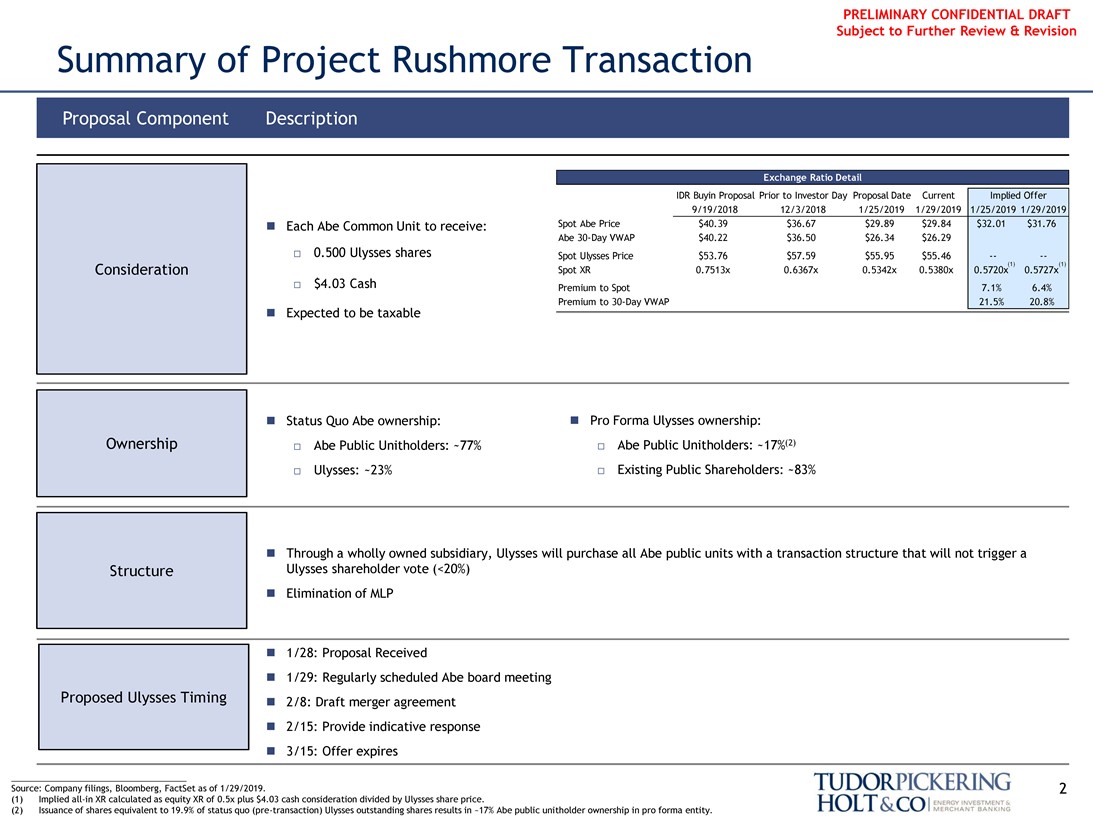
Summary of Project Rushmore Transaction
proposal component description
Exchange ratio detail
IDR Buyin Proposal Prior to Investor Day Proposal Date Current Implied Offer 9/19/2018 12/3/2018 1/25/2019 1/29/2019 1/25/2019 1/29/2019∎ Each Abe Common Unit to receive: Spot Abe Price $40.39 $36.67 $29.89 $29.84 $32.01 $31.76 Abe30-Day VWAP $40.22 $36.50 $26.34 $26.29
☐ 0.500 Ulysses shares Spot Ulysses Price $53.76 $57.59 $55.95 $55.46 -- --
(1) (1)
Consideration Spot XR 0.7513x 0.6367x 0.5342x 0.5380x 0.5720x 0.5727x
☐ $4.03 Cash Premium to Spot 7.1% 6.4%∎ Expected to be taxable Premium to30-Day VWAP 21.5% 20.8%
∎ Status Quo Abe ownership:∎ Pro Forma Ulysses ownership: Ownership ☐ Abe Public Unitholders: ~77% ☐ Abe Public Unitholders: ~17%(2)
☐ Ulysses: ~23% ☐ Existing Public Shareholders: ~83%
∎ Through a wholly owned subsidiary, Ulysses will purchase all Abe public units with a transaction structure that will not trigger a Structure Ulysses shareholder vote (<20%)∎ Elimination of MLP
∎ 1/28: Proposal Received
∎ 1/29: Regularly scheduled Abe board meeting Proposed Ulysses Timing∎ 2/8: Draft merger agreement∎ 2/15: Provide indicative response∎ 3/15: Offer expires
Source: Company filings, Bloomberg, FactSet as of 1/29/2019. 2 (1) Impliedall-in XR calculated as equity XR of 0.5x plus $4.03 cash consideration divided by Ulysses share price.
(2) Issuance of shares equivalent to 19.9% of status quo(pre-transaction) Ulysses outstanding shares results in ~17% Abe public unitholder ownership in pro forma entity.
TUDORPICKERING HOLT&CO
ENERGY INVESTMENT & MERCHANT BANKING
PRELIMINARY CONFIDENTIAL DRAFT Subject to Further Review & Revision
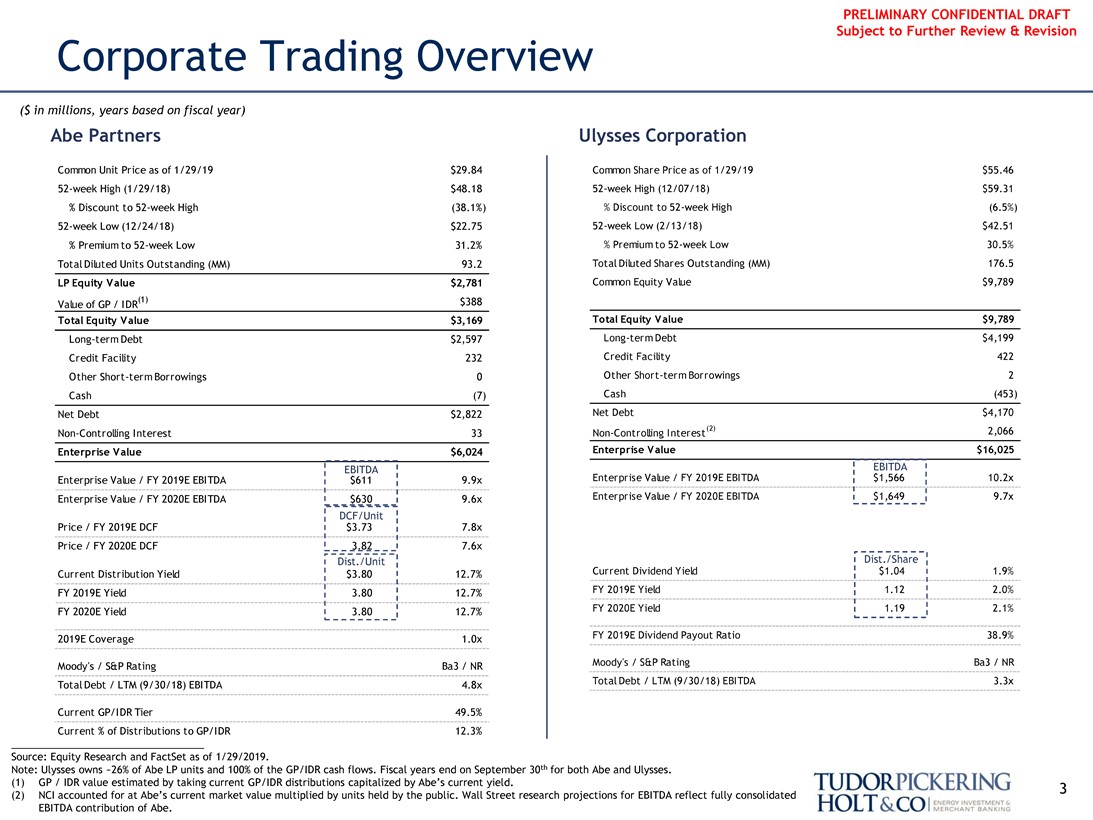
Corporate Trading Overview
($ in millions, years based on fiscal year)
Abe Partners Ulysses Corporation
Common Unit Price as of 1/29/19 $29.84 Common Share Price as of 1/29/19 $55.4652-week High (1/29/18) $48.1852-week High (12/07/18) $59.31
% Discount to52-week High (38.1%) % Discount to52-week High (6.5%)52-week Low (12/24/18) $22.7552-week Low (2/13/18) $42.51
% Premium to52-week Low 31.2% % Premium to52-week Low 30.5% Total Diluted Units Outstanding (MM) 93.2 Total Diluted Shares Outstanding (MM) 176.5 LP Equity Value $2,781 Common Equity Value $9,789 Value of GP / IDR(1) $388
Total Equity Value $3,169 Total Equity Value $9,789
Long-term Debt $2,597 Long-term Debt $4,199 Credit Facility 232 Credit Facility 422 Other Short-term Borrowings 0 Other Short-term Borrowings 2 Cash (7) Cash (453) Net Debt $2,822 Net Debt $4,170Non-Controlling Interest 33Non-Controlling Interest(2) 2,066
Enterprise Value $6,024 Enterprise Value $16,025
EBITDA EBITDA
Enterprise Value / FY 2019E EBITDA $611 9.9x Enterprise Value / FY 2019E EBITDA $1,566 10.2x Enterprise Value / FY 2020E EBITDA $630 9.6x Enterprise Value / FY 2020E EBITDA $1,649 9.7x
DCF/Unit
Price / FY 2019E DCF $3.73 7.8x Price / FY 2020E DCF 3.82 7.6x
Dist./Unit Dist./Share
Current Distribution Yield $3.80 12.7% Current Dividend Yield $1.04 1.9% FY 2019E Yield 3.80 12.7% FY 2019E Yield 1.12 2.0% FY 2020E Yield 3.80 12.7% FY 2020E Yield 1.19 2.1% 2019E Coverage 1.0x FY 2019E Dividend Payout Ratio 38.9% Moody’s / S&P Rating Ba3 / NR Moody’s / S&P Rating Ba3 / NR Total Debt / LTM (9/30/18) EBITDA 4.8x Total Debt / LTM (9/30/18) EBITDA 3.3x
Current GP/IDR Tier 49.5% Current % of Distributions to GP/IDR 12.3%
Source: Equity Research and FactSet as of 1/29/2019.
Note: Ulysses owns ~26% of Abe LP units and 100% of the GP/IDR cash flows. Fiscal years end on September 30th for both Abe and Ulysses.
(1) GP / IDR value estimated by taking current GP/IDR distributions capitalized by Abe’s current yield. 3 (2) NCI accounted for at Abe’s current market value multiplied by units held by the public. Wall Street research projections for EBITDA reflect fully consolidated EBITDA contribution of Abe.
TUDORPICKERING HOLT&CO
ENERGY INVESTMENT & MERCHANT BANKING
PRELIMINARY CONFIDENTIAL DRAFT Abe Comparable Performance Subject to Further Review & Revision
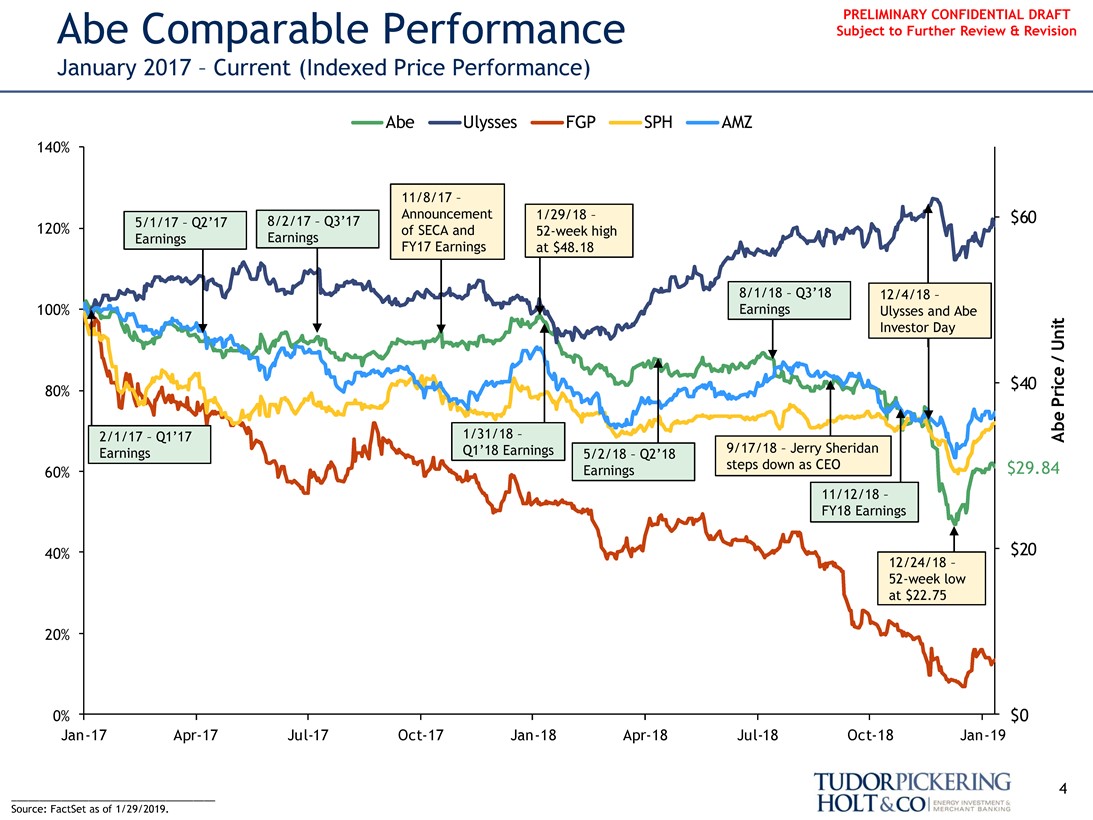
January 2017 – Current (Indexed Price Performance)
Abe Ulysses FGP SPH AMZ
140%
11/8/17 –
Announcement 1/29/18 – $60 5/1/17 – Q2’17 8/2/17 – Q3’17 120% of SECA and52-week high Earnings Earnings FY17 Earnings at $48.18
8/1/18 – Q3’18 12/4/18 –100% Earnings Ulysses and Abe
Investor Day
Abe Price / Unit
80% $40
1/31/18 – 2/1/17 – Q1’17 Earnings Q1’18 Earnings 5/2/18 – Q2’18 9/17/18 – Jerry Sheridan Earnings steps down as CEO $29.84
60%
11/12/18 –FY18 Earnings
40% $20
12/24/18–52-week low at $22.75
20%
0% $0Jan-17Apr-17Jul-17Oct-17Jan-18Apr-18Jul-18Oct-18Jan-19
4
_____________________________________ Source: FactSet as of 1/29/2019.
TUDORPICKERING HOLT&CO
ENERGY INVESTMENT & MERCHANT BANKING
PRELIMINARY CONFIDENTIAL DRAFT Abe Comparable Performance Subject to Further Review & Revision
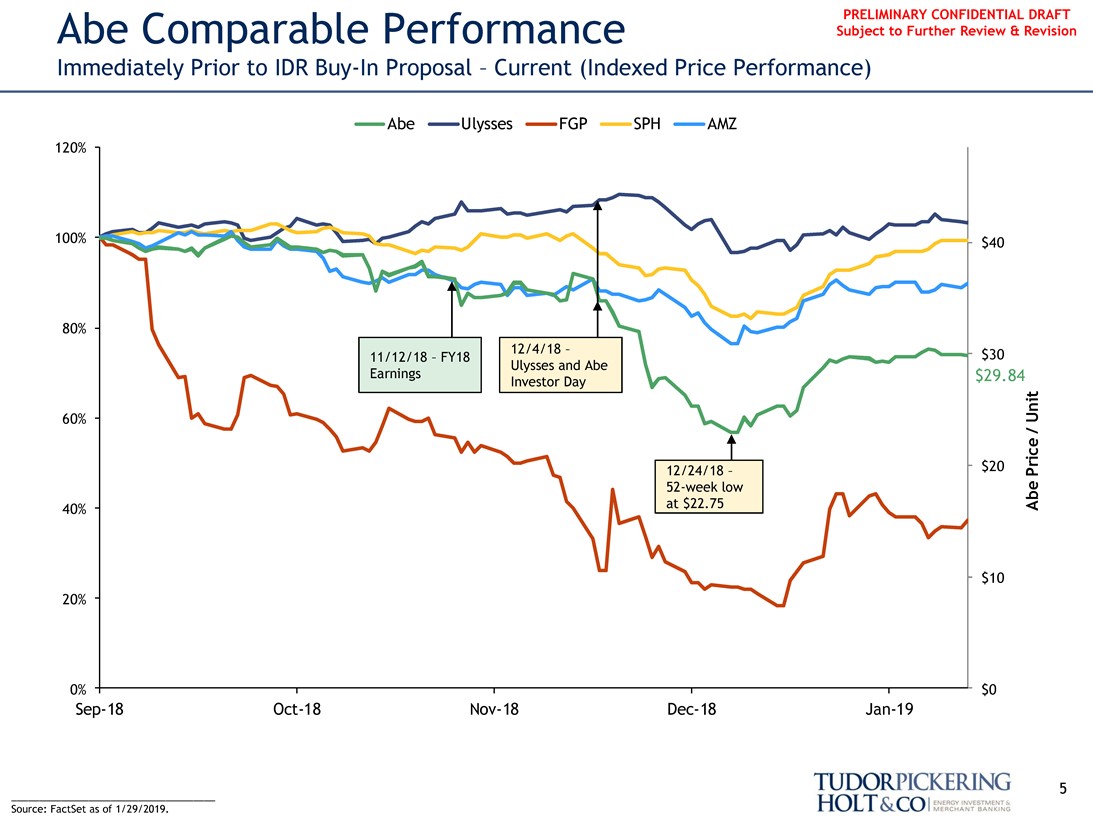
Immediately Prior to IDRBuy-In Proposal – Current (Indexed Price Performance)
Abe Ulysses FGP SPH AMZ
120%
100% $40
80%
12/4/18 – $30 11/12/18 – FY18 Ulysses and Abe Earnings $29.84 Investor Day
Abe Price / Unit
60%
$20
12/24/18 –52-week low 40% at $22.75
$10 20%
0% $0
Sep-18Oct-18Nov-18Dec-18Jan-19
5
_____________________________________ Source: FactSet as of 1/29/2019.
TUDORPICKERING HOLT&CO
ENERGY INVESTMENT & MERCHANT BANKING
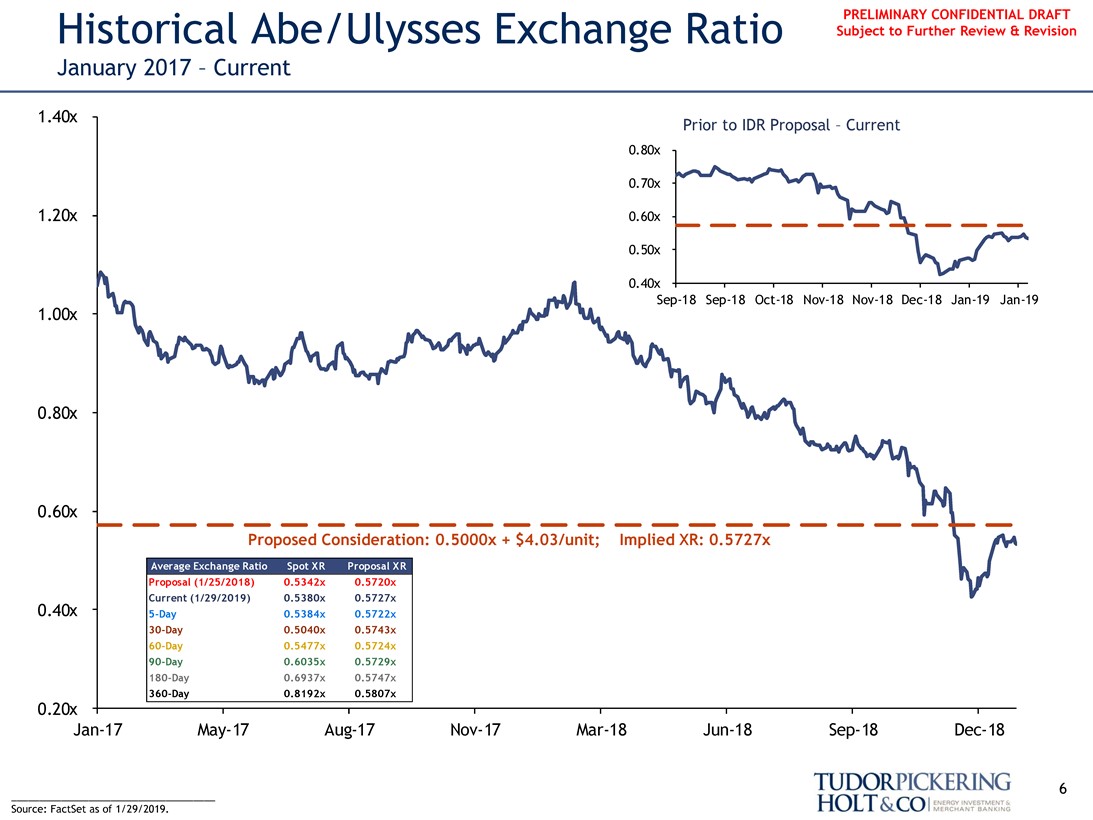
PRELIMINARY CONFIDENTIAL DRAFT
Historical Abe/Ulysses Exchange Ratio Subject to Further Review & Revision
January 2017 – Current
1.40x
Prior to IDR Proposal – Current
0.80x
0.70x
1.20x 0.60x
0.50x
0.40x
1.00xSep-18Sep-18Oct-18Nov-18Nov-18Dec-18Jan-19Jan-19
0.80x
0.60x
Average Exchange Ratio Spot XR Proposal XR
Proposed Consideration: 0.5000x + $4.03/unit; Implied XR: 0.5727x
Proposal (1/25/2018) 0.5342x 0.5720x Current (1/29/2019) 0.5380x 0.5727x
0.40x5-Day 0.5384x 0.5722x30-Day 0.5040x 0.5743x60-Day 0.5477x 0.5724x90-Day 0.6035x 0.5729x180-Day 0.6937x 0.5747x360-Day 0.8192x 0.5807x
0.20x
Jan-17May-17Aug-17Nov-17Mar-18Jun-18Sep-18Dec-18
6
_____________________________________ Source: FactSet as of 1/29/2019.
TUDORPICKERING HOLT&CO
ENERGY INVESTMENT & MERCHANT BANKING
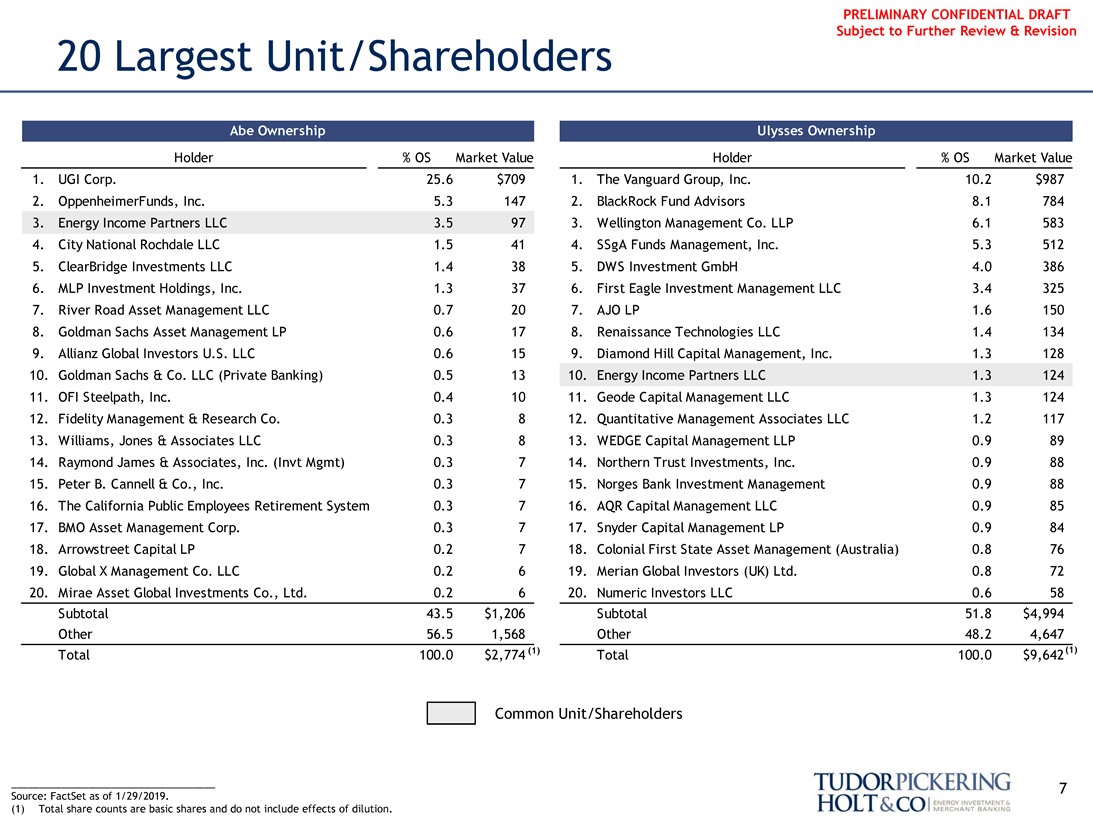
PRELIMINARY CONFIDENTIAL DRAFT Subject to Further Review & Revision
20 Largest Unit/Shareholders
Abe Ownership Ulysses Ownership
Holder % OS Market Value Holder % OS Market Value
1. UGI Corp. 25.6 $709 1. The Vanguard Group, Inc. 10.2 $987
2. OppenheimerFunds, Inc. 5.3 147 2. BlackRock Fund Advisors 8.1 784
3. Energy Income Partners LLC 3.5 97 3. Wellington Management Co. LLP 6.1 583
4. City National Rochdale LLC 1.5 41 4. SSgA Funds Management, Inc. 5.3 512
5. ClearBridge Investments LLC 1.4 38 5. DWS Investment GmbH 4.0 386
6. MLP Investment Holdings, Inc. 1.3 37 6. First Eagle Investment Management LLC 3.4 325
7. River Road Asset Management LLC 0.7 20 7. AJO LP 1.6 150
8. Goldman Sachs Asset Management LP 0.6 17 8. Renaissance Technologies LLC 1.4 134
9. Allianz Global Investors U.S. LLC 0.6 15 9. Diamond Hill Capital Management, Inc. 1.3 128 10. Goldman Sachs & Co. LLC (Private Banking) 0.5 13 10. Energy Income Partners LLC 1.3 124 11. OFI Steelpath, Inc. 0.4 10 11. Geode Capital Management LLC 1.3 124 12. Fidelity Management & Research Co. 0.3 8 12. Quantitative Management Associates LLC 1.2 117 13. Williams, Jones & Associates LLC 0.3 8 13. WEDGE Capital Management LLP 0.9 89 14. Raymond James & Associates, Inc. (Invt Mgmt) 0.3 7 14. Northern Trust Investments, Inc. 0.9 88 15. Peter B. Cannell & Co., Inc. 0.3 7 15. Norges Bank Investment Management 0.9 88 16. The California Public Employees Retirement System 0.3 7 16. AQR Capital Management LLC 0.9 85 17. BMO Asset Management Corp. 0.3 7 17. Snyder Capital Management LP 0.9 84 18. Arrowstreet Capital LP 0.2 7 18. Colonial First State Asset Management (Australia) 0.8 76 19. Global X Management Co. LLC 0.2 6 19. Merian Global Investors (UK) Ltd. 0.8 72 20. Mirae Asset Global Investments Co., Ltd. 0.2 6 20. Numeric Investors LLC 0.6 58 Subtotal 43.5 $1,206 Subtotal 51.8 $4,994 Other 56.5 1,568 Other 48.2 4,647 Total 100.0 $2,774 (1) Total 100.0 $9,642(1)
Common Unit/Shareholders
_____________________________________ 7 Source: FactSet as of 1/29/2019.
(1) Total share counts are basic shares and do not include effects of dilution.
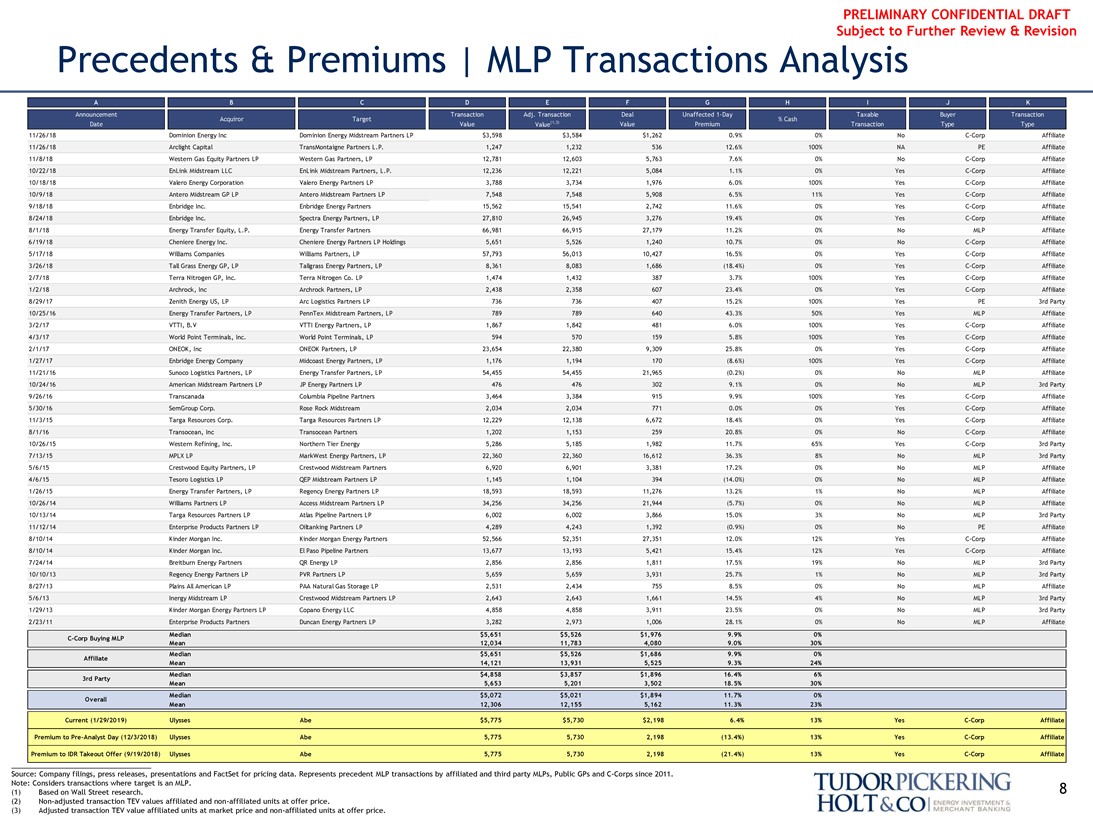
PRELIMINARY CONFIDENTIAL DRAFT Subject to Further Review & Revision
Precedents & Premiums | MLP Transactions Analysis
A B C D E F G H I J K
Announcement Transaction Adj. Transaction Deal Unaffected 1-Day Taxable Buyer Transaction Acquiror Target % Cash Date Value Value(1,3) Value Premium Transaction Type Type
11/26/18 Dominion Energy Inc Dominion Energy Midstream Partners LP $3,598 $3,584 $1,262 0.9% 0% NoC-Corp Affiliate 11/26/18 Arclight Capital TransMontaigne Partners L.P. 1,247 1,232 536 12.6% 100% NA PE Affiliate 11/8/18 Western Gas Equity Partners LP Western Gas Partners, LP 12,781 12,603 5,763 7.6% 0% NoC-Corp Affiliate 10/22/18 EnLink Midstream LLC EnLink Midstream Partners, L.P. 12,236 12,221 5,084 1.1% 0% YesC-Corp Affiliate 10/18/18 Valero Energy Corporation Valero Energy Partners LP 3,788 3,734 1,976 6.0% 100% YesC-Corp Affiliate 10/9/18 Antero Midstream GP LP Antero Midstream Partners LP 7,548 7,548 5,908 6.5% 11% YesC-Corp Affiliate 9/18/18 Enbridge Inc. Enbridge Energy Partners 15,562 15,541 2,742 11.6% 0% YesC-Corp Affiliate 8/24/18 Enbridge Inc. Spectra Energy Partners, LP 27,810 26,945 3,276 19.4% 0% YesC-Corp Affiliate 8/1/18 Energy Transfer Equity, L.P. Energy Transfer Partners 66,981 66,915 27,179 11.2% 0% No MLP Affiliate 6/19/18 Cheniere Energy Inc. Cheniere Energy Partners LP Holdings 5,651 5,526 1,240 10.7% 0% NoC-Corp Affiliate 5/17/18 Williams Companies Williams Partners, LP 57,793 56,013 10,427 16.5% 0% YesC-Corp Affiliate 3/26/18 Tall Grass Energy GP, LP Tallgrass Energy Partners, LP 8,361 8,083 1,686 (18.4%) 0% YesC-Corp Affiliate 2/7/18 Terra Nitrogen GP, Inc. Terra Nitrogen Co. LP 1,474 1,432 387 3.7% 100% YesC-Corp Affiliate 1/2/18 Archrock, Inc Archrock Partners, LP 2,438 2,358 607 23.4% 0% YesC-Corp Affiliate 8/29/17 Zenith Energy US, LP Arc Logistics Partners LP 736 736 407 15.2% 100% Yes PE 3rd Party 10/25/16 Energy Transfer Partners, LP PennTex Midstream Partners, LP 789 789 640 43.3% 50% Yes MLP Affiliate 3/2/17 VTTI, B.V VTTI Energy Partners, LP 1,867 1,842 481 6.0% 100% YesC-Corp Affiliate 4/3/17 World Point Terminals, Inc. World Point Terminals, LP 594 570 159 5.8% 100% YesC-Corp Affiliate 2/1/17 ONEOK, Inc ONEOK Partners, LP 23,654 22,380 9,309 25.8% 0% YesC-Corp Affiliate 1/27/17 Enbridge Energy Company Midcoast Energy Partners, LP 1,176 1,194 170 (8.6%) 100% YesC-Corp Affiliate 11/21/16 Sunoco Logistics Partners, LP Energy Transfer Partners, LP 54,455 54,455 21,965 (0.2%) 0% No MLP Affiliate 10/24/16 American Midstream Partners LP JP Energy Partners LP 476 476 302 9.1% 0% No MLP 3rd Party 9/26/16 Transcanada Columbia Pipeline Partners 3,464 3,384 915 9.9% 100% YesC-Corp Affiliate 5/30/16 SemGroup Corp. Rose Rock Midstream 2,034 2,034 771 0.0% 0% YesC-Corp Affiliate 11/3/15 Targa Resources Corp. Targa Resources Partners LP 12,229 12,138 6,672 18.4% 0% YesC-Corp Affiliate 8/1/16 Transocean, Inc Transocean Partners 1,202 1,153 259 20.8% 0% NoC-Corp Affiliate 10/26/15 Western Refining, Inc. Northern Tier Energy 5,286 5,185 1,982 11.7% 65% YesC-Corp 3rd Party 7/13/15 MPLX LP MarkWest Energy Partners, LP 22,360 22,360 16,612 36.3% 8% No MLP 3rd Party 5/6/15 Crestwood Equity Partners, LP Crestwood Midstream Partners 6,920 6,901 3,381 17.2% 0% No MLP Affiliate 4/6/15 Tesoro Logistics LP QEP Midstream Partners LP 1,145 1,104 394 (14.0%) 0% No MLP Affiliate 1/26/15 Energy Transfer Partners, LP Regency Energy Partners LP 18,593 18,593 11,276 13.2% 1% No MLP Affiliate 10/26/14 Williams Partners LP Access Midstream Partners LP 34,256 34,256 21,944 (5.7%) 0% No MLP Affiliate 10/13/14 Targa Resources Partners LP Atlas Pipeline Partners LP 6,002 6,002 3,866 15.0% 3% No MLP 3rd Party 11/12/14 Enterprise Products Partners LP Oiltanking Partners LP 4,289 4,243 1,392 (0.9%) 0% No PE Affiliate 8/10/14 Kinder Morgan Inc. Kinder Morgan Energy Partners 52,566 52,351 27,351 12.0% 12% YesC-Corp Affiliate 8/10/14 Kinder Morgan Inc. El Paso Pipeline Partners 13,677 13,193 5,421 15.4% 12% YesC-Corp Affiliate 7/24/14 Breitburn Energy Partners QR Energy LP 2,856 2,856 1,811 17.5% 19% No MLP 3rd Party 10/10/13 Regency Energy Partners LP PVR Partners LP 5,659 5,659 3,931 25.7% 1% No MLP 3rd Party 8/27/13 Plains All American LP PAA Natural Gas Storage LP 2,531 2,434 755 8.5% 0% No MLP Affiliate 5/6/13 Inergy Midstream LP Crestwood Midstream Partners LP 2,643 2,643 1,661 14.5% 4% No MLP 3rd Party 1/29/13 Kinder Morgan Energy Partners LP Copano Energy LLC 4,858 4,858 3,911 23.5% 0% No MLP 3rd Party 2/23/11 Enterprise Products Partners Duncan Energy Partners LP 3,282 2,973 1,006 28.1% 0% No MLP Affiliate
Median $5,651 $5,526 $1,976 9.9% 0%C-Corp Buying MLP
Mean 12,034 11,783 4,080 9.0% 30% Median $5,651 $5,526 $1,686 9.9% 0% Affiliate Mean 14,121 13,931 5,525 9.3% 24% Median $4,858 $3,857 $1,896 16.4% 6% 3rd Party Mean 5,653 5,201 3,502 18.5% 30% Median $5,072 $5,021 $1,894 11.7% 0% Overall Mean 12,306 12,155 5,162 11.3% 23%
Current (1/29/2019) Ulysses Abe $5,775 $5,730 $2,198 6.4% 13% YesC-Corp Affiliate
Premium toPre-Analyst Day (12/3/2018) Ulysses Abe 5,775 5,730 2,198 (13.4%) 13% YesC-Corp Affiliate
Premium to IDR Takeout Offer (9/19/2018) Ulysses Abe 5,775 5,730 2,198 (21.4%) 13% YesC-Corp Affiliate
Source: Company filings, press releases, presentations and FactSet for pricing data. Represents precedent MLP transactions by affiliated and third party MLPs, Public GPs andC-Corps since 2011.
Note: Considers transactions where target is an MLP. 8 (1) Based on Wall Street research.
(2)Non-adjusted transaction TEV values affiliated andnon-affiliated units at offer price.
(3) Adjusted transaction TEV value affiliated units at market price andnon-affiliated units at offer price.
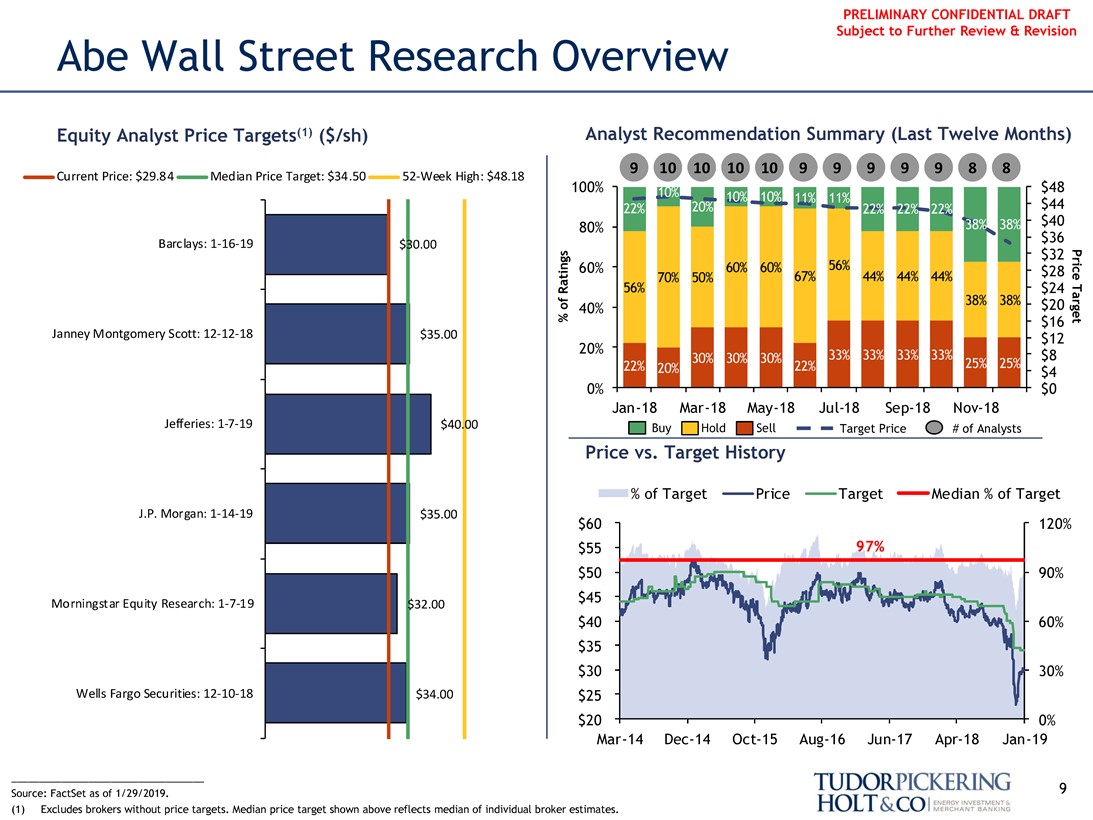
PRELIMINARY CONFIDENTIAL DRAFT Subject to Further Review & Revision
Abe Wall Street Research Overview
Equity Analyst Price Targets(1) ($/sh) Analyst Recommendation Summary (Last Twelve Months)
9 10 10 10 10 9 9 9 9 9 8 8
Current Price: $29.84 Median Price Target: $34.50 52-Week High: $48.18
100% 10% $48
10% 10% 11% 11%
22% 20% 22% 22% 22% $44 80% 38% 38% $40 $36
Barclays: 1-16-19 $30.00 $32
60% 60% 60% 56% $28
70% 50% 67% 44% 44% 44% Ratings 56% $24 38% 38% % of Ratings
40% $20
$16 Price Target
Janney Montgomery Scott: 12-12-18 $35.00 $12 20% 33% 33% 33% 33% $8 30% 30% 30% 25% 25%
22% 20% 22% $4
0% $0 Jan-18 Mar-18 May-18 Jul-18 Sep-18 Nov-18
Jefferies: 1-7-19 $40.00 Buy Hold Sell Target Price # of Analysts
Price vs. Target History
% of Target Price Target Median % of Target
J.P. Morgan: 1-14-19 $35.00
$60 120%
$55 97%
$50 90% $45
Morningstar Equity Research: 1-7-19 $32.00
$40 60% $35
$30 30%
Wells Fargo Securities: 12-10-18 $34.00 $25
$20 0% Mar-14 Dec-14 Oct-15 Aug-16 Jun-17 Apr-18 Jan-19
___________________________________
Source: FactSet as of 1/29/2019.
9
(1) Excludes brokers without price targets. Median price target shown above reflects median of individual broker estimates.
TUDORPICKERING HOLT&CO
ENERGY INVESTMENT & MERCHANT BANKING
PRELIMINARY CONFIDENTIAL DRAFT Subject to Further Review & Revision
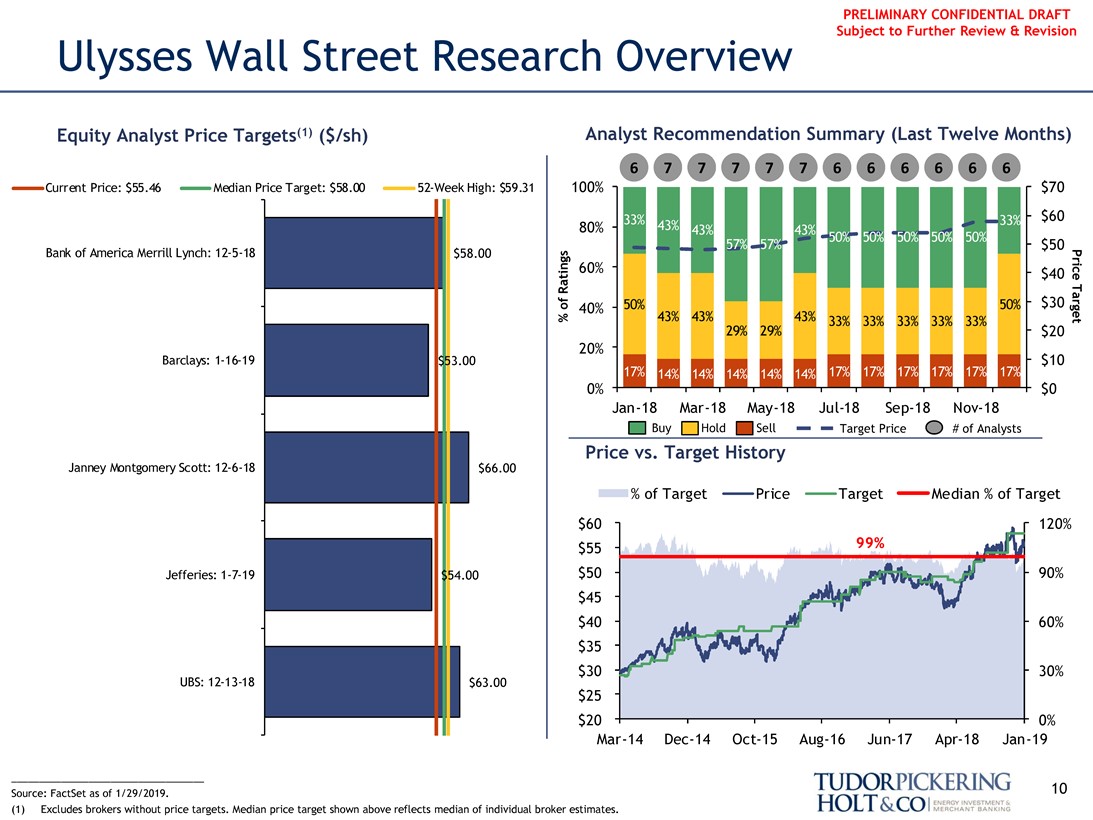
Ulysses Wall Street Research Overview
Equity Analyst Price Targets(1) ($/sh) Analyst Recommendation Summary (Last Twelve Months)
6 7 7 7 7 7 6 6 6 6 6 6
Current Price: $55.46 Median Price Target: $58.00 52-Week High: $59.31 100% $70
33% 33% $60 80% 43% 43% 43%
50% 50% 50% 50% 50%
57% 57% $50
Bank of America Merrill Lynch: 12-5-18 $58.00
% of Ratings 60% $40 $30 40% 50% 50% price target
43% 43% 43% 33% 33% 33% 33% 33%
29% 29% $20
Barclays: 1-16-19 $53.00 20% $10
17% 14% 14% 14% 14% 14% 17% 17% 17% 17% 17% 17%
0% $0 Jan-18 Mar-18 May-18 Jul-18 Sep-18 Nov-18
Buy Hold Sell Target Price # of Analysts
Price vs. Target History
Janney Montgomery Scott: 12-6-18 $66.00
% of Target Price Target Median % of Target
$60 120%
$55 99%
Jefferies: 1-7-19 $54.00 $50 90% $45
$40 60% $35
$30 30%
UBS: 12-13-18 $63.00 $25
$20 0% Mar-14 Dec-14 Oct-15 Aug-16 Jun-17 Apr-18 Jan-19
Source: FactSet as of 1/29/2019. 10
(1) Excludes brokers without price targets. Median price target shown above reflects median of individual broker estimates.
TUDORPICKERING HOLT&CO
ENERGY INVESTMENT & MERCHANT BANKING
PRELIMINARY CONFIDENTIAL DRAFT Subject to Further Review & Revision
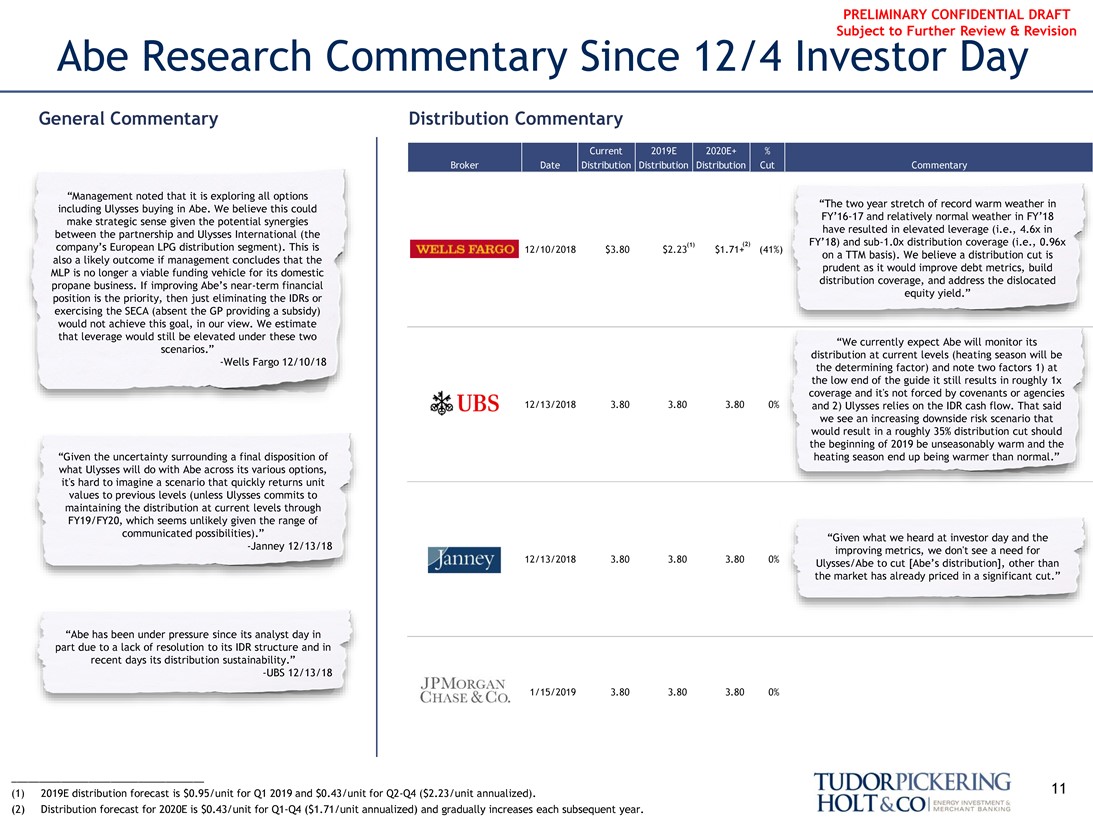
Abe Research Commentary Since 12/4 Investor Day
General Commentary Distribution Commentary
Current 2019E 2020E+ %
Broker Date Distribution Distribution Distribution Cut Commentary
wells fargo UBS janney jpmorgan chase&co.
“Management noted that it is exploring all options
“The two year stretch of record warm weather in including Ulysses buying in Abe. We believe this could
FY’16-17 and relatively normal weather in FY’18 make strategic sense given the potential synergies have resulted in elevated leverage (i.e., 4.6x in between the partnership and Ulysses International (the (1) (2) FY’18) and sub-1.0x distribution coverage (i.e., 0.96x company’s European LPG distribution segment). This is 12/10/2018 $3.80 $2.23 $1.71+ (4 on a TTM basis). We believe a distribution cut is also a likely outcome if management concludes that the prudent as it would improve debt metrics, build MLP is no longer a viable funding vehicle for its domestic distribution coverage, and address the dislocated propane business. If improving Abe’s near-term financial equity yield.” position is the priority, then just eliminating the IDRs or exercising the SECA (absent the GP providing a subsidy) would not achieve this goal, in our view. We estimate that leverage would still be elevated under these two
“We currently expect Abe will monitor its scenarios.” distribution at current levels (heating season will be
-Wells Fargo 12/10/18 the determining factor) and note two factors 1) at the low end of the guide it still results in roughly 1x coverage and it’s not forced by covenants or agencies 12/13/2018 3.80 3.80 3.80 and 2) Ulysses relies on the IDR cash flow. That said we see an increasing downside risk scenario that would result in a roughly 35% distribution cut should the beginning of 2019 be unseasonably warm and the “Given the uncertainty surrounding a final disposition of heating season end up being warmer than normal.” what Ulysses will do with Abe across its various options, it’s hard to imagine a scenario that quickly returns unit values to previous levels (unless Ulysses commits to maintaining the distribution at current levels through FY19/FY20, which seems unlikely given the range of communicated possibilities).” “Given what we heard at investor day and the
-Janney 12/13/18 improving metrics, we don’t see a need for 12/13/2018 3.80 3.80 3.80 Ulysses/Abe to cut [Abe’s distribution], other than the market has already priced in a significant cut.”
“Abe has been under pressure since its analyst day in part due to a lack of resolution to its IDR structure and in recent days its distribution sustainability.”
-UBS 12/13/18
1/15/2019 3.80 3.80 3.80 0%
___________________________________
(1) 2019E distribution forecast is $0.95/unit for Q1 2019 and $0.43/unit for Q2-Q4 ($2.23/unit annualized). 11
(2) Distribution forecast for 2020E is $0.43/unit for Q1-Q4 ($1.71/unit annualized) and gradually increases each subsequent year.
TUDORPICKERING HOLT&CO
ENERGY INVESTMENT & MERCHANT BANKING
PRELIMINARY CONFIDENTIAL DRAFT Subject to Further Review & Revision
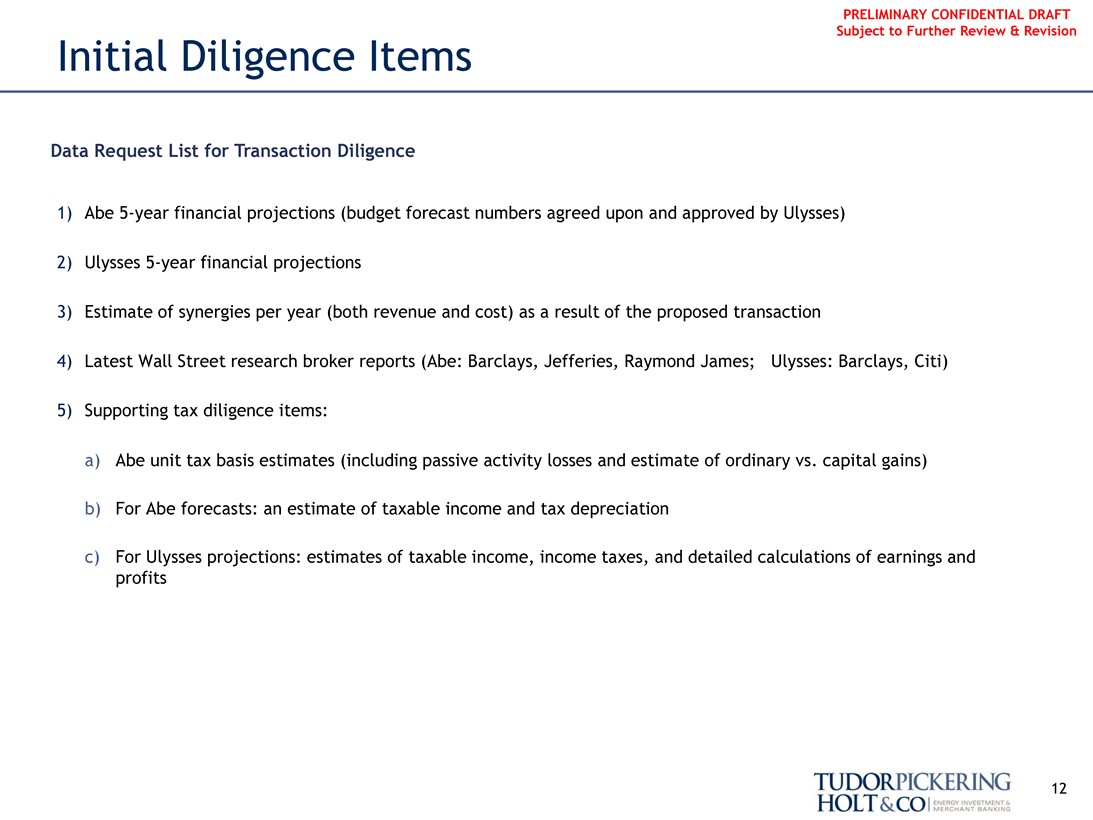
Initial Diligence Items
Data Request List for Transaction Diligence
1) Abe5-year financial projections (budget forecast numbers agreed upon and approved by Ulysses)
2) Ulysses5-year financial projections
3) Estimate of synergies per year (both revenue and cost) as a result of the proposed transaction
4) Latest Wall Street research broker reports (Abe: Barclays, Jefferies, Raymond James;Ulysses: Barclays, Citi)
5) Supporting tax diligence items:
a) Abe unit tax basis estimates (including passive activity losses and estimate of ordinary vs. capital gains)
b) For Abe forecasts: an estimate of taxable income and tax depreciation
c) For Ulysses projections: estimates of taxable income, income taxes, and detailed calculations of earnings and profits
12
TUDORPICKERING HOLT&CO
ENERGY INVESTMENT & MERCHANT BANKING
PRELIMINARY CONFIDENTIAL DRAFT Subject to Further Review & Revision
Disclosure Statement
Tudor, Pickering, Holt & Co. does not provide accounting, tax or legal advice. In addition, we mutually agree that, subject to applicable law, you (and your employees, representatives and other agents) may disclose any About The Firm aspects of any potential transaction or structure described herein that are necessary to support any U.S. federal income tax benefits, and all materials Tudor, Pickering, Holt & Co. is an integrated energy investment and of any kind (including tax opinions and other tax analyses) related to those merchant bank, providing high quality advice and services to benefits, with no limitations imposed by Tudor, Pickering, Holt & Co. institutional and corporate clients. Through the company’s two broker-The information contained herein is confidential (except for information dealer units, Tudor, Pickering, Holt & Co. Securities, Inc. (TPHCSI) and relating to United States tax issues) and may not be reproduced in whole or Tudor Pickering Holt & Co Advisors LP (TPHCA), members FINRA, in part. together with affiliates in the United Kingdom and Canada, the company offers securities and investment banking services to the energy Tudor, Pickering, Holt & Co. assumes no responsibility for independent community. Perella Weinberg Partners Capital Management LP is an SEC verification of third-party information and has relied on such information registered investment adviser that delivers a suite of energy investment being complete and accurate in all material respects. To the extent such strategies. information includes estimates and forecasts of future financial performance The firm, headquartered in Houston, Texas, has approximately (including estimates of potential cost savings and synergies) prepared by, 170 employees and offices in Calgary, Canada; Denver, Colorado; New reviewed or discussed with the managements of your company and/ or other York, New York; and London, England. potential transaction participants or obtained from public sources, we have assumed that such estimates and forecasts have been reasonably prepared Contact Us on bases reflecting the best currently available estimates and judgments of Houston (Research, Sales and Trading):713-333-2960 such managements (or, with respect to estimates and forecasts obtained Houston (Investment Banking):713-333-7100 from public sources, represent reasonable estimates). These materials were Houston (Asset Management):713-337-3999 designed for use by specific persons familiar with the business and the Denver (Sales):303-300-1900 affairs of your company and Tudor, Pickering, Holt & Co. materials.
Denver (Investment Banking):303-300-1900 Under no circumstances is this presentation to be used or considered as an New York (Investment Banking):212-610-1660 offer to sell or a solicitation of any offer to buy, any security. Prior to New York (Research, Sales):212-610-1600 making any trade, you should discuss with your professional tax, accounting, London: +011 44(0) 20 7268 2800 or regulatory advisers how such particular trade(s) affect you. This brief Calgary:403-705-7830 statement does not disclose all of the risks and other significant aspects of www.TPHco.com entering into any particular transaction.
Copyright 2019 — Tudor, Pickering, Holt & Co. Tudor, Pickering, Holt & Co. operates in the United Kingdom under the trading name Perella Weinberg Partners UK LLP (authorized and regulated by the Financial Conduct Authority), and in Canada through its affiliate, Tudor, Pickering, Holt & Co. Securities – Canada, ULC, located in Calgary, Alberta.
13
TUDORPICKERING HOLT&CO
ENERGY INVESTMENT & MERCHANT BANKING


